1794
Evaluation of different References for the Quantification of Tissue Sodium Concentration in Patients with ischemic Stroke1Computer Assisted Clinical Medicine, Medical Faculty Mannheim, Heidelberg University, Mannheim, Germany, 2Department of Neuroradiology, Medical Faculty Mannheim, Heidelberg University, Mannheim, Germany, 3Department of Neurology, Medical Faculty Mannheim, Heidelberg University, Mannheim, Germany, 4Heidelberg University, Mannheim, Germany
Synopsis
23Na MRI is an indicator for cell viability and quantification provides the tissue sodium concentration (TSC). Aim of this study is to evaluate the reliability of cerebrospinal fluid (CSF) and vitreous humor (VH) as internal references for TSC quantification. Data of 49 patients with ischemic stroke was included for TSC quantification which was performed based on signal intensity within external references, CSF and VH. TSC of healthy tissue was significantly lower compared to pathological tissue. Results showed a high similarity between the three quantification methods. Internal references would simplify 23Na MRI measurements and thus its clinical establishment.
Introduction
Sodium (23Na) MRI has been proposed as an addition to conventional 1H MRI and has shown to demonstrate alterations in the physiology[1-3]. It is an indicator for cell presence and viability[4,5]. Quantification of 23Na MRI is based on references with a known sodium concentration and provides the tissue sodium concentration (TSC). Particularly in the human brain, TSC has been broadly studied for pathologies such as stroke[6,7], tumors[2,4], or multiple sclerosis[8,9]. The sodium concentration in the human body is at 145 mM extracellular and 10-15 mM intracellular. Therefore, all tissue’s sodium concentration is assumed to be in between and an elevated TSC represents an increase in intracellular sodium concentration or an increase in extracellular volume fraction[10,11]. Using reference phantoms within the field of view (FoV) is common for TSC quantification but their correct placement is crucial and causes additional challenges[5,12,13]. The aim of this study is to evaluate the possibility and reliability of internal regions as references. The cerebrospinal fluid (CSF) within the lateral ventricle as well as the vitreous humor (VH) have been used previously because of their homogenous and constant distribution of sodium.Methods
This study is a retrospective analysis from the data of a prospective study. 49 patients with ischemic stroke that underwent 23Na MRI within the first 72 hours after onset of stroke were included.The study protocol included a T2w FLAIR, a diffusion-weighted image for the absolute diffusion coefficient (ADC) map as well as a 3D-radial density-adapted 23Na MRI sequence. Data acquisition was performed at 3T (Magnetom Trio, Siemens Healthcare GmbH, Erlangen, Germany) with a dual-tuned 1H/23Na bird cage head coil (Rapid Biomedical, Rimpar Germany). 23Na MRI sequence parameters: TR=100ms, TE=0.2ms, resolution=(4.01mm)3, number of spokes=6000, TA=10min.
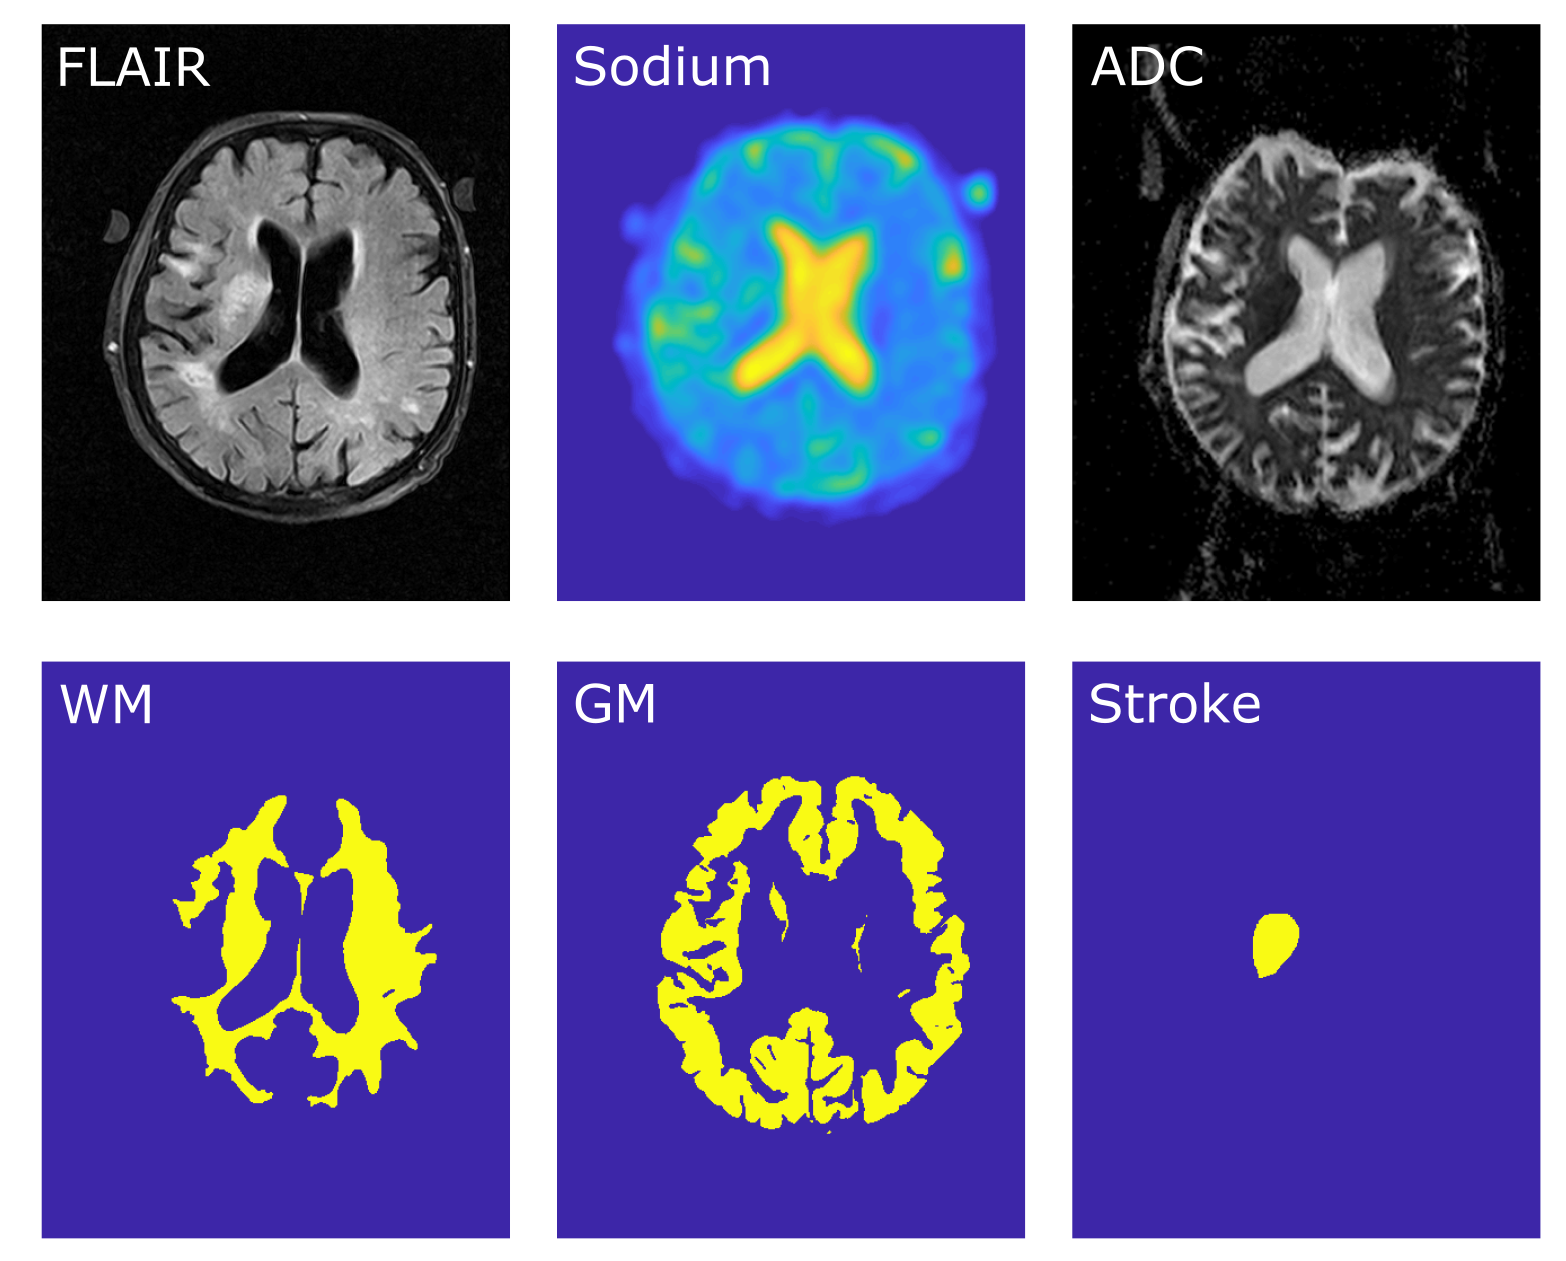
Image reconstruction was performed offline in MATLAB 2015a (The Mathworks, Nattick, MA, USA). Image co-registration to the patient’s FLAIR image and automatic segmentation into white matter (WM) and grey matter (GM) was performed with SPM12 (Wellcome Centre for Human Neuroimaging, UCL, London, United Kingdom). Whole brain segmentation was performed through thresholding and the stroke region was manually segmented by a neuroradiologist based on the ADC, Figure1.
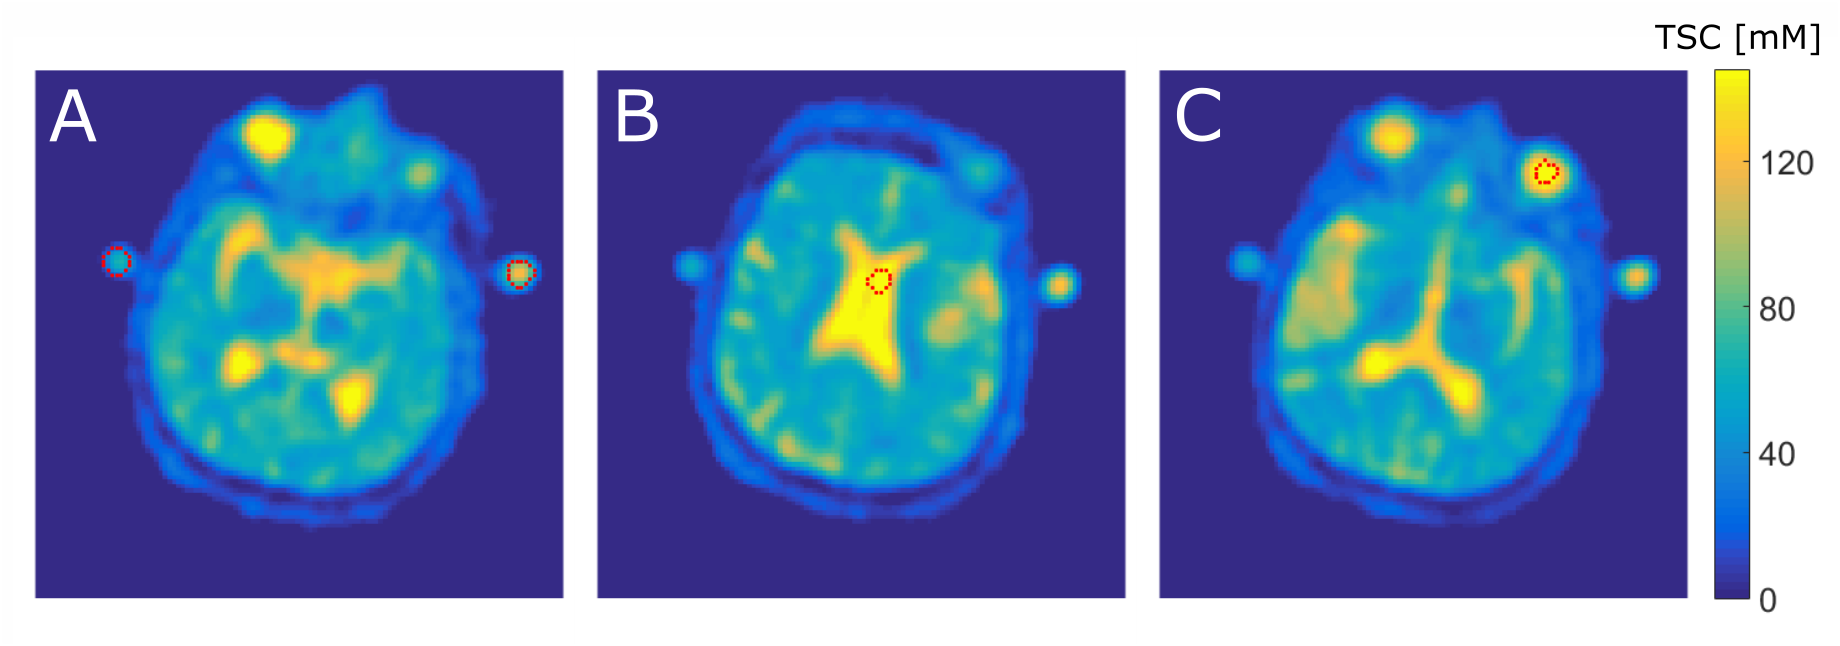
During each scan, two reference vials (50mM and 100mM NaCl, 2% Agarose each) were attached to the patient’s head. TSC quantification was based on the signal intensity (SI) within the reference vials which was measured by defining three-dimensional ROIs within the phantoms’ core. Linear regression was performed:
$$TSC_{Tissue}=SI_{Tissue}\frac{TSC_{Phantom1}-TSC_{Phantom2}}{SI_{Phantom1}-SI_{Phantom2}}$$
Additionally, three dimensional ROIs were segmented within the patient’s left vitreous humor and within the lateral ventricle, Figure2. Two additional image quantifications were performed based on SI within those regions, assuming both regions were entirely extracellular with a sodium concentration of 145mM.
$$TSC_{Tissue}=SI_{Tissue}\frac{145 mM}{SI_{CSF,VH}}$$
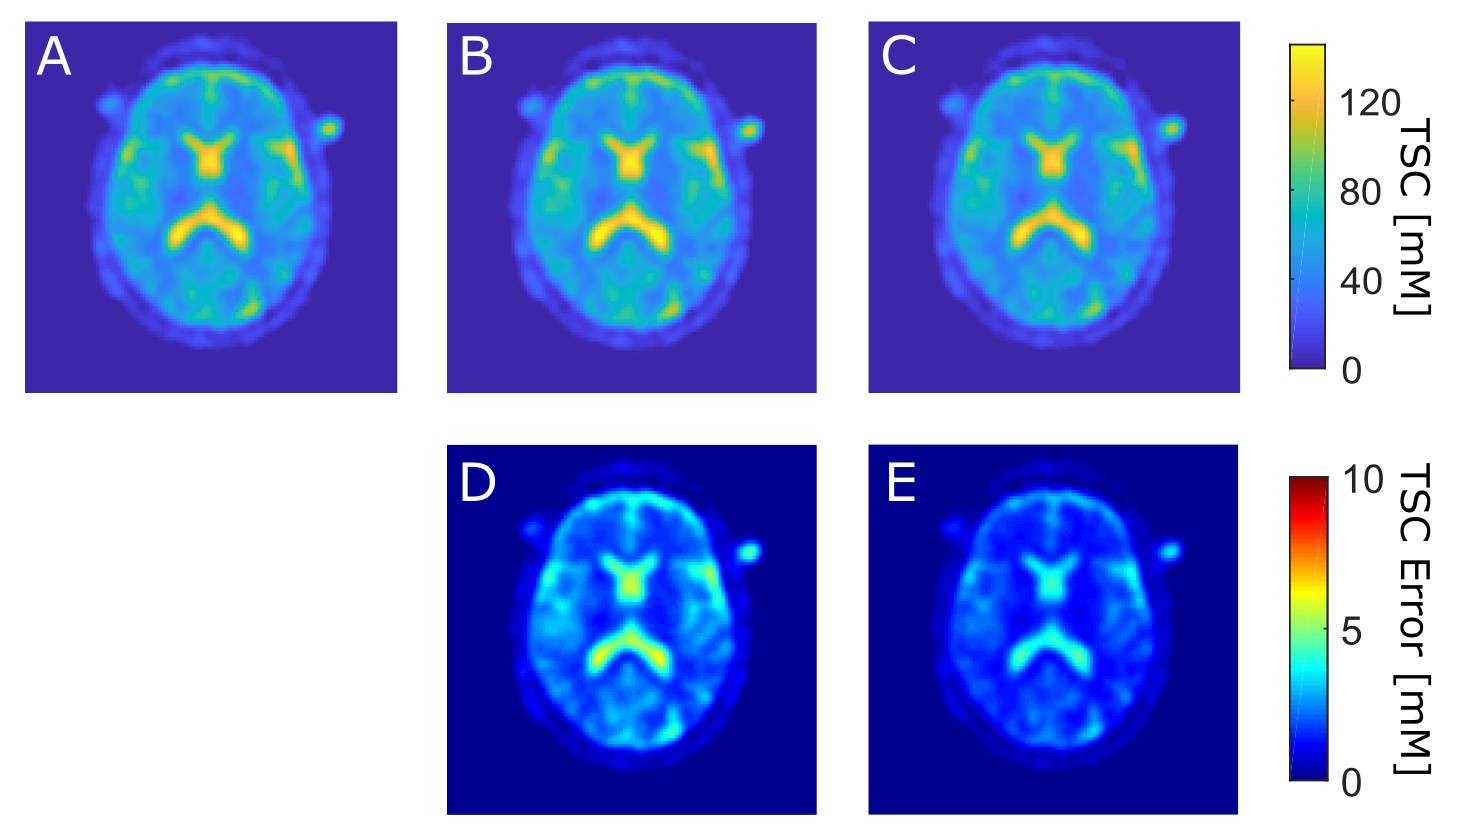
Mean absolute TSC in WM, GM, and stroke region were evaluate for all three TSC maps (quantification based on vials, CSF, VH) and the differences between TSC maps were evaluated voxel-wise for the whole brain, WM, GM, and stroke region separately, Figure3. The paired student t-test was performed to evaluate statistically significant differences.
Results
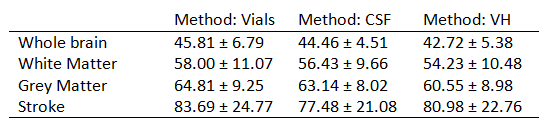
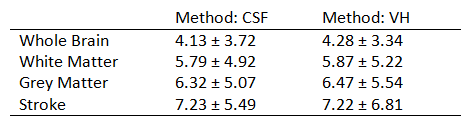
Mean absolute TSC values in WM, GM, and stroke region for the quantification based on vials, CSF and VH are listed in Table1. TSC of healthy tissue (WM, GM) was significantly lower (p<0.001) compared to pathological tissue (stroke) for all three quantification methods.The voxel-wise evaluation of TSC maps showed absolute mean differences of 4.13±3.72mM (between vials and CSF method) and 4.28±3.34mM (between vials and VH method) in the whole brain. TSC differences for whole brain, WM, GM and stroke are listed in Table2. TSC differences between vials and CSF method and TSC differences between vials and the VH method were not significantly different for any tissue type (p>0.75).
Discussion
This study indicates a high similarity between the TSC maps of all three quantification methods. CSF and VH method revealed differences compared to the vials method, which is currently considered the gold standard. However, results show that all methods are able to differentiate between pathological (stroke) and healthy tissue.External reference vials provide additional challenges for 23Na MRI measurements[5] or might even be forgotten. Furthermore, the vials might cause discomfort for the patient since they are closely attached to the patient’s head for most accurate results and a guaranteed placement within the FoV. Those hurdles might eventually hamper the establishment of 23Na MRI entirely.
Both novel methods are more comfortable for the patient because reference vials attached to the head are not needed. Due to B1+/-inhomogeneities, higher accuracy can be assumed for references closer located to the investigated tissue, which further favors internal references.
Obviously, references require precise information about their sodium concentration, which is given for external references but still needs more research for internal ones, like correlation between sodium in CSF and blood sodium concentration.
Accuracy of TSC quantification with both methods of internal references will be further investigated. Thorough research about constant TSC values within certain regions such as vitreous humor or cerebrospinal fluid will follow.
Conclusion
The introduction of internal references as replacement for external references might be of high value for the clinical establishment of 23Na MRI in the human brain. The authors suggest the VH or the CSF as internal references.Acknowledgements
The study was funded by Dietmar-Hopp Stiftung.References
1. Madelin, G. and R.R. Regatte, Biomedical applications of sodium MRI in vivo. J Magn Reson Imaging, 2013. 38(3): p. 511-29.
2. Thulborn, K.R., et al., Quantitative tissue sodium concentration mapping of the growth of focal cerebral tumors with sodium magnetic resonance imaging. Magnetic Resonance in Medicine: An Official Journal of the International Society for Magnetic Resonance in Medicine, 1999. 41(2): p. 351-359.
3. Boada, F.E., et al., Quantitative in vivo tissue sodium concentration maps: The effects of biexponential relaxation. Magnetic Resonance in Medicine, 1994. 32(2): p. 219-223.
4. Ouwerkerk, R., et al., Tissue sodium concentration in human brain tumors as measured with 23Na MR imaging. Radiology, 2003. 227(2): p. 529-537.
5. Hu, R., et al., X-nuclei imaging: Current state, technical challenges, and future directions. J Magn Reson Imaging, 2020. 51(2): p. 355-376.
6. Thulborn, K.R., et al., Comprehensive MR imaging protocol for stroke management: tissue sodium concentration as a measure of tissue viability in nonhuman primate studies and in clinical studies. Radiology, 1999. 213(1): p. 156-166.
7. Neumaier-Probst, E., et al., A double-tuned 1H/23Na resonator allows 1H-guided 23Na-MRI in ischemic stroke patients in one session. Int J Stroke, 2015. 10 Suppl A100: p. 56-61.
8. Madelin, G., et al. 3T Sodium MRI of patients with Multiple Sclerosis. in Proc. Intl. Soc. Mag. Reson. Med. 2008.
9. Eisele, P., et al., Heterogeneity of acute multiple sclerosis lesions on sodium (23Na) MRI. Multiple Sclerosis Journal, 2016. 22(8): p. 1040-1047.
10. Burstein, D. and C.S. Springer Jr, Sodium MRI revisited. Magnetic resonance in medicine, 2019. 82(2): p. 521-524.
11. Bai, R., et al., Fast, Na+/K+ pump driven, steady‐state transcytolemmal water exchange in neuronal tissue: A study of rat brain cortical cultures. Magnetic resonance in medicine, 2018. 79(6): p. 3207-3217.
12. Grapperon, A.-M., et al., Quantitative brain sodium MRI depicts corticospinal impairment in amyotrophic lateral sclerosis. Radiology, 2019. 292(2): p. 422-428.
13. Riemer, F., et al., Measuring tissue sodium concentration: Cross‐vendor repeatability and reproducibility of 23Na‐MRI across two sites. Journal of Magnetic Resonance Imaging, 2019. 50(4): p. 1278-1284.
Figures