1793
23Na MRI of mild traumatic brain injury: linear regression analysis reveals decreased total sodium concentration1Center for Biomedical Imaging, Department of Radiology, New York University Grossman School of Medicine, NEW YORK, NY, United States, 2Department of Rehabilitation Medicine, New York University Grossman School of Medicine, NEW YORK, NY, United States, 3Department of Psychiatry, New York University Grossman School of Medicine, NEW YORK, NY, United States, 4Ronald O. Perelman Department of Emergency Medicine, New York University Grossman School of Medicine, NEW YORK, NY, United States
Synopsis
In this quantitative sodium MRI study, 27 mild traumatic brain injury (mTBI) and 19 controls were scanned at 3 T. Linear regression analysis was used to measure total sodium concentrations (TSC) in global grey and white matter. We found statistically significant lower global grey and white matter TSC in mTBI patients compared to controls. This suggests that sodium imbalances in TBI, well-recognized from basic research, can be detectable non-invasively, are widespread over the entire brain, and are present even when the injury is clinically mild.
Introduction
Traumatic brain injuries (TBI) secondary to head trauma are one of the main causes of neurological disabilities worldwide.1 Despite its low severity, mild TBI (mTBI) patients often present with physical, psychiatric, emotional and cognitive problems.2 The biological correlates of these manifestations, however, are not detected on conventional CT and MRI.3 The pathological cascade of tissue damage in mTBI is set forth by a perturbation in ionic homeostasis. The Na+/K+-exchange pump can be affected by energy deficits due to mitochondrial dysfunction, as well as by diffuse axonal injury, the histopathological signature of TBI.4,5 Cerebral 23Na MRI allows a quantitative assessment of new biochemical information in brain, such as ion homeostasis, which is vital for cell viability. Here, we used 23Na MRI to quantify total sodium concentrations (TSC) using linear regression analysis, as commonly done with MR spectroscopic imaging.6–8 Linear regression increases the signal-to-noise ratio, and partial volume effects are strongly reduced, which has also been shown previously for sodium imaging.9 This results in high sensitivity to global changes in GM and WM.6 We test the hypotheses that global TSC: (i) are higher in patients than in controls; and (ii) correlate with clinical presentation and neuropsychological function.Materials & Methods
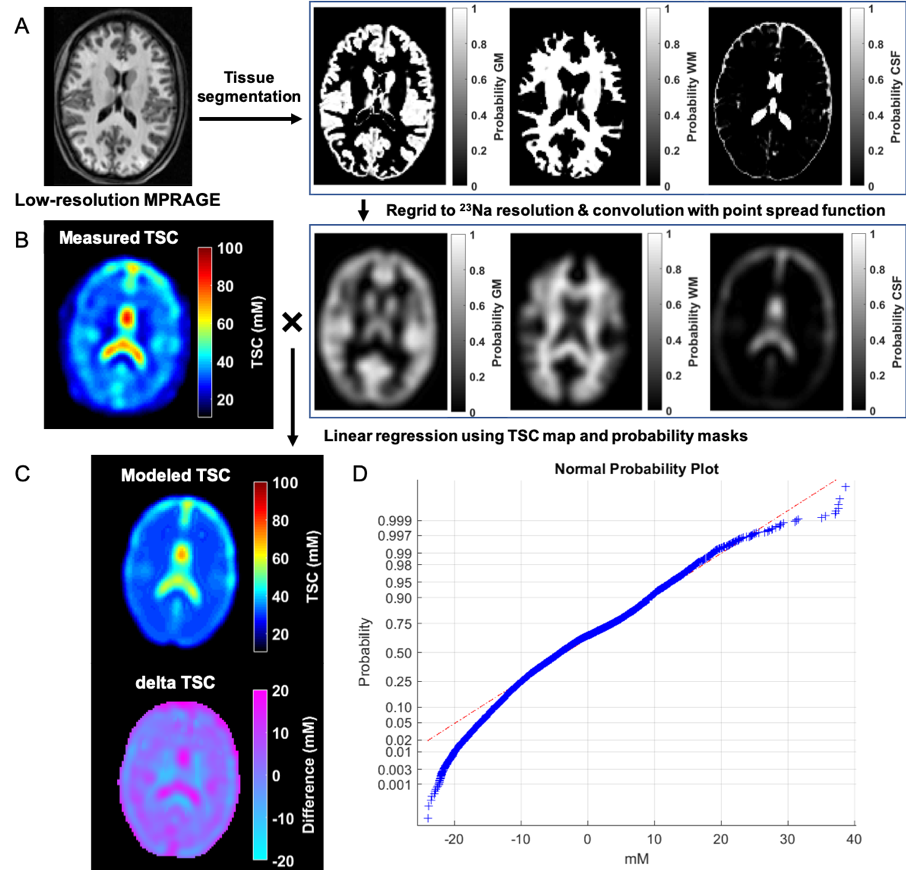
Twenty-seven patients (18-60 years, 20 females) with confirmed mTBI and nineteen age-matched healthy volunteers (23-54 years, 12 females) were scanned on 3T (Magnetom Prisma, Siemens Healthineers). The scanning of mTBI patients occurred 22.1±10.2 days after injury (range 5–53 days). A 20-channel quadrature head coil (Siemens Healthineers) was used for 1H imaging. The qualitative screening included 3D MPRAGE (TR/TE/TI=2400/2.24/1060 ms; flip angle=8°; in-plane FOV=256×256 mm2; 208 slices, slab thickness=0.8 mm; voxel size=0.8×0.8×0.8 mm³; TA=6:38 min), FLAIR (TR/TE/TI=9000/81/2500 ms; 30 slices, in-plane FOV=220×220 mm2; voxel size=0.7×0.7×5.0 mm³; TA=2:44 min) and SWI (TR/TE=28/20 ms; flip angle=15°; in-plane FOV=220x220 mm2; voxel size=0.7×0.7×3.0 mm³; TA=3:46 min). A radiologist examined qualitative 1H images for areas with possible hematoma, haemorrhage, diffuse or traumatic axonal injury, which were excluded for TSC quantification. Sodium imaging was performed using an in-house 1H/23Na double-tuned head coil. All 23Na images were acquired using a 3D FLORET sequence10 (TE=0.2 ms, TR=100 ms, 3 hubs at 45°, interleaves/hub=26, resolution=6 mm isotropic, 46 averages, TA=5:59 min). 23Na signals were calibrated using the eyes. Brain segmentation was performed using SPM12 (UCL, UK) from MPRAGE data. Global TSC values in WM and GM were obtained with linear regression over all brain voxels (Fig.1). The TSC signal in each voxel was modelled as a sum of the three compartments (GM, WM, and CSF), where unknown concentrations C of WM and GM (CCSF=140mM) and volume fractions f were derived from the corrected probability masks:TSC = CGMfGM + CWMfWM + CCSFfCSF
All brain voxels were then used for the over-determined equations for and , which were solved with least-squares optimization. All mTBI patients also underwent clinical and neurocognitive testing including the Rivermead post-concussion symptoms questionnaire (RPQ)11, the Glasgow Outcome Scale – Extended (GOSE)12, and the Brief Test of Adult Cognition by Telephone (BTACT)13. TSC measurements from mTBI and controls were compared with a Mann-Whitney (MW) test. MW and analysis of covariance (ANCOVA) were used to compare patients who showed recovery (GOSE=8) with patients who did not (GOSE<8). Spearman rank correlations without and with adjustment for the elapsed time from injury assessed the associations between TSC and BTACT and RPQ. Statistical difference was defined as p<0.05.
Results
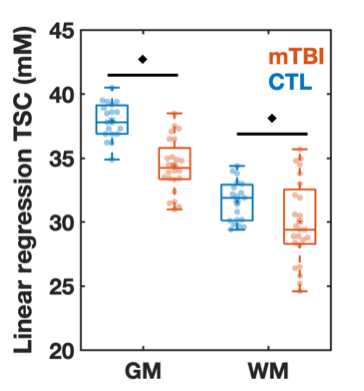
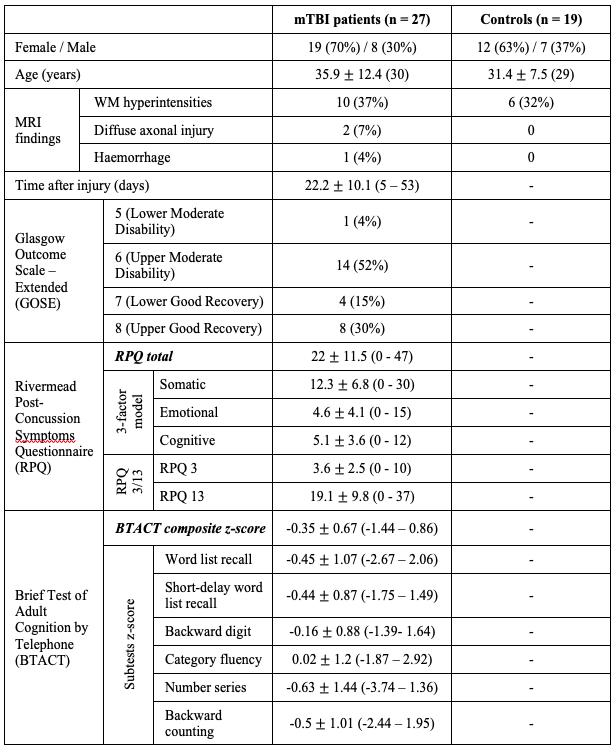
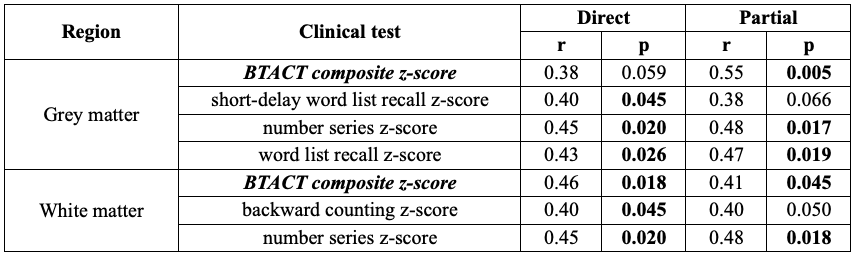
Demographics, clinical presentation and cognitive testing results are compiled in Table 1. At time of scanning, eight patients had recovered from their injury, as assessed by a GOSE score of 8. Both TSC of GM and WM were lower in mTBI than in controls (Fig.2). There was lower TSC in GM in both non-recovered and recovered groups compared to controls (ANCOVA p<0.001, MW p<0.001) and a lower TSC in WM in non-recovered patients compared to controls (ANCOVA p=0.034, MW p=0.038). GM and WM TSC correlated positively with BTACT sub-tests and composite z-score (Table 2). The strongest correlation for TSC in WM was observed with the composite z-score (Direct, r=0.46 with p=0.018), while TSC in GM correlated the strongest to imaging with number series z-score (Direct, r=0.45 with p=0.02).Discussion & Conclusion
We implemented a partial volume-corrected global analysis using linear regression quantification to test the hypotheses that diffuse TSC increases are detectable after mTBI and correlate with patient outcome. Global TSC were abnormal in both GM and WM of patients, however, they were lower, rather than higher in mTBI compared to controls. Lower TSC in both tissue types correlated with worse neuropsychological function, suggesting a potential biomarker role. The observed decrease of TSC could be explained by cell swelling and sodium influx; a small increase in the intracellular volume can result in the decreased TSC, even if the intracellular sodium concentration increases. Based on the lower global TSC detected using linear regression analysis, we provide evidence that in TBI there is an overall, diffuse, disturbance of the sodium homeostasis in both GM and WM. These findings lay the ground for further studies aimed at (i) understanding the pathophysiology of TBI from the standpoint of ionic imbalances and (ii) development of clinical biomarkers for said abnormalities.Acknowledgements
This work was supported by grants R01NS097494 and R01EB026456 from the National Institutes of Health (NIH).References
1. Dang, B., Chen, W., He, W. & Chen, G. Rehabilitation Treatment and Progress of Traumatic Brain Injury Dysfunction. Neural Plast. 2017, 1–6 (2017).
2. Maas, A. I. R. et al. Traumatic brain injury: integrated approaches to improve prevention, clinical care, and research. Lancet Neurol. 16, 987–1048 (2017).
3. Blennow, K. et al. Traumatic brain injuries. Nat. Rev. Dis. Prim. 2, 16084 (2016).
4. Saraiva, A. L. L. et al. Creatine reduces oxidative stress markers but does not protect against seizure susceptibility after severe traumatic brain injury. Brain Res. Bull. 87, 180–186 (2012).
5. Lima, F. D. et al. Na+,K+-ATPase activity impairment after experimental traumatic brain injury: Relationship to spatial learning deficits and oxidative stress. Behav. Brain Res. 193, 306–310 (2008).
6. Tal, A., Kirov, I. I., Grossman, R. I. & Gonen, O. The role of gray and white matter segmentation in quantitative proton MR spectroscopic imaging. NMR Biomed. 25, 1392–1400 (2012).
7. Pan, J. W., Twieg, D. B. & Hetherington, H. P. Quantitative spectroscopic imaging of the human brain. Magn. Reson. Med. 40, 363–369 (1998).
8. Doyle, T. J., Bedell, B. J. & Narayana, P. A. Relative Concentrations of Proton MR Visible Neurochemicals in Gray and White Matter in Human Brain. Magn. Reson. Med. 33, 755–759 (1995).
9. Kim, S. et al. Voxel‐wise partial volume correction method for accurate estimation of tissue sodium concentration in 23 Na‐MRI at 7 T. NMR Biomed. 1–14 (2020). doi:10.1002/nbm.4448
10. Pipe, J. G. et al. A new design and rationale for 3D orthogonally oversampled k-space trajectories. Magn. Reson. Med. 66, 1303–1311 (2011).
11. King, N. S., Crawford, S., Wenden, F. J., Moss, N. E. G. & Wade, D. T. The Rivermead Post Concussion Symptoms Questionnaire: a measure of symptoms commonly experienced after head injury and its reliability. J. Neurol. 242, 587–592 (1995).
12. Wilson, J. T., Pettigrew, L. E. & Teasdale, G. M. Structured interviews for the Glasgow Outcome Scale and the extended Glasgow Outcome Scale: guidelines for their use. J. Neurotrauma 15, 573–85 (1998).
13. Tun, P. A. & Lachman, M. E. Telephone assessment of cognitive function in adulthood: the Brief Test of Adult Cognition by Telephone. Age Ageing 35, 629–632 (2006).
14. Eyres, S., Carey, A., Gilworth, G., Neumann, V. & Tennant, A. Construct validity and reliability of the Rivermead Post-Concussion Symptoms Questionnaire. Clin. Rehabil. 19, 878–887 (2005).
15. Smith-Seemiller, L., Fow, N. R., Kant, R. & Franzen, M. D. Presence of post-concussion syndrome symptoms in patients with chronic pain vs mild traumatic brain injury. Brain Inj. 17, 199–206 (2003).
Figures