1792
Accuracy of quantified 23Na MRI in ischemic Stroke with varying undersampling Factors and CNN Postprocessing1Computer Assisted Clinical Medicine, Medical Faculty Mannheim, Heidelberg University, Mannheim, Germany, 2Mannheim Institute for Intelligent System in Medicine, Medical Faculty Mannheim, Heidelberg University, Mannheim, Germany, 3Department of Neuroradiology, Medical Faculty Mannheim, Heidelberg University, Mannheim, Germany, 4Department of Neurology, Medical Faculty Mannheim, Heidelberg University, Mannheim, Germany
Synopsis
This study investigates factors of k-space undersampling for which CNN postprocessing is able to improve 23Na MRI data. Data from 53 patients with ischemic stroke was included and image reconstruction was performed with full k-space data (FI) and with k-space data that was reduced (RI) by different factors (S = 2, 4, 5 and 10). Postprocessing with a convolutional neural network was applied to the highly undersampled 23Na MRI data. The CNN was able to significantly improve SNR and SSIM for all S with both loss functions. CNN postprocessing could enable significant reduction of 23Na MRI data acquisition time.
Introduction
23Na MRI in the human brain provides information that cannot be derived from conventional 1H MRI alone [1-3].Quantification of 23Na MRI generates the tissue sodium concentration (TSC) which is affected by changes of the intracellular sodium concentration as well as by changes of the intra-/extracellular volume fraction [4, 5]. There have been various studies over the last years showing the effect on TSC of different pathologies, e.g. stroke [6, 7], MS, neurodegenerative diseases [8] and tumors [3, 9].
Convolutional neural networks have shown to improve the image quality in 1H MRI via postprocessing and enable image reconstruction [10, 11].
This study investigates factors of k-space undersampling for which CNN postprocessing is able to improve 23Na MRI data.
Methods
We included data from 53 patients with ischemic stroke. All patients underwent a standard clinical stroke MRI examination within 72 hours after onset of stroke at 3T (Magnetom Trio, Siemens Healthineers, Erlangen, Germany) with a dual-tuned 1H/23Na bird cage head coil (Rapid Biomedical, Rimpar, Germany). Additionally, a 3D-radial density-adapted 23Na MRI sequence was acquired. The 23Na MRI sequence comprised 6000 spokes with 384 samples each, repetition time was 100ms and echo time 0.2ms, acquisition time was 10min.Image reconstruction was performed in MATLAB 2015a using a regridding algorithm, a Hanning filter in k-space and a Kaiser-Bessel window (width=4). A zero filling factor of 2 was applied to achieve an apparent isotropic resolution of 2x2x2mm3.
Different image reconstructions were performed:
1. Full image (FI) reconstruction with all data that was acquired in k-space (6000 spokes)
2. Reduced image (RI) reconstructions with only a fraction (undersampling factor: S) of all acquired k-space data (6000/S spokes)
Different S (2, 4, 5, and 10) were used to simulate a 23Na MRI from differently undersampled k-space data. Figure 1 depicts the effect of the different undersampling factors.
Reconstructed image data was used to test and train a CNN that was implemented based on a U-Net architecture[12] with additional residual connections. The network had four encoding and four decoding stages (2 to 3 convolutional layers each). The batch size was 8, no batch-normalization was used. The number of filters initially was 16 and was doubled with each encoding stage. Training ran for 20 epochs with an Adam optimizer and a learning rate of 0.001. The two loss function L2 (mean squared error) and LGDL (mean squared error plus gradient difference loss) were implemented:
$$L_2(\hat{y},y)=\sum\nolimits_{i,j} |y_{i,j}-\hat{y}_{i,j}|^2$$
$$L_{GDL}(\hat{y},y)=L_2+0.5(\sum\nolimits_{i,j}||y_{i,j}-y{i-1,j}|-|\hat{y}_{i,j}-\hat{y}_{i-1,j}||^2+||y_{i,j}-y{i,j-1}|-|\hat{y}_{i,j}-\hat{y}_{i,j-1}||^2)$$
With $$$i$$$, $$$j$$$ defining the pixel, $$$y$$$ being the network’s label and $$$\hat{y}$$$ being the network’s output.The CNN was trained with RI as input and FI as label. The data set was split into 42 training, 8 test and 3 validation cases.
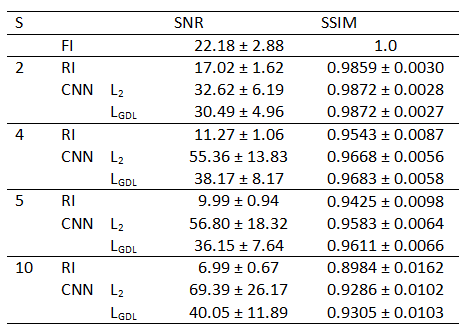
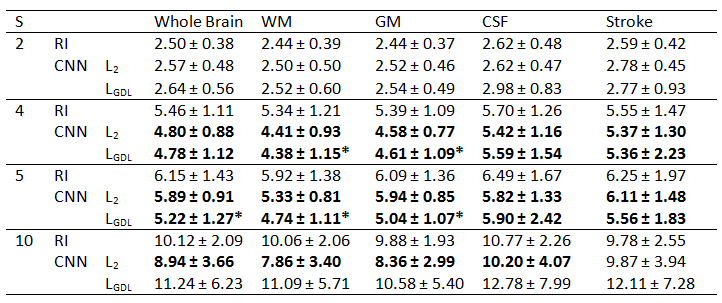
CNN output images (Figure 1) were evaluated by calculating SNR and SSIM to FI. Furthermore, TSC was quantified for all images and then coregistered to the patient’s FLAIR image which was automatically segmented into white matter (WM), grey matter (GM) and cerebrospinal fluid (CSF) with SPM12 (Wellcome Centre for Human Neuroimaging, UCL, London, United Kingdom). The stroke region was manually segmented based on the ADC map. The whole brain was defined as combination of all tissue masks.
Absolute TSC differences between FI and RI (from all different S) and the CNN output images were calculated in the respective regions. Statistical analysis was performed using the paired student t-test.
Results
The study showed a strong negative correlation between the undersampling factor S and the image’s SNR (R=-0.89) and the image’s SSIM to the fully reconstructed image (R=-0.99). The CNN was able to improve SNR and SSIM for all S with both loss functions significantly (p<0.005), Table 1.TSC quantification of RI and of the CNN images with both loss functions showed that CNN postprocessing enabled a significant reduction of absolute TSC differences to FI (ground truth). Evaluating the different tissue types separately, only WM and GM showed a significant reduction of TSC quantification error for S=4 and S=5 as a result from the CNN postprocessing with loss function LGDL whereas the error reduction from postprocessing with L2 was not statistically significant. TSC error reductions in CSF and in the stroke region were present but not statistically significant, Table 2. Error maps in the different region are depicted in Figure 2 for S=5.
Discussion
This study shows that CNNs are able to improve image quality (measured as SNR and SSIM to ground truth) of differently undersampled 23Na MRI significantly. TSC quantification was best improved for S=4 and S=5, indicating a lower and an upper threshold for beneficial CNN postprocessing.Loss function LGDL was more efficient for the reduction of TSC quantification error compared to L2, showing an additional value arising from the gradient difference loss. More research about its optimal weighting will follow.
Previously, undersampling of 23Na MRI k-space has been performed with time consuming compressed sensing techniques [13,14] whereas CNNs – once trained – offer fast processing pipelines.
Conclusion
Prospectively, CNN postprocessing could enable significant reduction of 23Na MRI data acquisition time while preserving TSC quantification accuracy and reducing the loss in image quality induced by undersampling.Acknowledgements
The study was funded by Dietmar-Hopp Stiftung.References
1. Hu, R., et al., X-nuclei imaging: Current state, technical challenges, and future directions. J Magn Reson Imaging, 2020. 51(2): p. 355-376.
2. Boada, F.E., et al., Quantitative in vivo tissue sodium concentration maps: The effects of biexponential relaxation. Magnetic Resonance in Medicine, 1994. 32(2): p. 219-223.
3. Thulborn, K.R., et al., Quantitative tissue sodium concentration mapping of the growth of focal cerebral tumors with sodium magnetic resonance imaging. Magnetic Resonance in Medicine: An Official Journal of the International Society for Magnetic Resonance in Medicine, 1999. 41(2): p. 351-359.
4. Hilal, S.K., et al., In Vivo NMR Imaging of Sodium-23 in the Human Head. Journal of Computer Assisted Tomography, 1985. 9(1): p. 1-7.
5. Burstein, D. and C.S. Springer, Jr., Sodium MRI revisited. Magn Reson Med, 2019. 82(2): p. 521-524.
6. Neumaier-Probst, E., et al., A double-tuned 1H/23Na resonator allows 1H-guided 23Na-MRI in ischemic stroke patients in one session. Int J Stroke, 2015. 10 Suppl A100: p. 56-61.
7. Thulborn, K.R., et al., Comprehensive MR imaging protocol for stroke management: tissue sodium concentration as a measure of tissue viability in nonhuman primate studies and in clinical studies. Radiology, 1999. 213(1): p. 156-166.
8. Mellon, E., et al., Sodium MR imaging detection of mild Alzheimer disease: preliminary study. American Journal of Neuroradiology, 2009. 30(5): p. 978-984.
9. Ouwerkerk, R., et al., Tissue sodium concentration in human brain tumors as measured with 23Na MR imaging. Radiology, 2003. 227(2): p. 529-537.
10. Schlemper, J., et al. A deep cascade of convolutional neural networks for MR image reconstruction. in International Conference on Information Processing in Medical Imaging. 2017. Springer.
11. Bernal, J., et al., Deep convolutional neural networks for brain image analysis on magnetic resonance imaging: a review. Artificial intelligence in medicine, 2019. 95: p. 64-81.
12. Ronneberger, O., P. Fischer, and T. Brox. U-net: Convolutional networks for biomedical image segmentation. in International Conference on Medical image computing and computer-assisted intervention. 2015. Springer.
13. Madelin, G., et al., Compressed sensing sodium MRI of cartilage at 7T: preliminary study. Journal of magnetic resonance, 2012. 214: p. 360-365.
14. Blunck, Y., et al., Compressed sensing effects on quantitative analysis of undersampled human brain sodium MRI. Magnetic resonance in medicine, 2020. 83(3): p. 1025-1033.
Figures
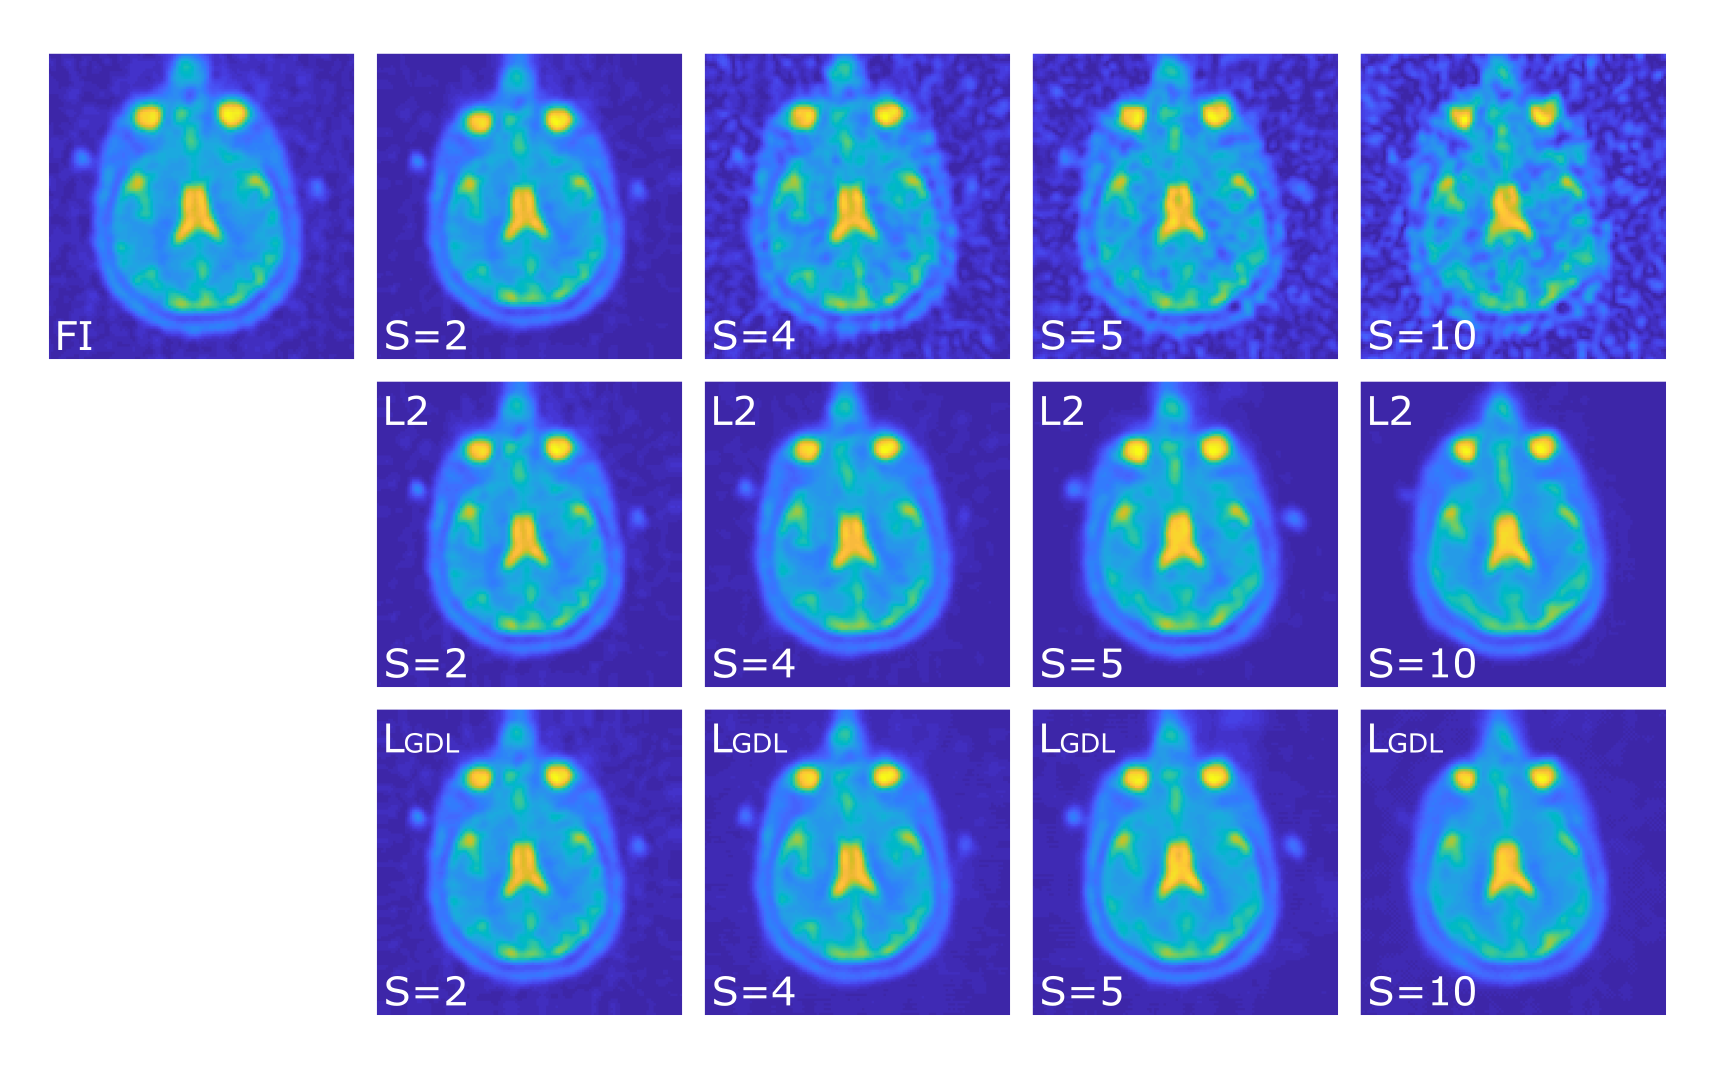
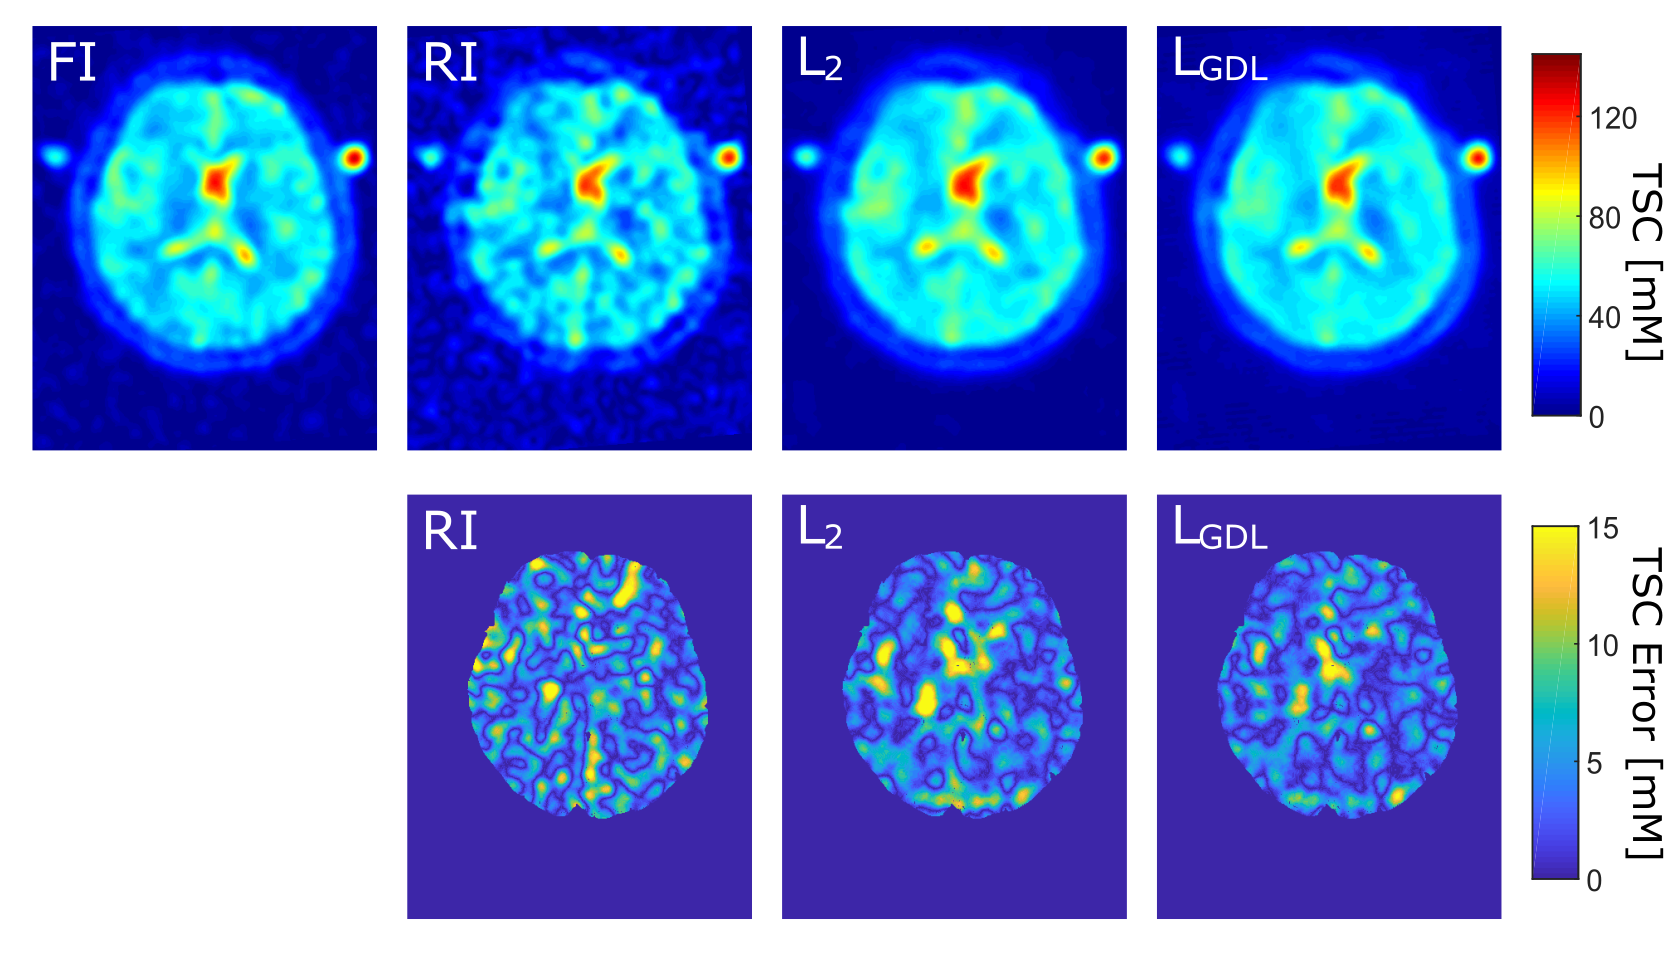
Figure 2: One representative image slice of one test case
Top: Quantified FI, RI (S = 5) and the CNN output image with L2 and LGDL. Bottom: Corresponding TSC error maps within the whole brain.