1787
Precision and Reliability of Metabolite Quantification of 31P MRS at 7T1Radiology, University of Iowa, Iowa City, IA, United States, 2GE Global Research, Munich, Germany, 3Psychiatry, University of Iowa, Iowa City, IA, United States, 4Biomedical Engineering, University of Iowa, Iowa City, IA, United States
Synopsis
The test-retest repeatability of ATP and PCr concentrations in the human brain was measured with a non-localized, quantitative 31P MRS protocol. The performance of several automated MRS quantification methods that require little or no human intervention were evaluated. We found that the peak integration by simple summation of the magnitude spectrum is the most sensitive and robust to detect small ATP concentration changes. The excellent test-retest repeatability enables ATP concentration to be studied instead of using them as internal reference. This is important in diseases such as those that impair mitochondrial function resulting in impaired oxidative phosphorylation.
Background
In-vivo 31P MRS provides quantitative information about key energy metabolites. Often quantitation of 31P metabolites is reported as metabolite ratios (e.g. PCr/ATP) because the determination of absolute concentrations is cumbersome. Alternatively, ATP concentrations can be taken as an internal reference standard with the assumption that ATP levels are well maintained within a narrow range (1,2). However, the accuracy, precision, and reproducibility of using ATP as an internal reference standard is still unknown. Furthermore, ATP levels may change in pathologies such as brain ischemia or stroke after PCr is consumed (3). In order to study the stability of ATP concentration in the brain, the 31P MRS acquisition and analysis protocol needs to be optimized to achieve a high degree of reliability.Methods
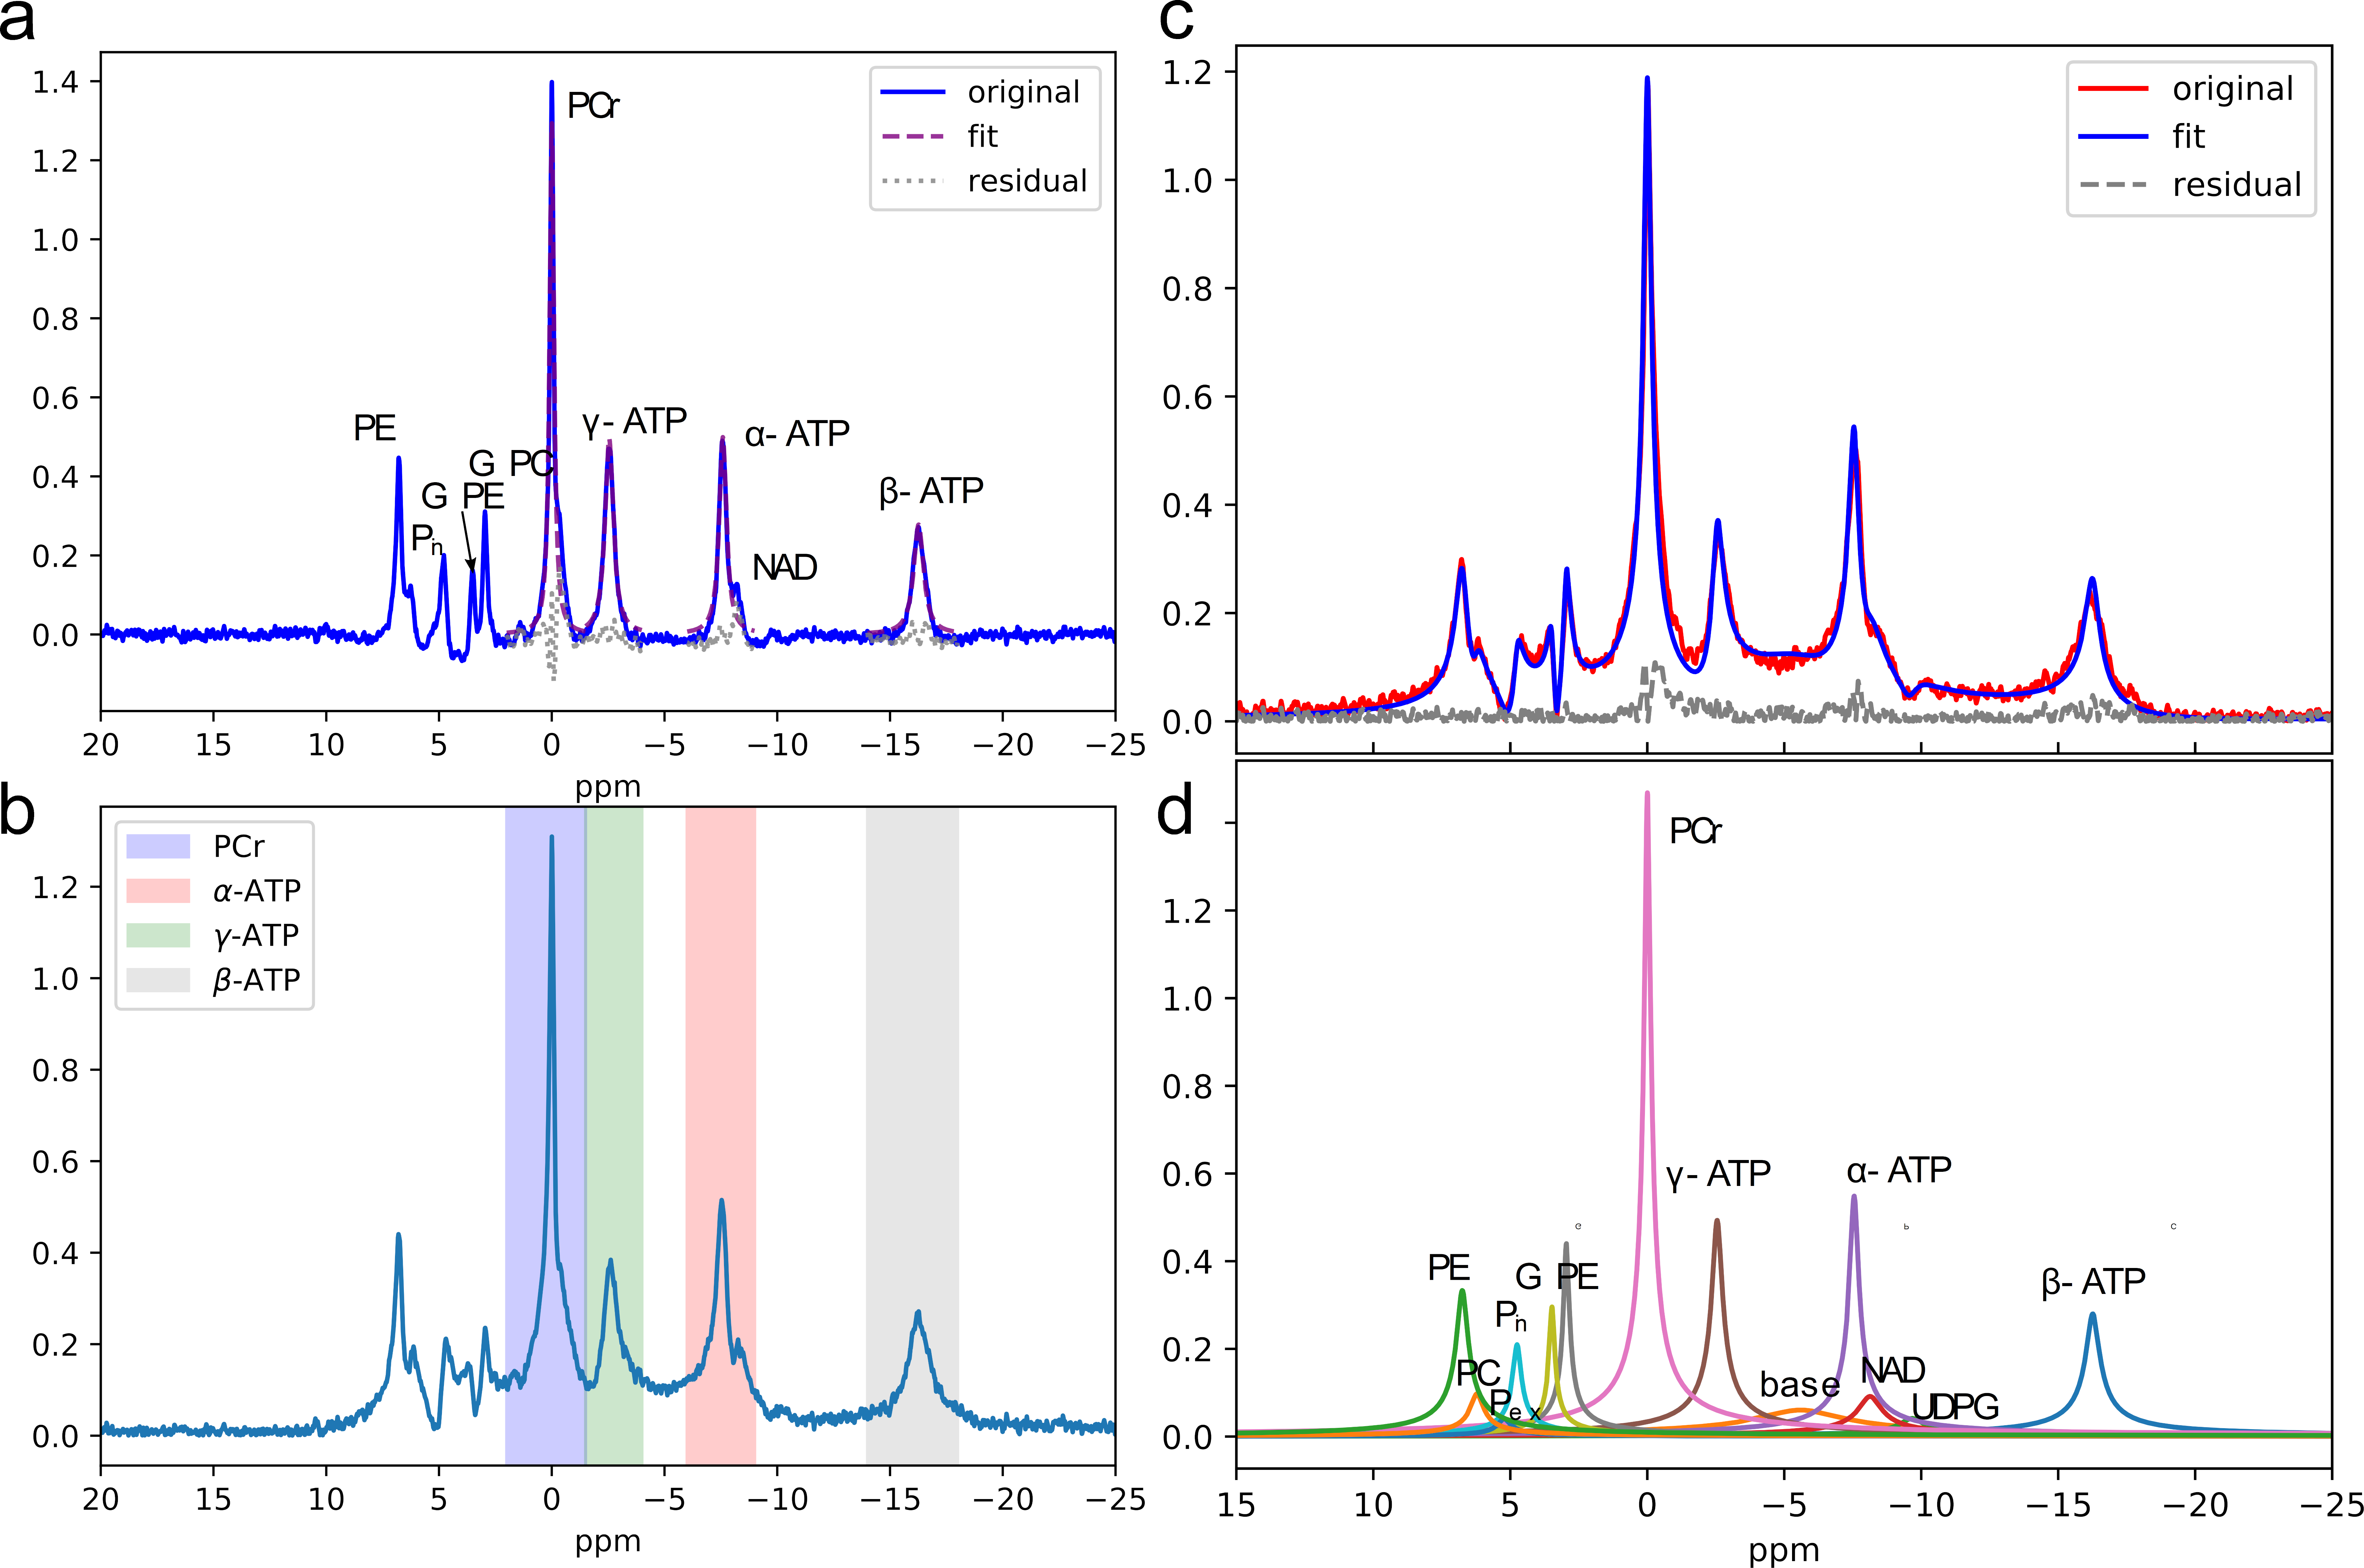
The 31P MR spectra are simulated using signal parameters of human brain at 7T as previously reported (4). A series of 6 different MR spectra were simulated with various α-, β-, and γ-ATP amplitudes ranging from 100%-105% of the original ATP concentrations and PCr amplitudes ranging from 100%-95% of the original PCr concentration to construct different high-energy phosphate (ATP, PCr) metabolite concentration gradients. Gaussian white noise was added resulting in three SNR ratios (high≈76, medium≈32, and low≈14). To simulate in-vivo spectra with long dead-time, the first 8 points were omitted from the FID. The uncertainties of quantification methods were estimated by Monte Carlo (MC) simulations with 200 trials at each SNR level. 7 healthy subjects were scanned three separate times on the same day to check repeatability. Prior to the first scan, high-order B0 shimming was performed and the shimming current parameters were saved and used in the 2nd and 3rd scans. For each scan, the center frequency was set to the PCr peak and transmitter-gain (TG) was carefully adjusted using the Bloch-Siegert shift (5). Quantitative nonlocalized 31P MR spectra were acquired using a free induction decay (FID) sequence with a 152 μs hard excitation pulse and 20⁰ flip angle. Other acquisition parameters were: number of points=2048, repetition time=2s, number of scans=128, spectral width=10000 Hz. The MRS spectra were quantified by HSVD, AMARES(6), conventional peak integration, lineshape fitting, and peak integration of magnitude spectra, respectively (Fig. 1).Results
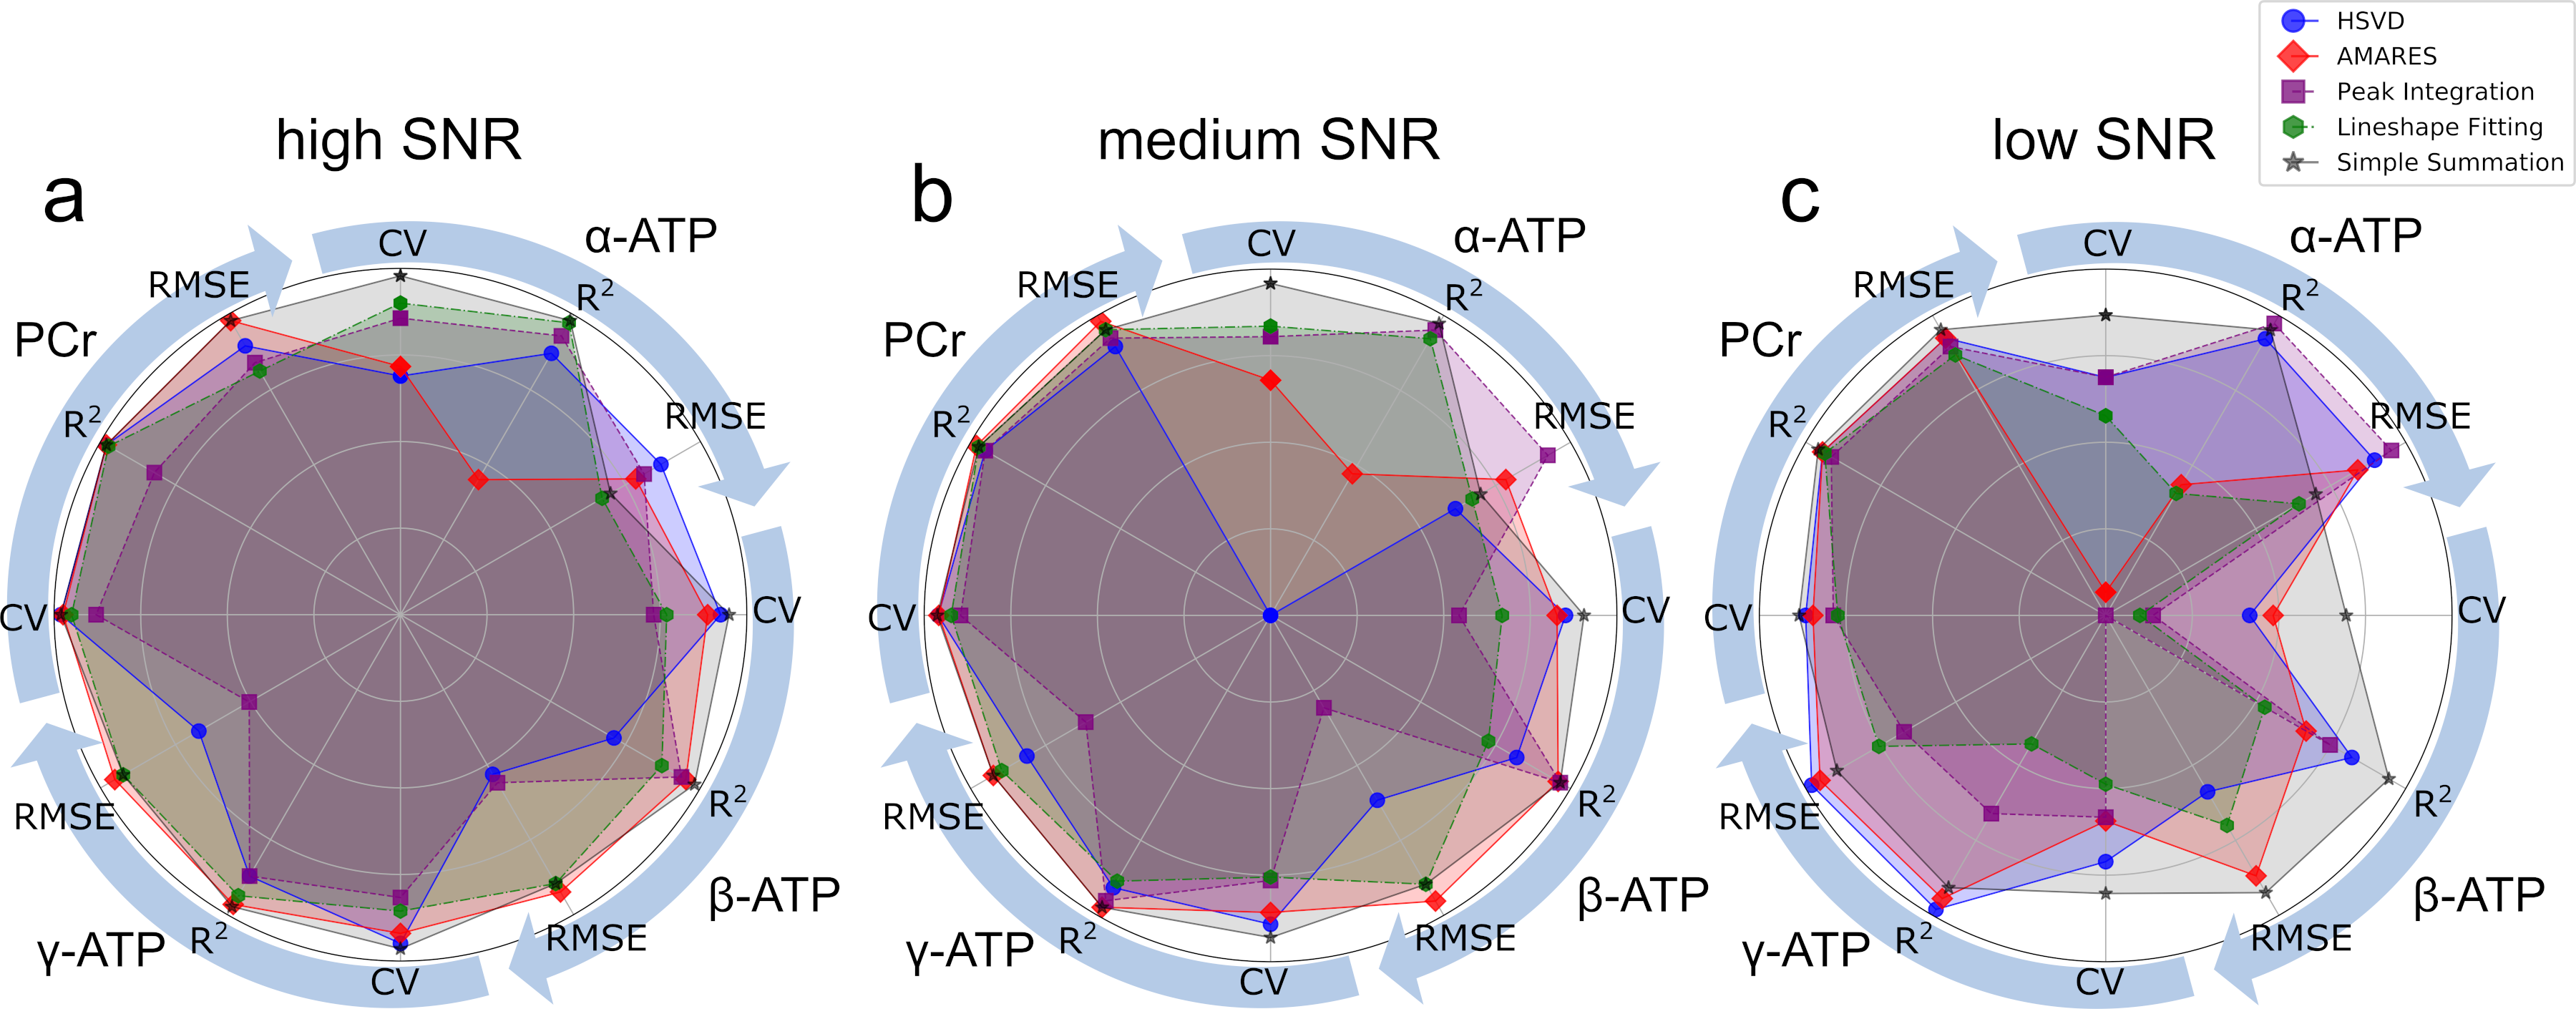
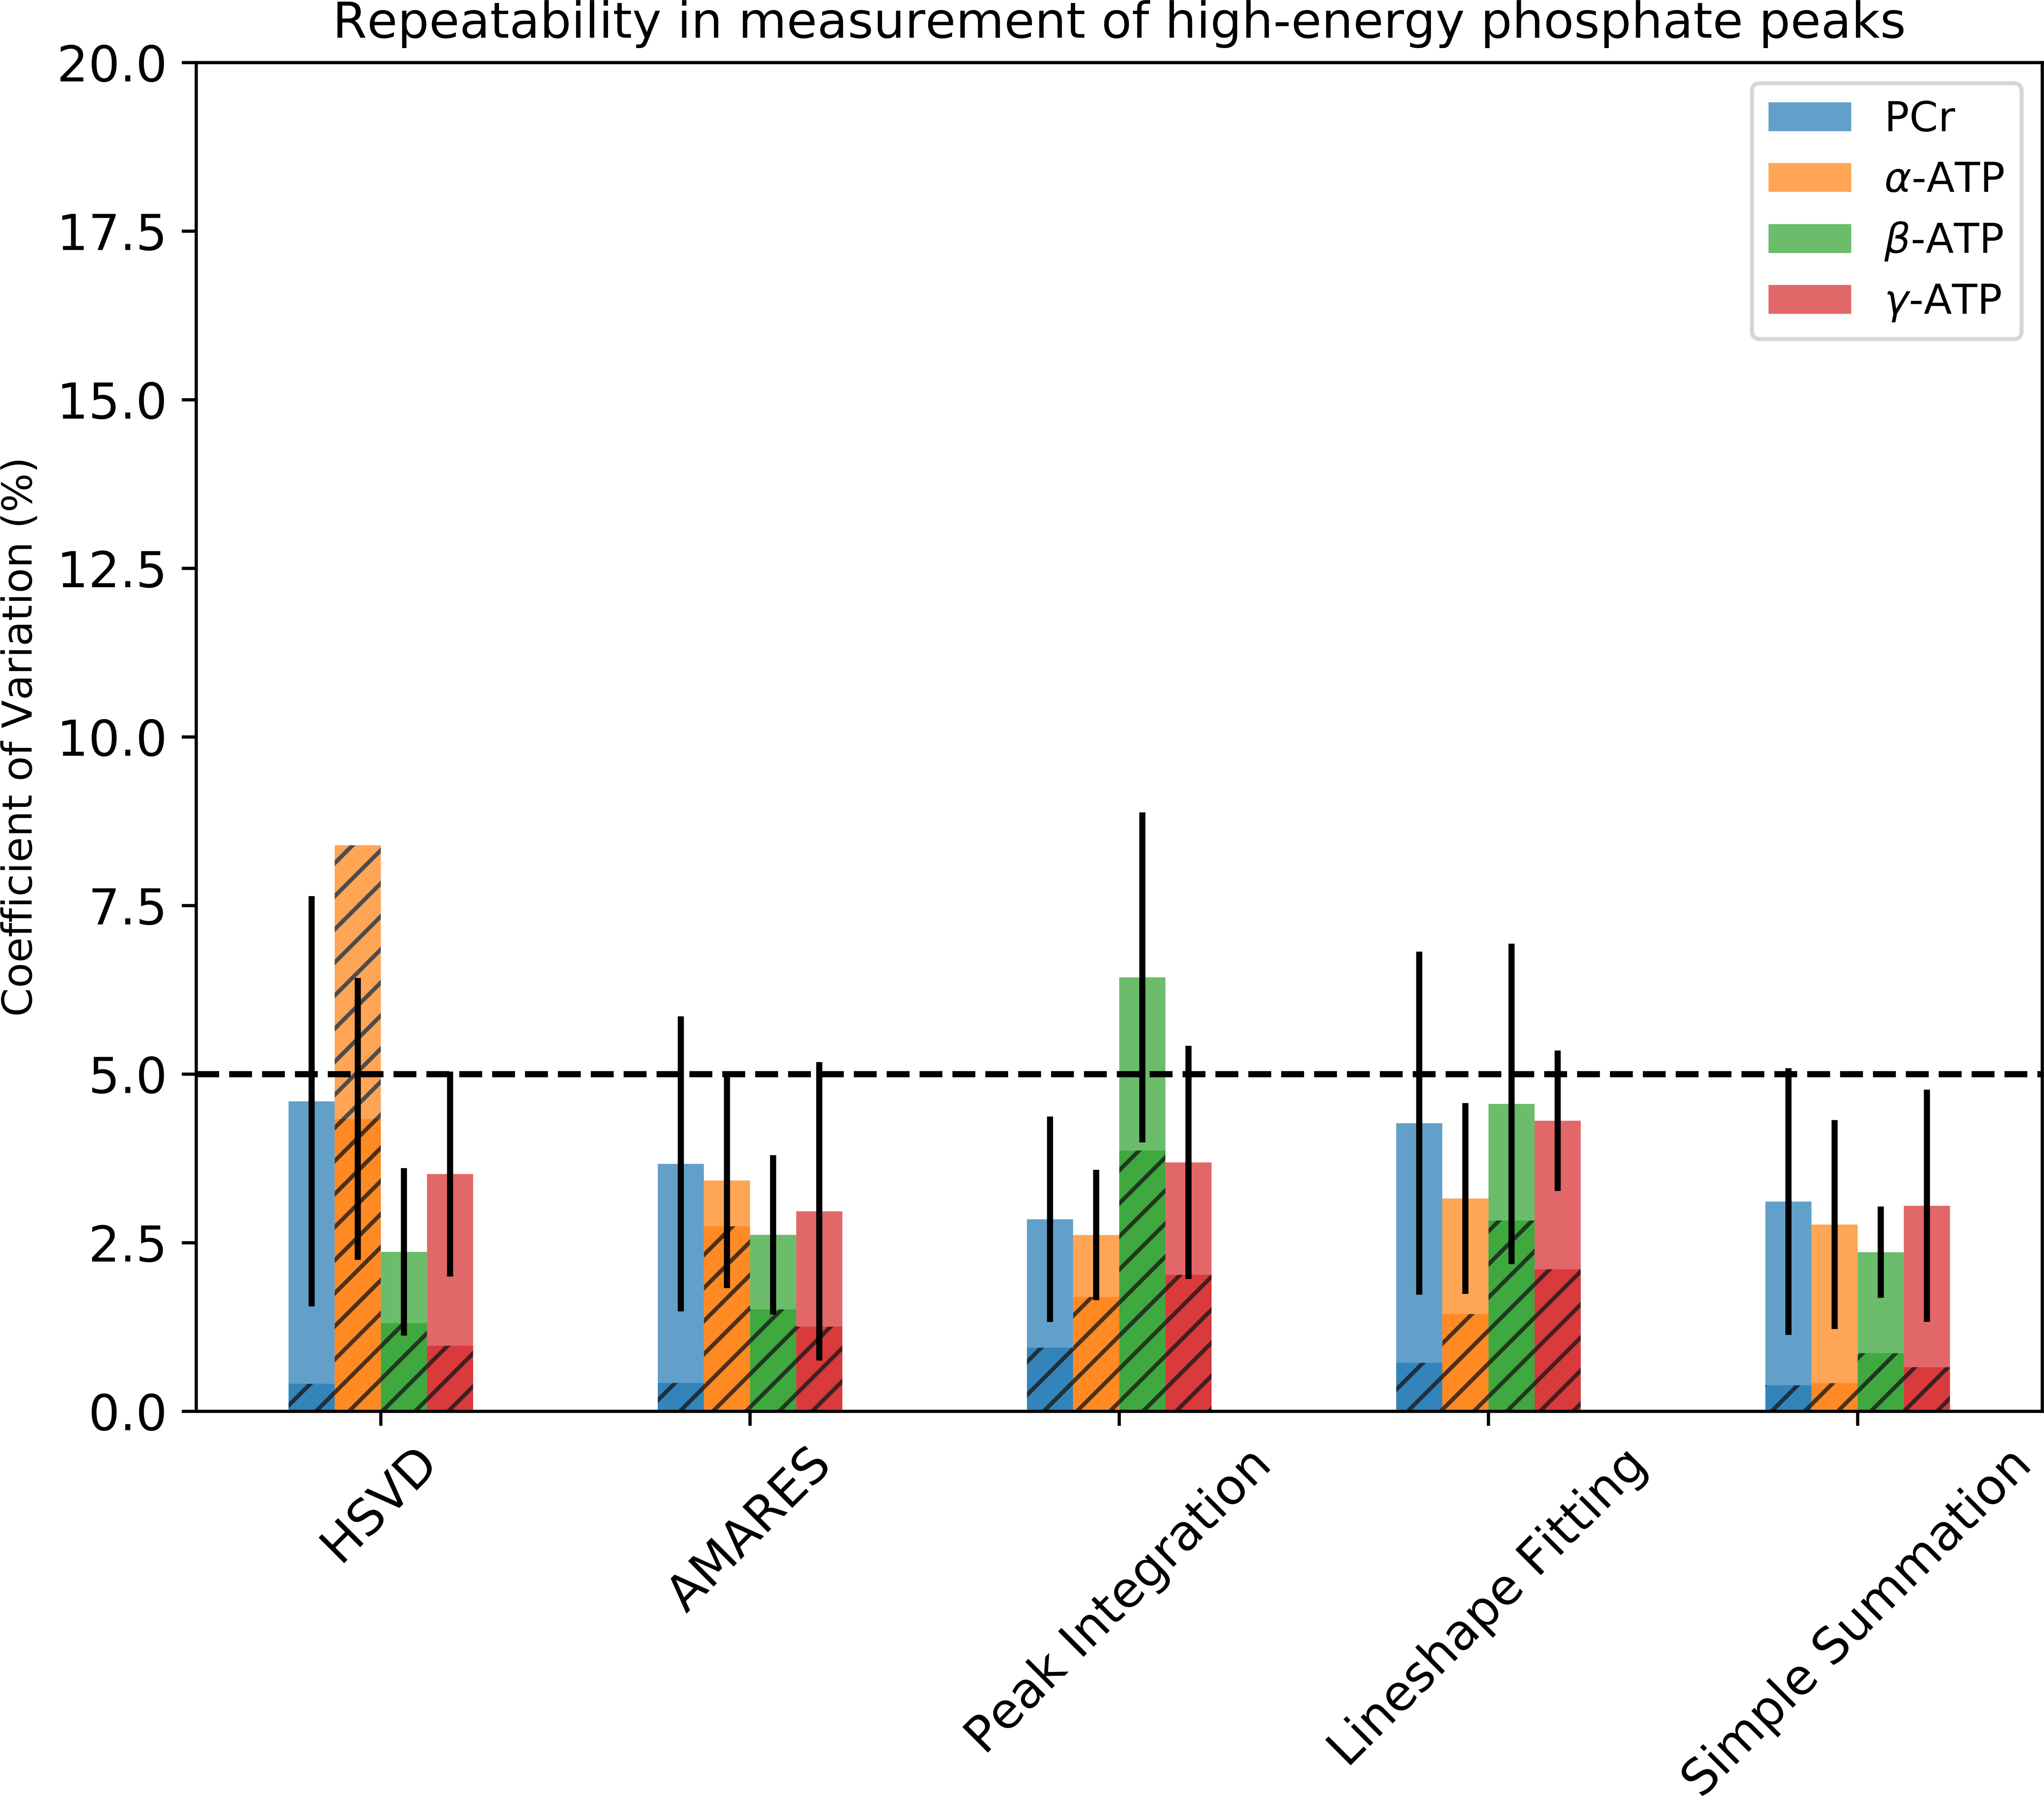
To assess the ability of the quantification methods to distinguish subtle amplitude changes in ATP and PCr peaks the simulated spectra were quantified. The obtained peak amplitudes were compared to the known concentration to calculate linearity (R2), which measures the ability to capture the changes, and root-mean-square error (RMSE), which measures the trueness. The overall performance of all 5 quantification methods was plotted on the same radar plot (Fig 2). The area filled by each method in Fig. 2 suggests that both simple summation and AMARES perform well in quantification of all peaks, and their performance are relatively insensitive to the SNR levels evaluated. Fig. 3 shows that the CVs are significantly smaller in the simulated data, suggesting that additional variance in the data was present in the in-vivo data, which as not included in the simulation. Excluding the conventional peak integration and lineshape fitting methods, the CVs of β-ATP (~2.5%) were the lowest among all peaks, suggesting that it is the most reliable ATP peak and should be used as an internal reference when computing ratios.Discussion
Our simulation suggests that in terms of uncertainty, trueness, and linearity, AMARES and simple summation are the preferred methods to quantify the concentration change of high energy metabolites in 31P MRS data with high sensitivity and accuracy. The in-vivo data confirmed that the error in estimating peak area using simple summation was less than 5%. AMARES was almost as reproducible as simple summation (Fig. 3). The peak integration usually uses the absorptive lineshape. However, in this work, we found that frequency-domain quantification methods show bigger CVs as compared to the other strategies evaluated. The magnitude spectra are usually less preferred because of the much-broader peaks. However, in the 31P MRS spectrum this is not a big concern due to the larger spectral separation of the peaks. Furthermore, the magnitude spectrum has previously been shown to have superior reproducibility (7), and machine learning approaches to analysis of the MRS spectra have also shown better performance using the magnitude spectra (8,9). Our study suggested that if the boundaries of peaks of interest are properly defined and aligned, the trueness of ATP and PCr quantification of simple summation are still very good even at low SNR.Summary
We found that the peak integration by simple summation of magnitude spectra is the easiest and most sensitive method to track small ATP concentration changes. It is also robust to the baseline distortion caused by long deadtime. Despite the challenges of 7T including B0 inhomogeneity, we were able to measure in-vivo ATP concentration with high precision. This will allow us to track the change of ATP concentration, which is usually assumed to be constant and used as an internal reference.Acknowledgements
We thank Dr. Baolian Yang and Dr. Cam Cushing for critically reading the manuscript. We also thank Marla Kleingartner, Kori Rich, and Autumn Craig for their assistance in recruiting and scanning subjects. The authors declare no conflict of interest.
This research was sponsored in part by the Carver Foundation, the Michael J Fox Foundation, and NIH (R01MH111578). This work was conducted on an MRI instrument funded by S10RR028821.
References
- Du F, Yuksel C, Chouinard VA, et al. Abnormalities in High-Energy Phosphate Metabolism in First-Episode Bipolar Disorder Measured Using (31)P-Magnetic Resonance Spectroscopy. Biol Psychiatry 2018;84(11):797-802.
- Zhu X-H, Zhang Y, Chen W. Absolute Quantification of ATP and Other High Energy Phosphate Compounds in Cat Brain at 9.4T. Proc Intl Soc Mag Reson Med 2009;17.
- Graaf RAd. Spectral Quantification. In Vivo NMR Spectroscopy: John Wiley & Sons Ltd.; 2019. p. 439-471.
- Ren J, Sherry AD, Malloy CR. (31)P-MRS of healthy human brain: ATP synthesis, metabolite concentrations, pH, and T1 relaxation times. NMR Biomed 2015;28(11):1455-1462.
- Schulte RF, Sacolick L, Deppe MH, et al. Transmit gain calibration for nonproton MR using the Bloch-Siegert shift. NMR Biomed 2011;24(9):1068-1072.
- Purvis LAB, Clarke WT, Biasiolli L, Valkovic L, Robson MD, Rodgers CT. OXSA: An open-source magnetic resonance spectroscopy analysis toolbox in MATLAB. PLoS One 2017;12(9):e0185356.
- de B. Harrington P, Wang X. Spectral Representation of Proton NMR Spectroscopy for the Pattern Recognition of Complex Materials. Journal of Analysis and Testing 2017;1(2):10.
- Hiltunen Y, Kaartinen J, Pulkkinen J, Hakkinen AM, Lundbom N, Kauppinen RA. Quantification of human brain metabolites from in vivo 1H NMR magnitude spectra using automated artificial neural network analysis. J Magn Reson 2002;154(1):1-5.
- Chandler M, Jenkins C, Shermer SM, Langbein FC. MRSNet: Metabolite Quantification from Edited Magnetic Resonance Spectra With Convolutional Neural Networks. 2019. p. arXiv:1909.03836.
Figures