1786
Monitoring liver glucose uptake and metabolism with dynamic 3D deuterium metabolic imaging at 7T1Department of Radiology, University Medical Center Utrecht, Utrecht, Netherlands
Synopsis
Deuterium metabolic imaging (DMI) is an emerging method to assess metabolism in vivo. In this study, we applied dynamic 3D DMI with oral administration of deuterated glucose to investigate the dynamics of hepatic glucose uptake and metabolism at 7T. After glucose intake, the signal from deuterated glucose logarithmically increased in the liver and plateaued around 100 min, after which it decreased again, as a result of its conversion through glycolysis, oxidative metabolism and, probably the largest part, glycogen synthesis. DMI will be a valuable tool to study disturbances of liver metabolism in metabolic diseases.
Introduction
In type 2 diabetes, hepatic glucose metabolism is dysregulated, resulting in impaired glycogen synthesis. 13C MRS has been used to measure the rate of hepatic glycogen synthesis upon infusion of 13C-labeled glucose1,2. However, because of the low intrinsic sensitivity of 13C MRS and the long T1 relaxation times, 3D mapping of 13C-labeled metabolites using MRS imaging (MRSI) is not feasible. Deuterium metabolic imaging (DMI) is a new technique to study metabolism in vivo, which relies on MRSI combined with the administration of deuterated compounds, such as deuterated glucose3. Last year we demonstrated that using a dedicated 4-channel body array, the naturally abundant deuterated water signal could be detected in the liver with DMI at 7T. In this study, we applied dynamic 3D DMI with oral administration of deuterated glucose to investigate the dynamics of hepatic glucose uptake and metabolism.Methods
DMI measurements were performed at a 7T whole-body MRI system (Philips Healthcare, Best, Netherlands), using a 4-channel body array consisting of 4 2H transmit/receive loop coils combined with 4 1H transmit/receive dipole antennas. Before the DMI experiments, conventional MRI was performed to optimize the B0 field and to make anatomical reference images for DMI planning. Coronal and axial T1w, and axial Dixon images were acquired with the same field of view as for the DMI measurements, which, together with the preparation steps, took approximately 30min. All DMI measurements were performed with a pulse-acquire sequence using a 1ms block pulse, followed by phase encoding gradients for 3D spatial encoding, an effective echo time of 1.95ms and repetition time of 333ms. DMI acquisitions were made using Hamming-weighted k-space acquisition patterns with 4 averages and without respiratory gating.One healthy volunteer was scanned twice, about 3 months apart, after an overnight fast. [6,6’-2H2]glucose (0.75g per kg body weight) was dissolved in ~300ml water and administered orally. During the first session, the deuterated glucose was administered while the volunteer was in the scanner, after two baseline DMI scans, and DMI scans were then continued up to 130min after glucose intake. DMI parameters: voxel size 30x30x30mm3, matrix size 8(AP)x10(LR)x9(FH), temporal resolution 5:08min. During the second session, the deuterated glucose was administered 30min before the volunteer went into the scanner. The first DMI experiment was acquired 68min after glucose intake and scans were continued up to 205min after intake. DMI parameters: voxel size 25x25x25mm3, matrix size 10(AP)x12(LR)x12(FH), temporal resolution 10:35min.
Reconstruction and processing of the raw DMI data was performed with an in-house written MATLAB script (MathWorks, Natick, MA, USA). Channel combination was performed using the Roemer equal noise algorithm4. For each voxel, water (4.7ppm), glucose (3.8ppm) and lipid (1.3ppm) signals were fitted using AMARES5. For visual purposes, 5-Hz exponential apodization and zero-filling to 2048 points was applied in the spectral domain. Glucose maps were created using the amplitude of the fitted glucose signals with 2D interpolation and Gaussian smoothing.
Results
Results from the first scan, during which deuterated glucose was administered while the volunteer was in the scanner, are shown in Figures 1 and 2. Immediately after intake of the deuterated glucose, a very strong glucose signal was observed in the stomach (Fig. 1D+2) and, to a lower extent, in the anterior part of the liver (superior to lower part of the stomach; Fig. 1B+2B), which rapidly decayed over time. In the liver, the deuterated glucose signal then increased over time (Fig. 1B/C+2), following more or less a logarithmic curve.Results from the second scan, during which deuterated glucose was administered 30 min before the volunteer went into the scanner, are shown in Figures 3 and 4. In all voxels, the signal from deuterated glucose was highest in the first experiment, 68 min after intake, and gradually decayed thereafter (Fig. 3+4).
In Figure 5, fitted water and glucose peak amplitudes from the voxel in the posterior part of the liver are combined for both scan sessions. The deuterated water signal gradually increased over time, while the deuterated glucose signal increased up to about 100 min after intake and then decreased again.
Discussion and Conclusion
We showed the application of 3D DMI for dynamic and spatially-resolved monitoring of deuterated glucose uptake and metabolism throughout the human body. In the liver, the signal at 3.8 ppm increased and plateaued around 100 min after intake of deuterated glucose, after which it decreased again. This signal most likely originates solely from deuterated glucose, as it was shown that detection of deuterated glycogen is likely not feasible in vivo6. The dynamics therefore represent the hepatocellular uptake of glucose and its conversion through glycolysis, oxidative metabolism and, probably the largest part, glycogen synthesis. The small but gradual increase in deuterated water signal up to the latest time point at 205 min is likely caused by oxidative metabolism of deuterated glucose and glycogen (after it is broken down to glucose again). However, we did not observe any signals from deuterated glutamate and glutamine in the liver. When the DMI method is applied in patients with type 2 diabetes patients, it will advance our understanding of the disturbances in liver metabolism in diabetes, at a detail which cannot be achieved by any other technique.Acknowledgements
This work was funded by a HTSM grant from NWO TTW (project number 17134) and by a FET Innovation Launchpad grant from the EU (grant number 850488).References
1. Petersen KF, Laurent D, Rothman DL, Cline GW, Shulman GI. Mechanism by which glucose and insulin inhibit net hepatic glycogenolysis in humans. J Clin Invest. 1998;101(6):1203-1209. doi:10.1172/JCI579
2. Roden M, Petersen KF, Shulman GI, Falk Petersen K, Shulman GI. Nuclear magnetic resonance studies of hepatic glucose metabolism in humans. Recent Prog Horm Res. 2001;56:219-237.
3. De Feyter HM, Behar KL, Corbin ZA, Fulbright RK, Brown PB, McIntyre S, Nixon TW, Rothman DL, De Graaf RD. Deuterium metabolic imaging (DMI) for MRI-based 3D mapping of metabolism in vivo. Sci Adv. 2018;4(8):1-12. doi:10.1126/sciadv.aat7314
4. Roemer PB, Edelstein WA, Hayes CE, Souza SP, Mueller OM. The NMR phased array. Magn Reson Med. 1990;16(2):192-225. doi:10.1002/mrm.1910160203
5. Vanhamme L, Van Den Boogaart A, Van Huffel S. Improved Method for Accurate and Efficient Quantification of MRS Data with Use of Prior Knowledge. J Magn Reson. 1997;129(1):35-43. doi:10.1006/jmre.1997.1244
6. De Feyter HM, Thomas MA, Behar KL, De Graaf RA . Visibility of deuterium-labeled liver glycogen in vivo. Proc. Intl. Soc. Mag. Reson. Med.; 2020:324.
Figures
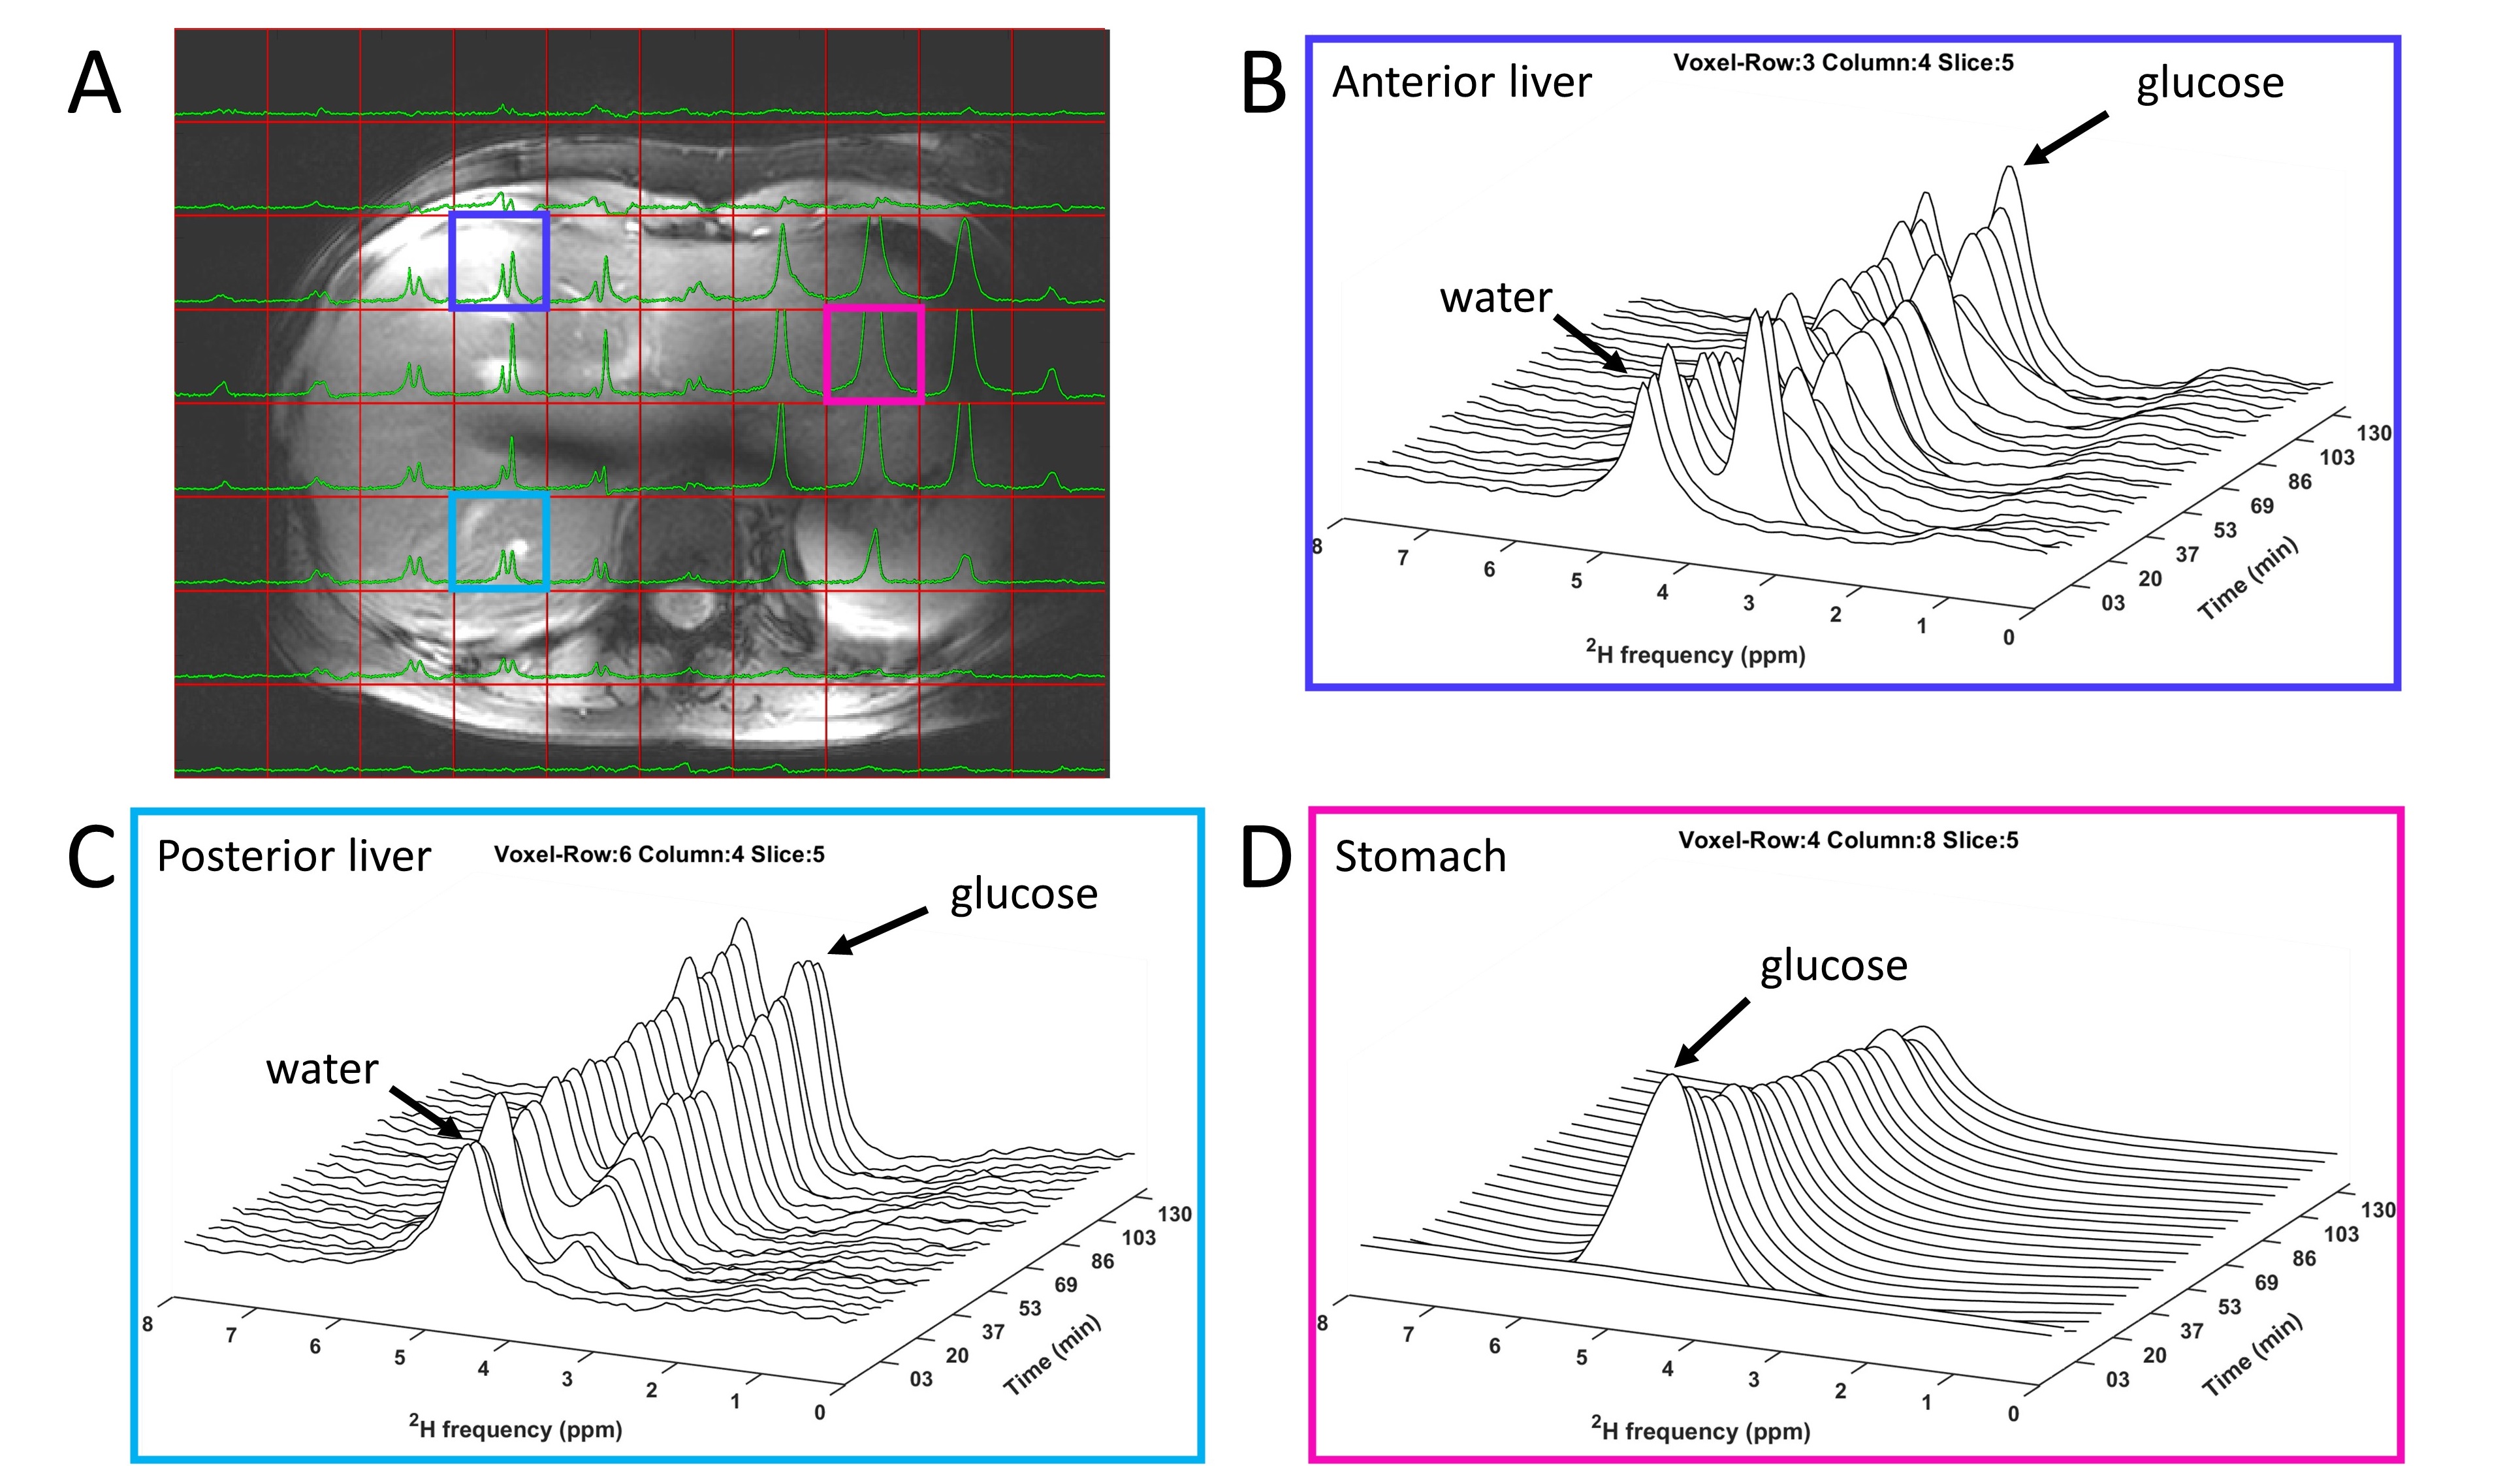
Figure 1. 3D DMI measurements at baseline and 0-130 min after oral administration of [6,6’-2H2]glucose (scan 1). (A) Overlay of last DMI data set (130 min) on transversal Dixon water image, with equal scaling of all spectra. (B-D) DMI spectra at baseline and up to 130 min after intake of deuterated glucose from voxels in the anterior (B) and posterior (C) side of the liver and the stomach (D).
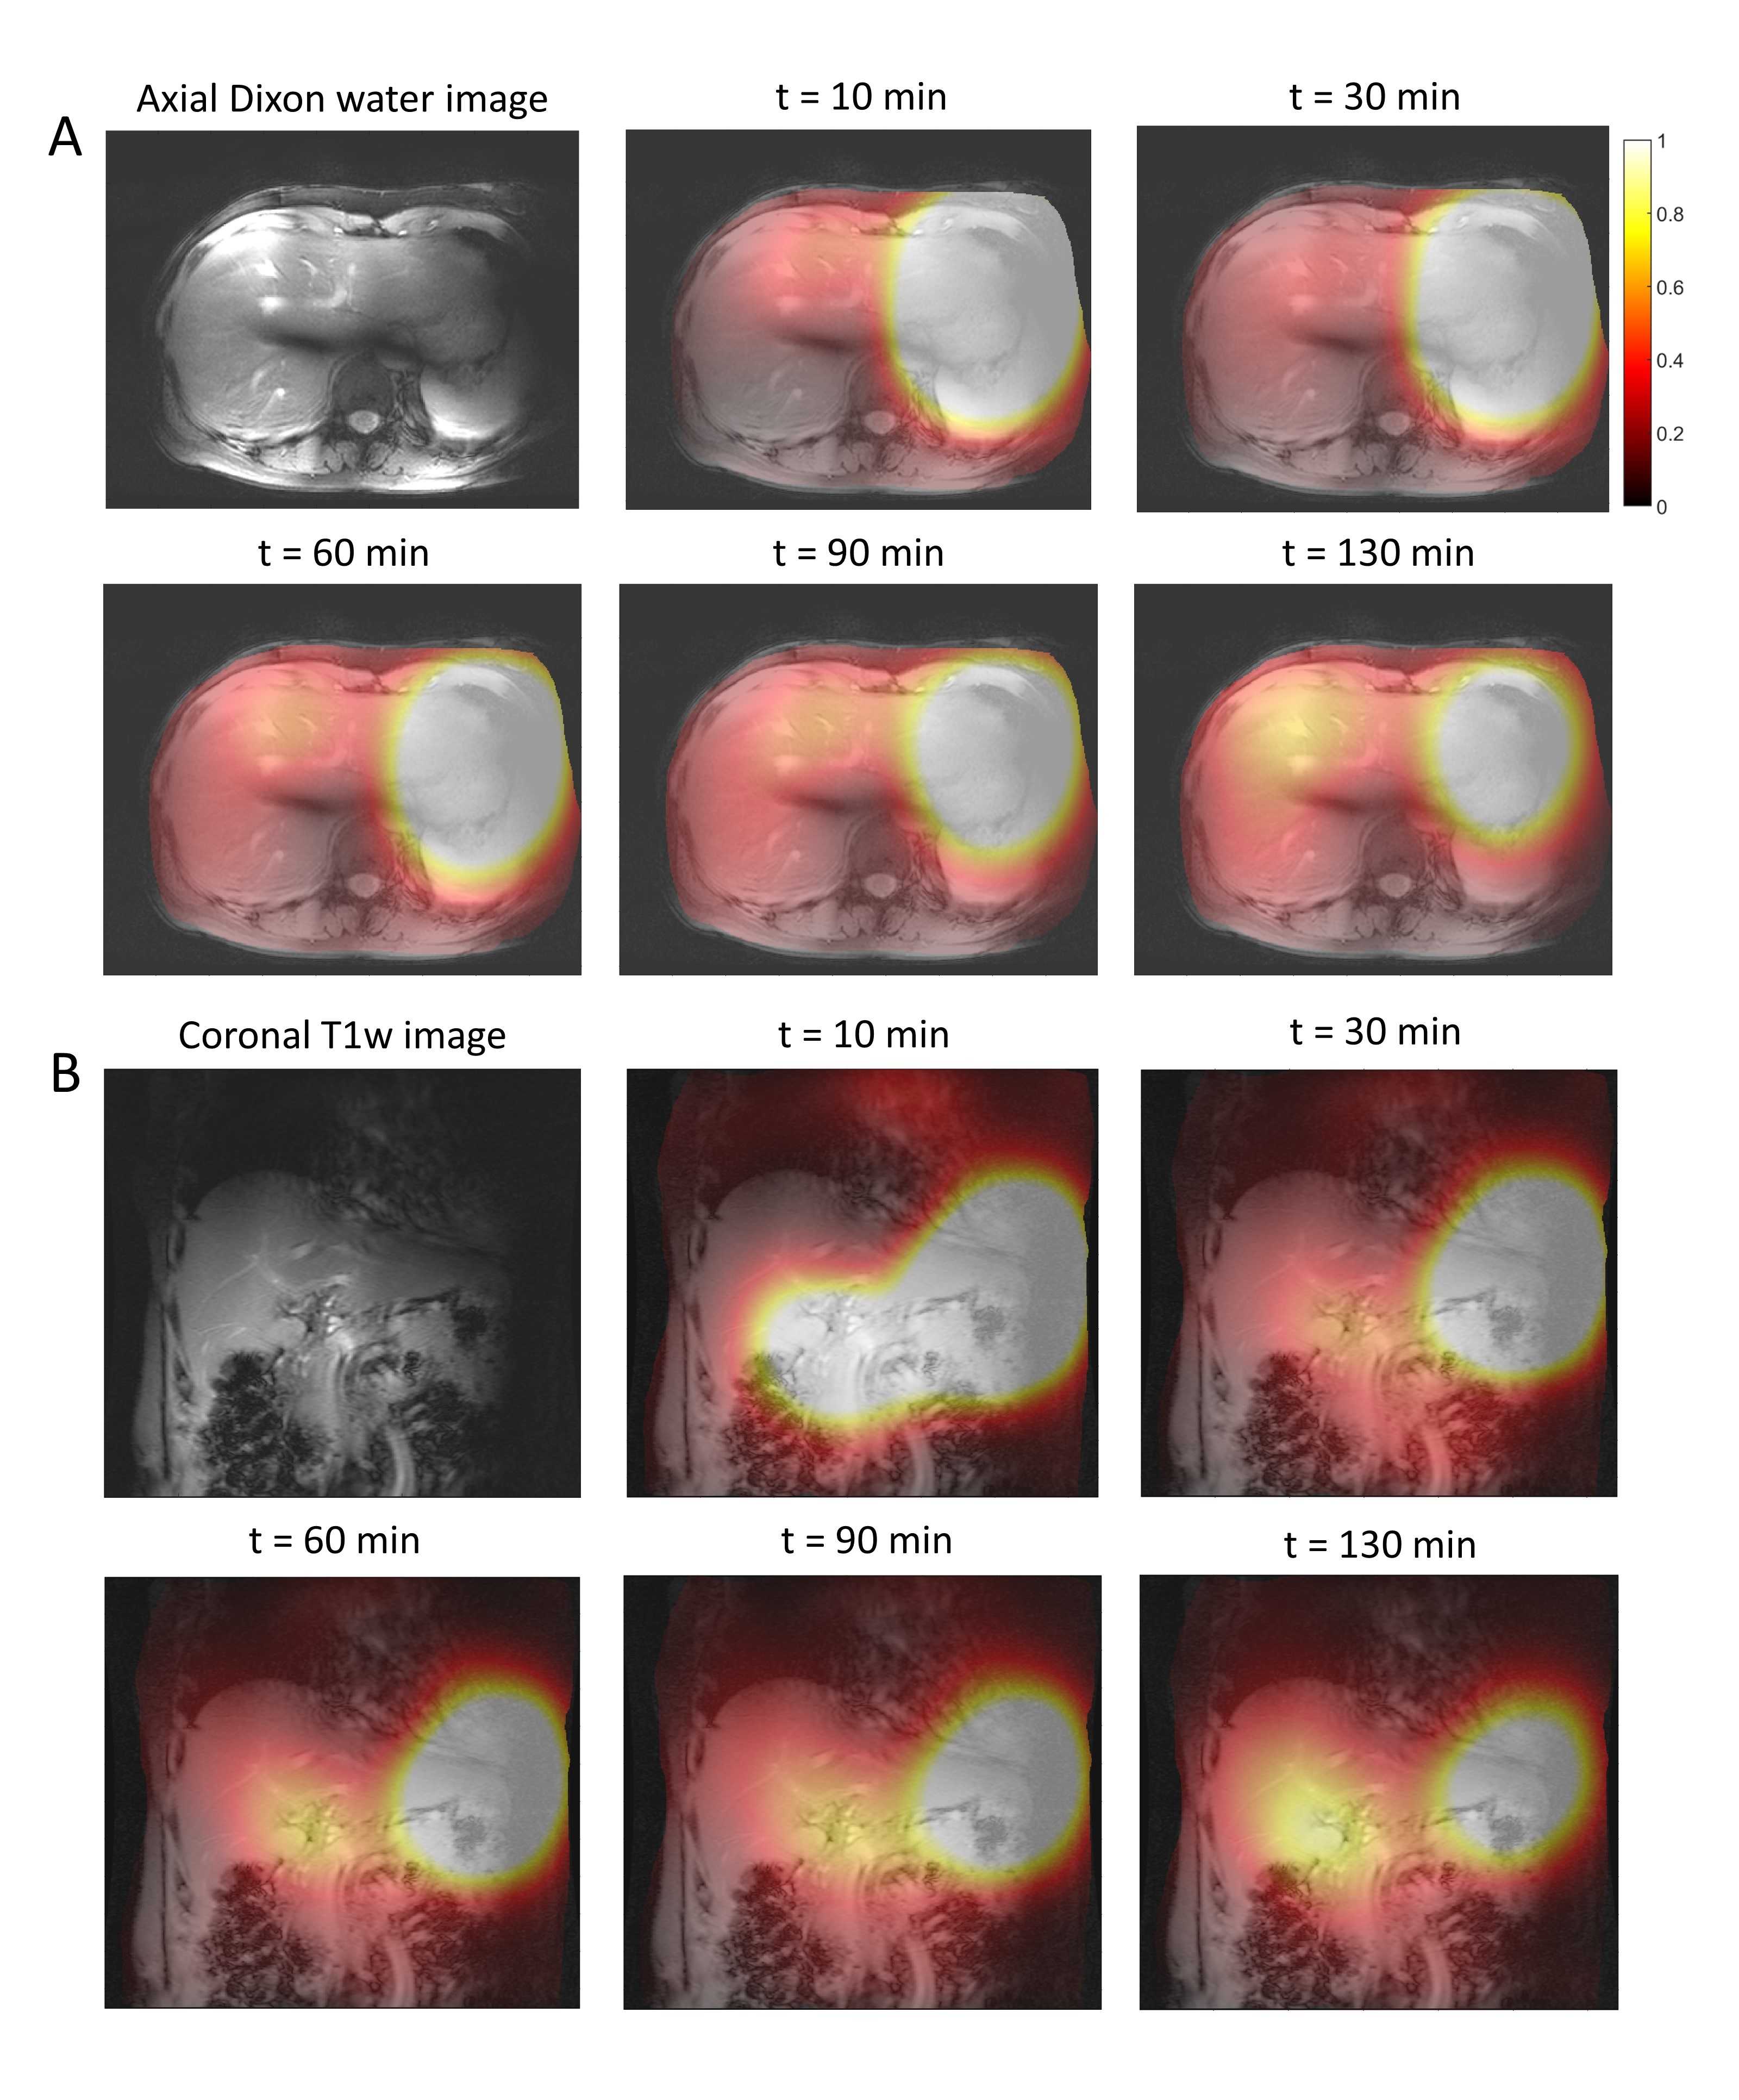
Figure 2. Axial (A) and coronal (B) color maps of fitted deuterated glucose signal amplitudes (in AU) from 5 selected 3D DMI measurements between 0 and 130 min after oral administration of [6,6’-2H2]glucose (scan 1). Signal amplitudes larger than 1 are represented in white. The color maps are overlaid on the anatomical axial Dixon and coronal T1w images.
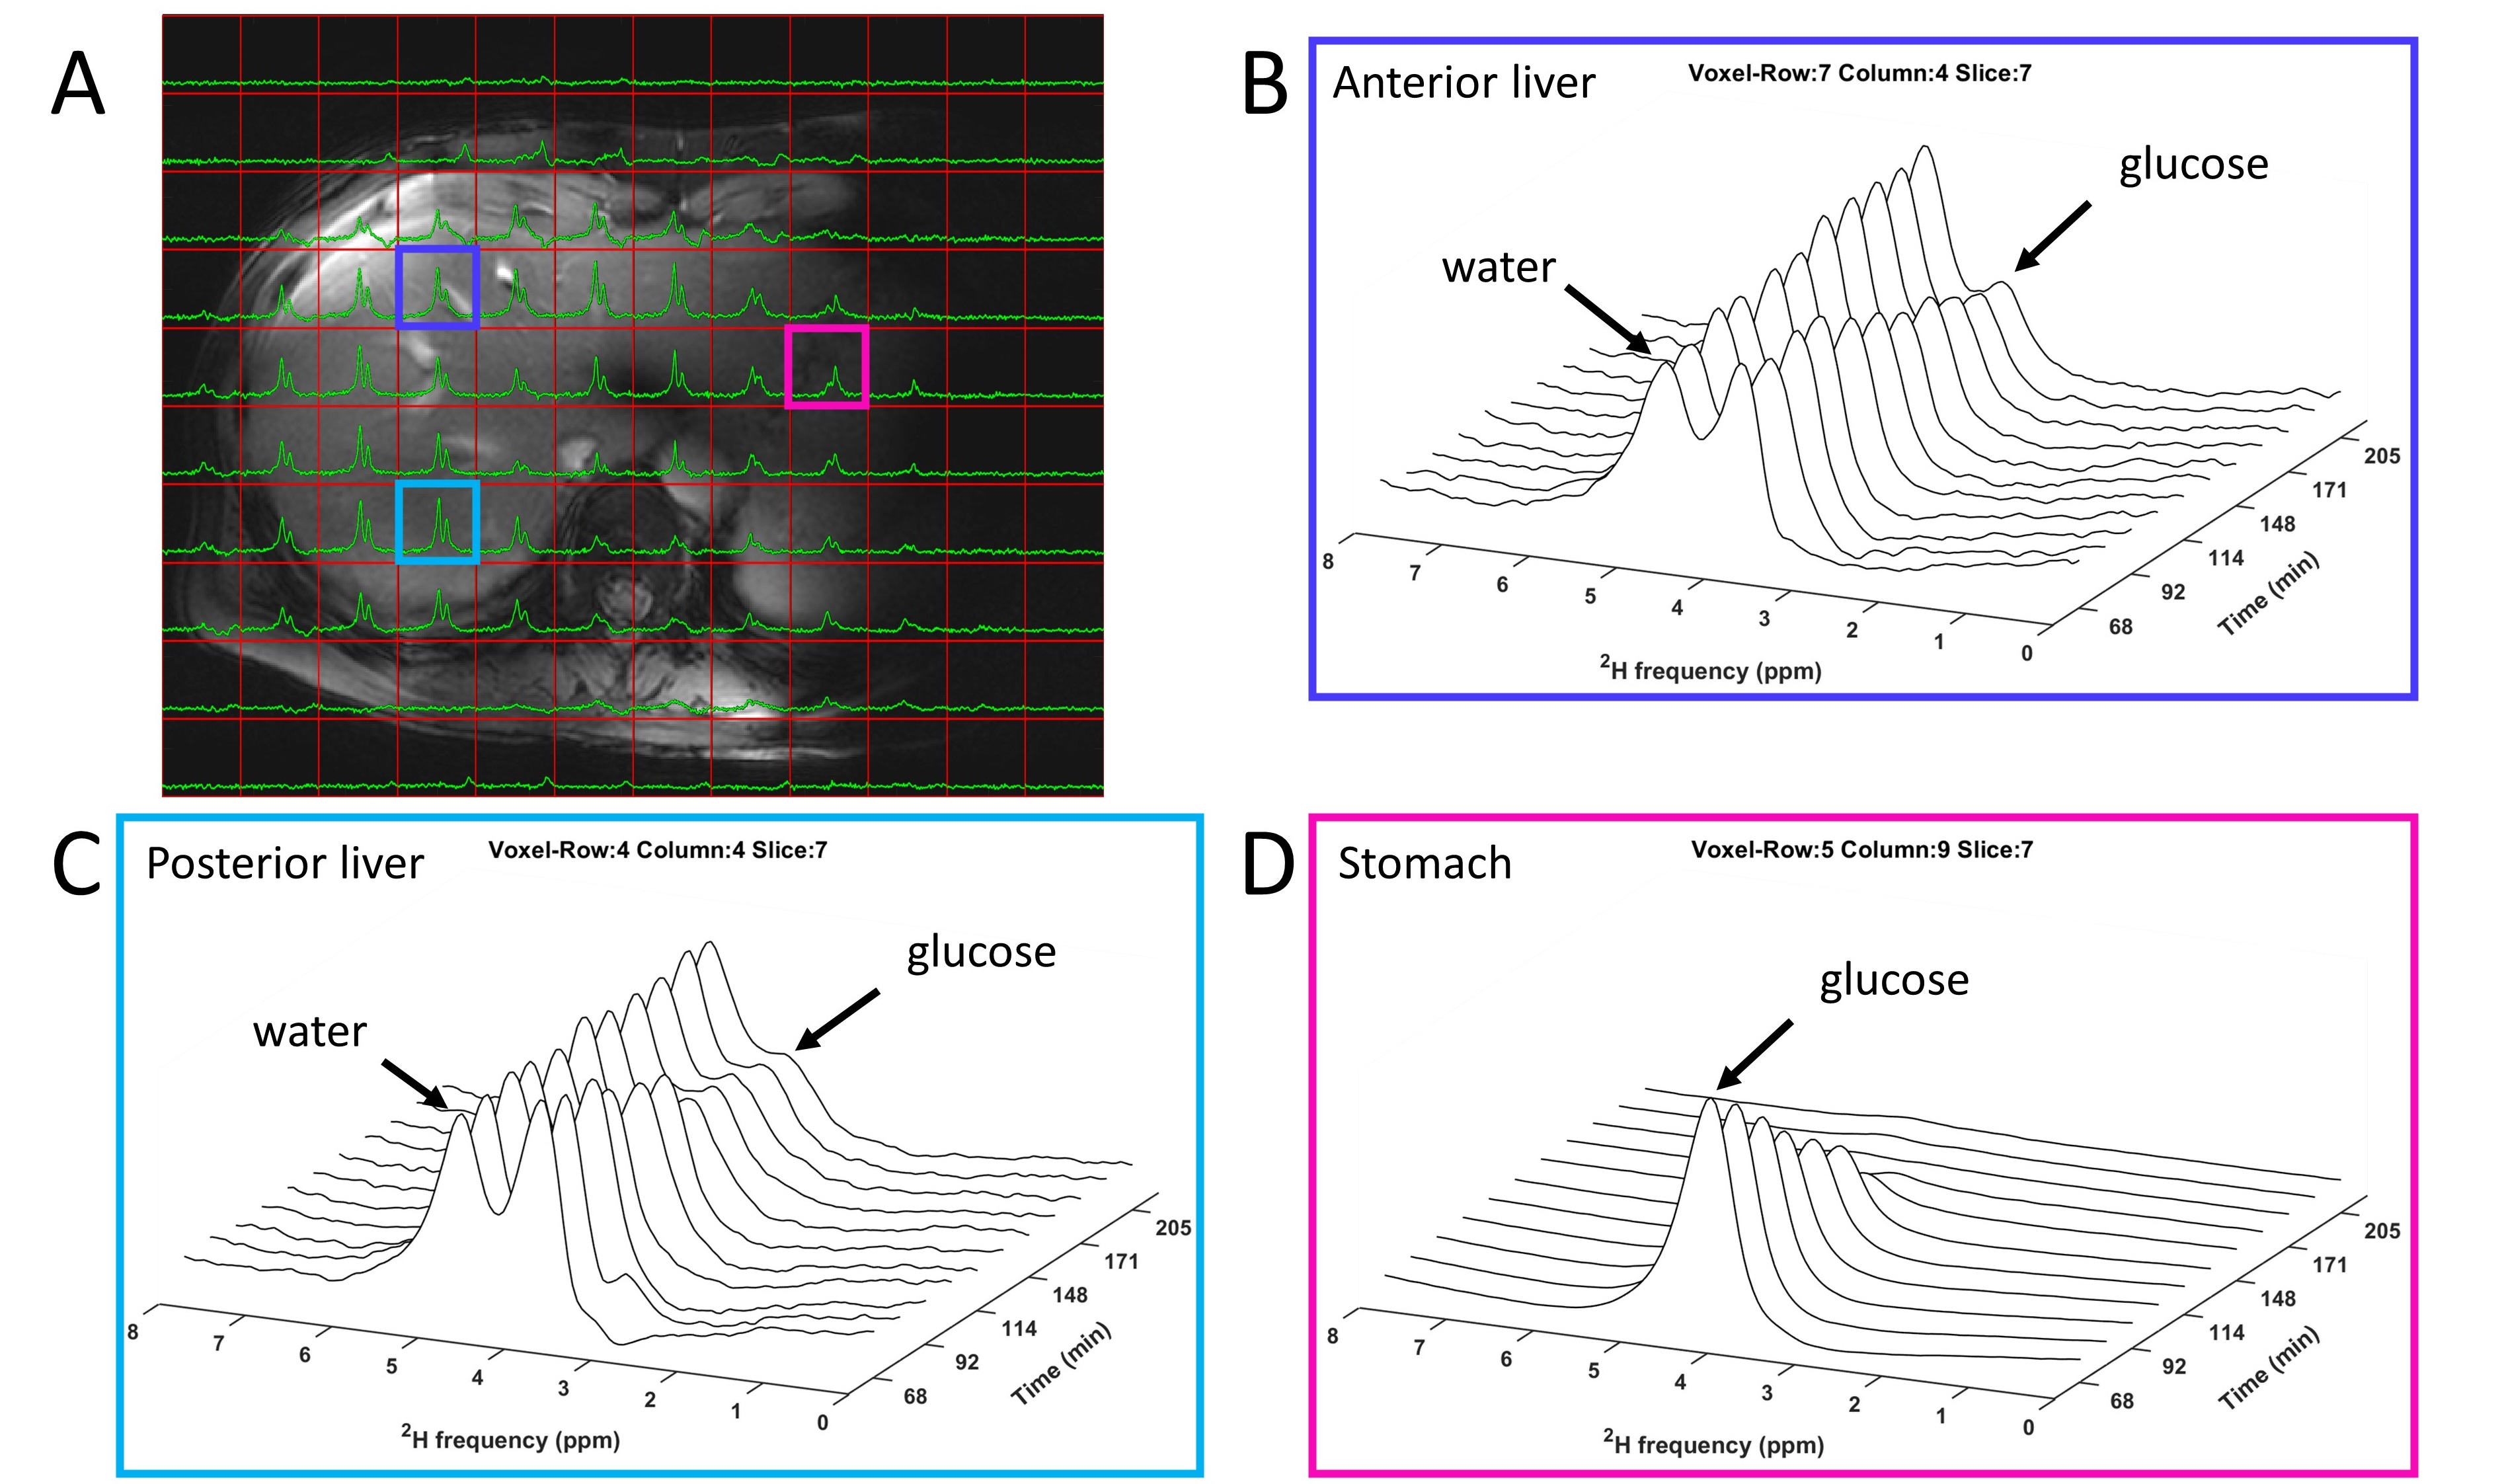
Figure 3. 3D DMI measurements 68-205 min after oral administration of [6,6’-2H2]glucose (scan 2). (A) Overlay of a DMI data set (160 min after intake) on transversal Dixon water image, with equal scaling of all spectra. (B-D) DMI spectra recorded from 68-205 min after intake of deuterated glucose from voxels in the anterior (B) and posterior (C) side of the liver and the stomach (D).
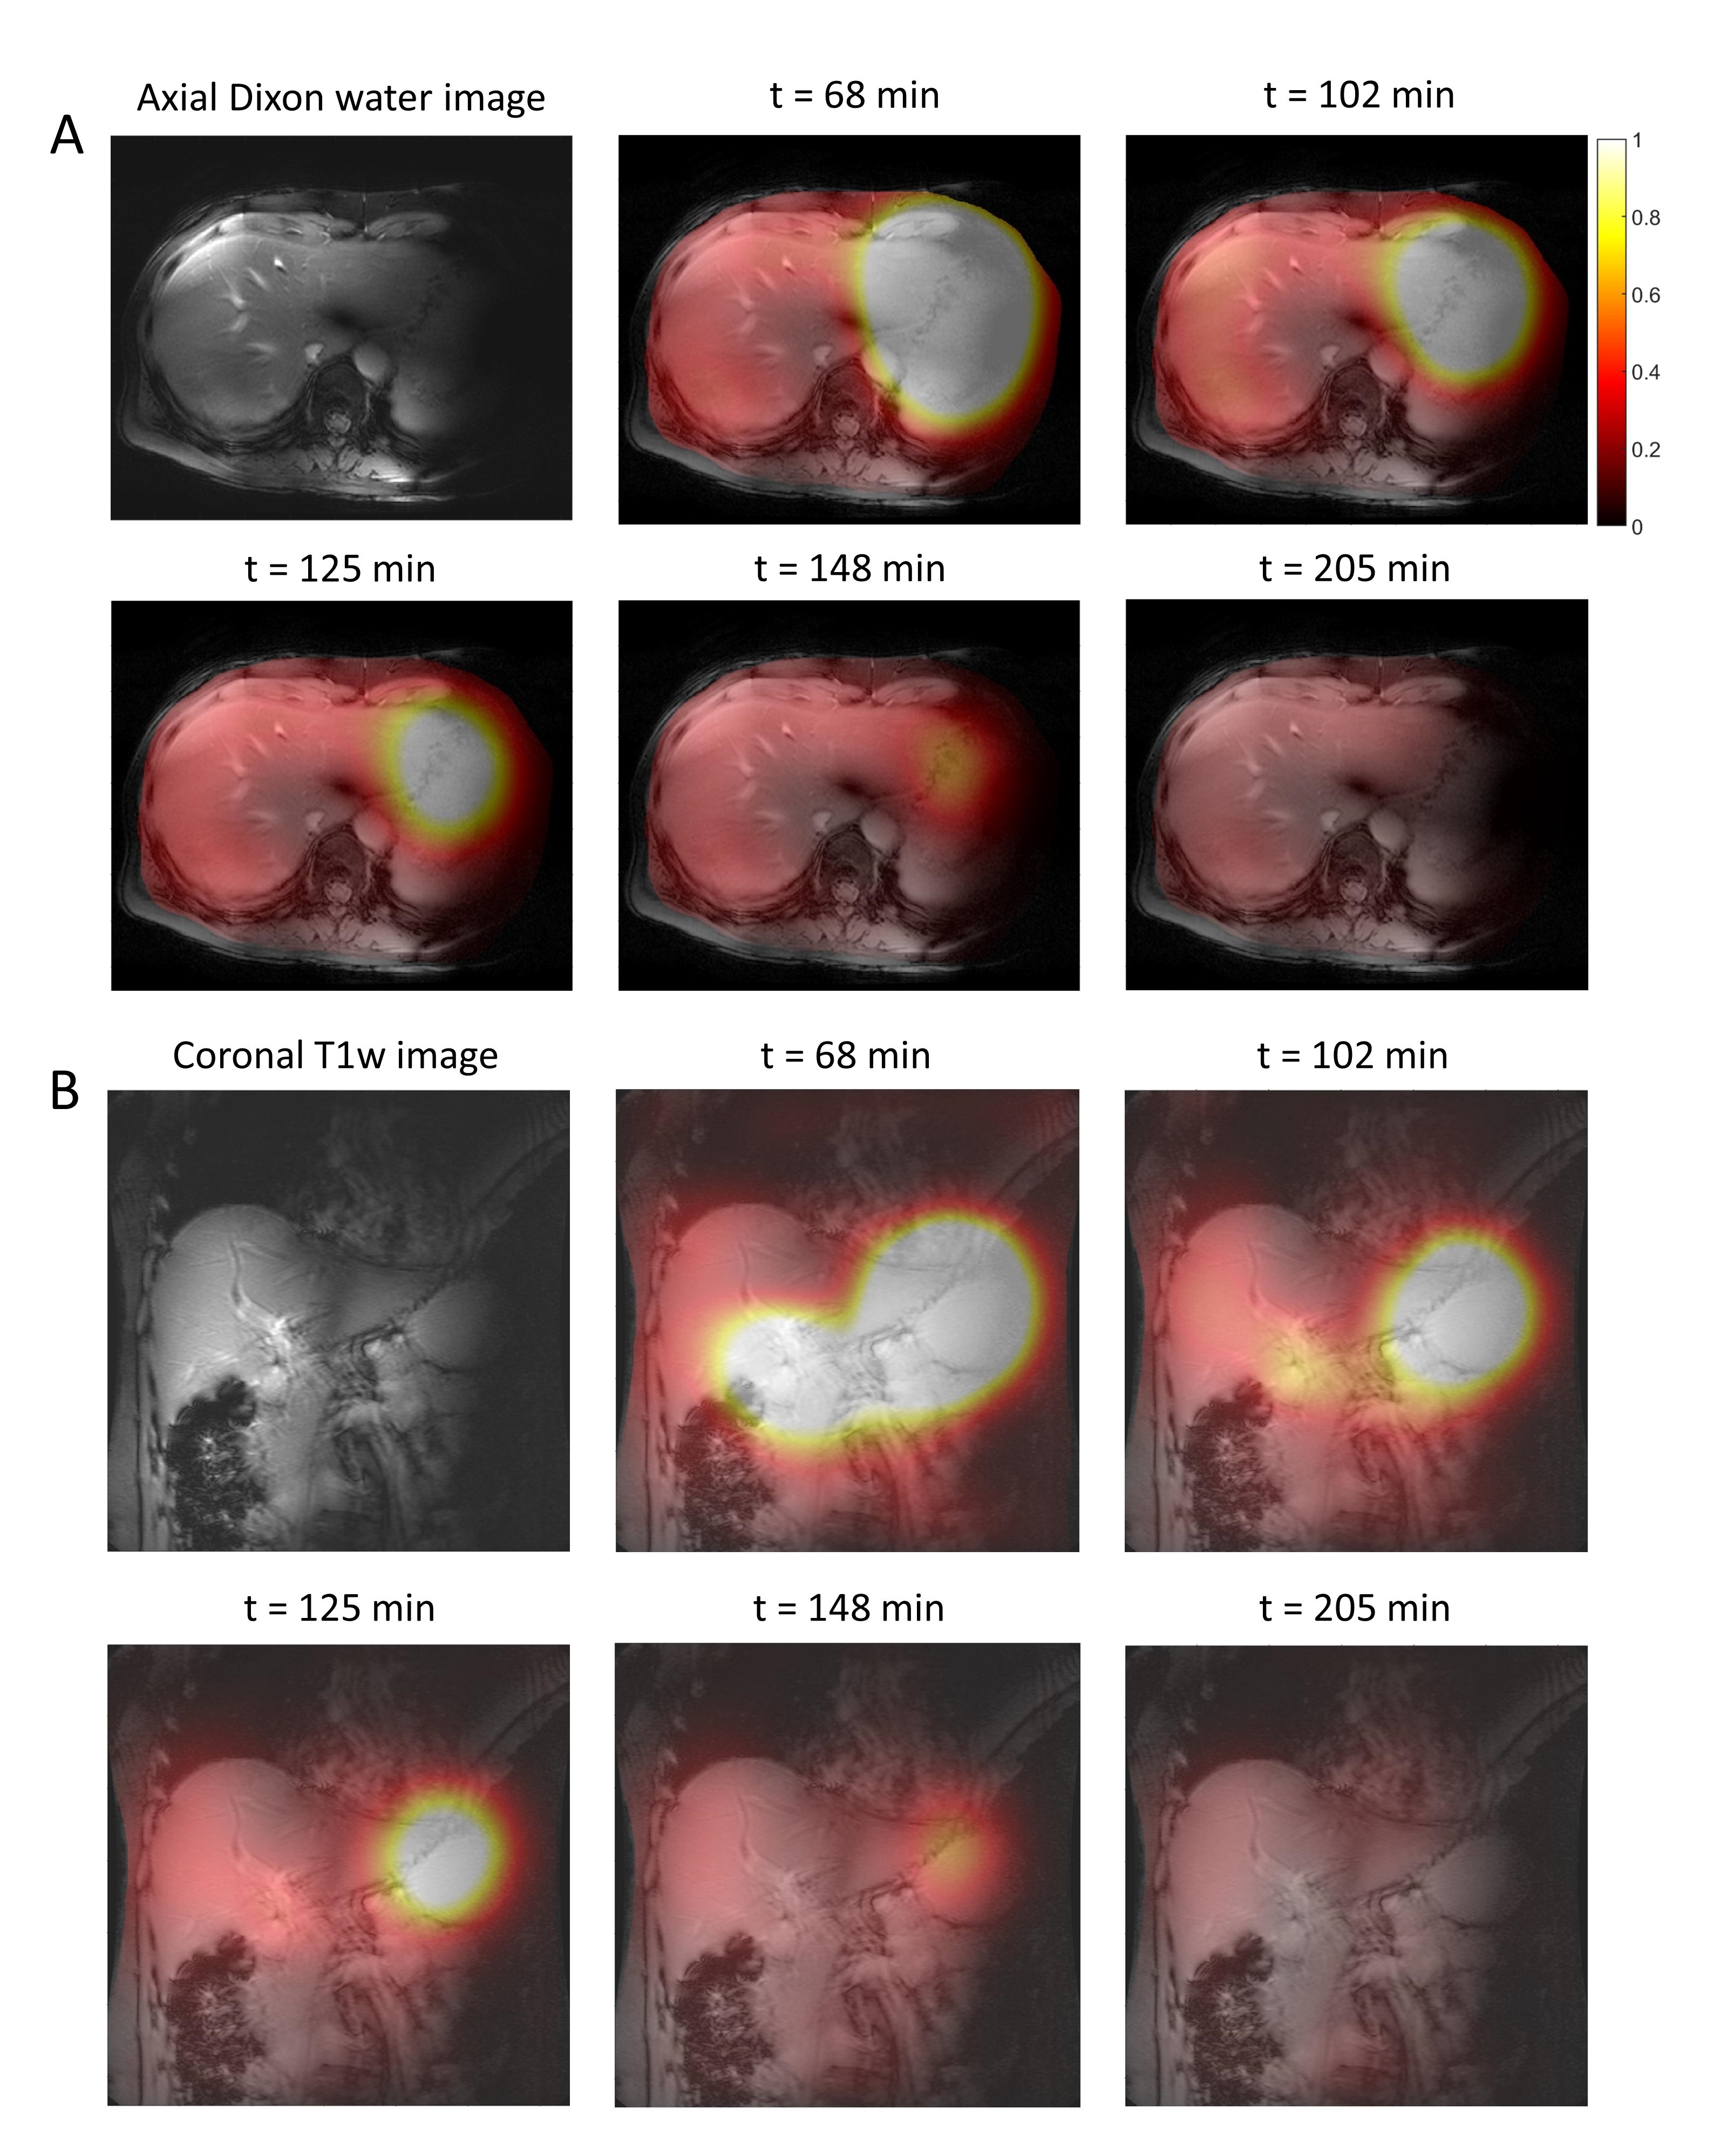
Figure 4. Axial (A) and coronal (B) color maps of fitted deuterated glucose signal amplitudes (in AU) from 5 selected 3D DMI measurements between 68 and 205 min after oral administration of [6,6’-2H2]glucose (scan 2). Signal amplitudes larger than 1 are represented in white. The color maps are overlaid on the anatomical axial Dixon and coronal T1w images.
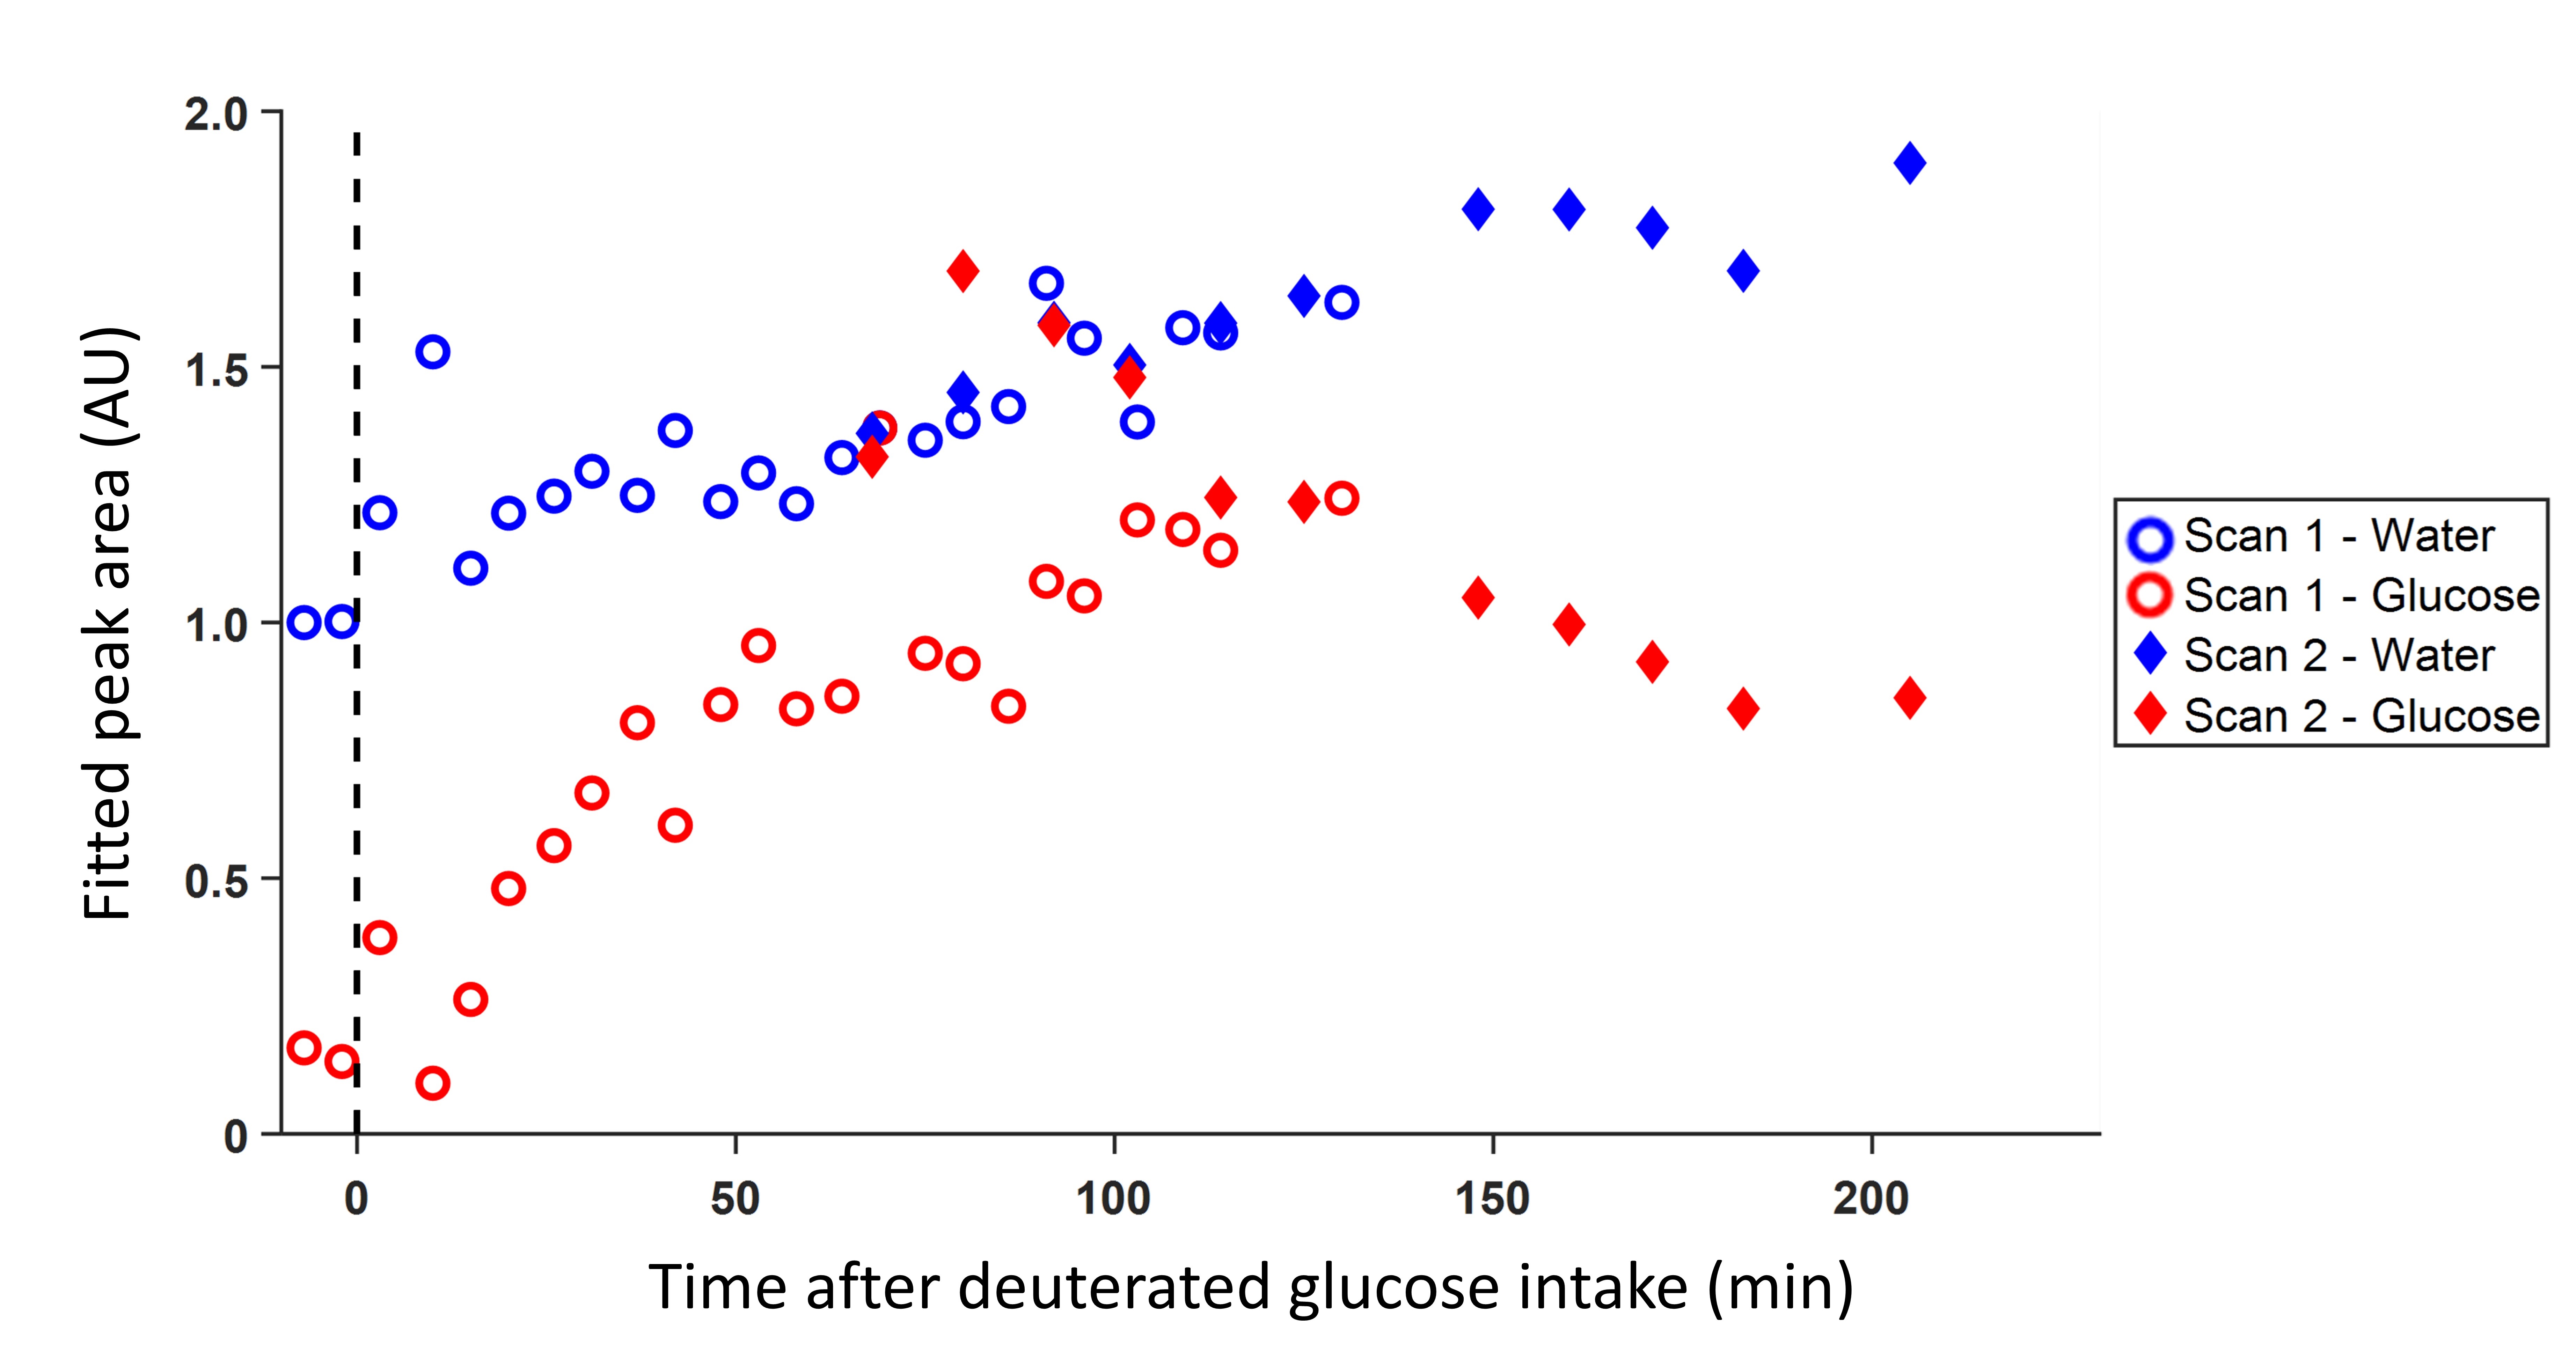
Figure 5. Fitted deuterated water and glucose peak amplitudes from the voxel in the posterior part of the liver (same voxel as in Fig. 1C and 3C) for scan 1 and scan 2. For both scans, the water amplitude from the first time point of respective scan was used to normalize the data (left side of the dashed line for scan 1). Additionally, all data points from scan 2 were scaled with a single value, such that the amplitude of the water signal at the first time point of scan 2 was equal to that at the corresponding time point in scan 1.