1784
Quadrupole moment splittings observed in 7T deuterium magnetic resonance spectra of skeletal muscle1Department of Radiology, University Medical Center Utrecht, Utrecht, Netherlands
Synopsis
DMI in combination with oral administration of deuterated glucose could potentially be used to investigate glycolytic and oxidative glucose metabolism in skeletal muscle non-invasively. However, skeletal muscle is a tissue with a high degree of spatial organization. In this study, we investigated the effect of anisotropic motional averaging on 7T deuterium spectra of the lower leg muscles. We observed quadrupole moment splittings of the natural abundance HDO signal and showed that the size of these splittings depends on the angle between muscle fibers and the main magnetic field B0.
Introduction
Deuterium metabolic imaging (DMI) is a new technique to study tissue metabolism in vivo, and has been applied in brain, liver, tumor and brown adipose tissue1–4. DMI in combination with oral administration of deuterated glucose could potentially also be used to investigate glycolytic and oxidative glucose metabolism in skeletal muscle non-invasively, and provide a more sensitive and lower-cost alternative to (usually unlocalized) 13C MRS measurements upon infusion of 13C-labeled glucose5. However, skeletal muscle is a tissue with a high degree of spatial organization. In 1H MR spectra this leads to orientation-dependent dipolar splitting for the resonances of creatine, taurine, and lactate, caused by incomplete motional averaging6,7. In this study, we investigated the effect of anisotropic motional averaging on the deuterium quadrupole moment of naturally abundant deuterated water (HDO) in the lower leg muscles and its dependence on the angle between muscle fibers and the main magnetic field B0.Methods
Deuterium MRSI (DMRSI) measurements of the lower leg muscles were performed at a 7T whole-body MRI system (Philips Healthcare, Best, Netherlands), using a 4-channel body array consisting of 4 2H transmit/receive loop coils combined with 4 1H transmit/receive dipole antennas (divided into an anterior and posterior element). Before the DMRSI experiments, 1H RF phase shimming was performed and a 3D B0 map was acquired. Linear and second order shim settings were optimized for the right lower leg. Then, T1w images were acquired with the same field of view as for the DMRSI measurements. All DMRSI measurements were performed with a pulse-acquire sequence using a 0.5 ms block pulse, followed by phase encoding gradients for 3D spatial encoding, an effective echo time of 1.84 ms, repetition time of 333 ms, 5000 Hz spectral bandwidth and 1024 spectral points. DMRSI acquisitions were made using a Hamming-weighted k-space acquisition pattern.One healthy male volunteer was scanned twice during the same session. During the first scan, the subject was in a supine position and the right lower leg was parallel with B0. DMRSI parameters: voxel size 14(LR)x14(AP)x25(FH) mm3, matrix size 10(LR)x10(AP)x12(FH), number of averages (NSA) 16, acquisition time 20:37 min. During the second scan, the subject was laying on his right side and the knee was bent, such that the angle between the right lower leg and B0 was approximately 45°. DMRSI parameters: voxel size 15(LR)x15(AP)x25(FH) mm3, matrix size 10(LR)x14(AP)x12(FH), NSA 8, acquisition time 17:26 min. During both scans the foot was not flexed.
Reconstruction and processing of the raw DMRSI data was performed with an in-house written MATLAB script (MathWorks, Natick, MA, USA). Channel combination was performed using the Roemer equal noise algorithm8. Spectra were processed with 2-Hz exponential apodization and zero-filling to 2048 points. To calculate average muscle fiber angles, data from a previously published diffusion tensor imaging (DTI) dataset was used9. Angles were calculated relative to the central axis of the tibia bone using QMRITools for Mathematica [github.com/mfroeling/QMRITools].
Results and Discussion
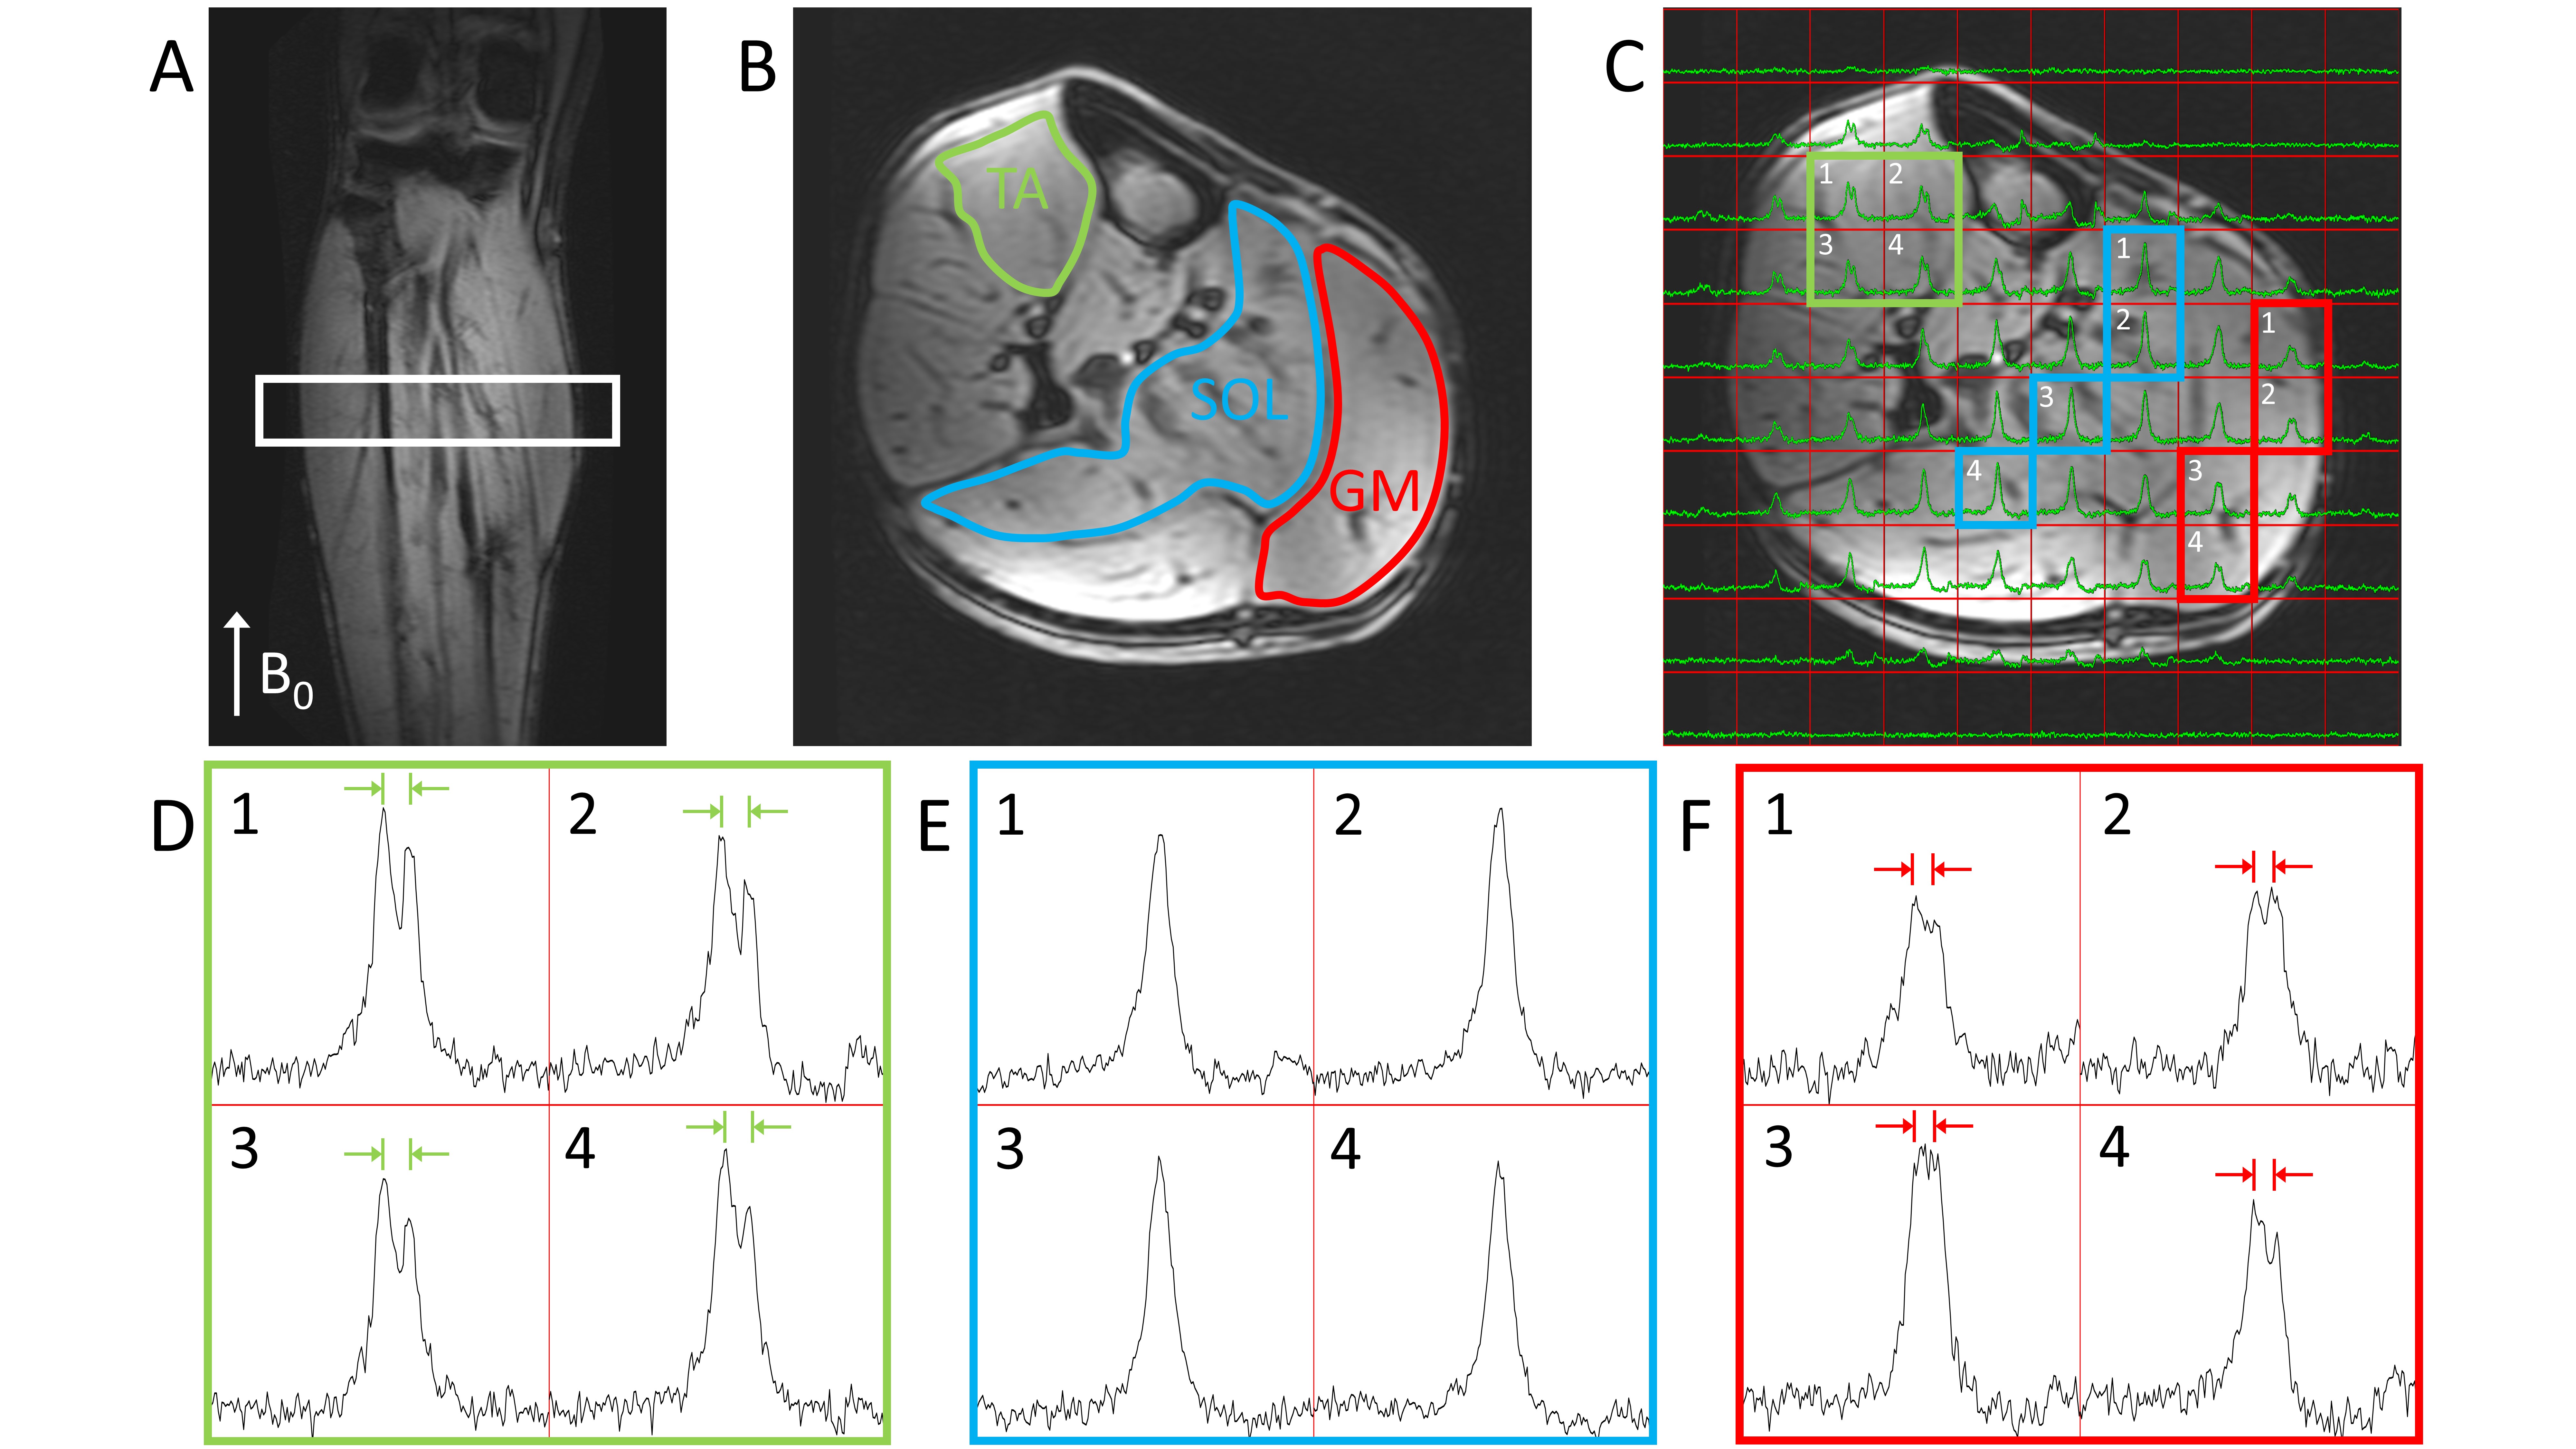
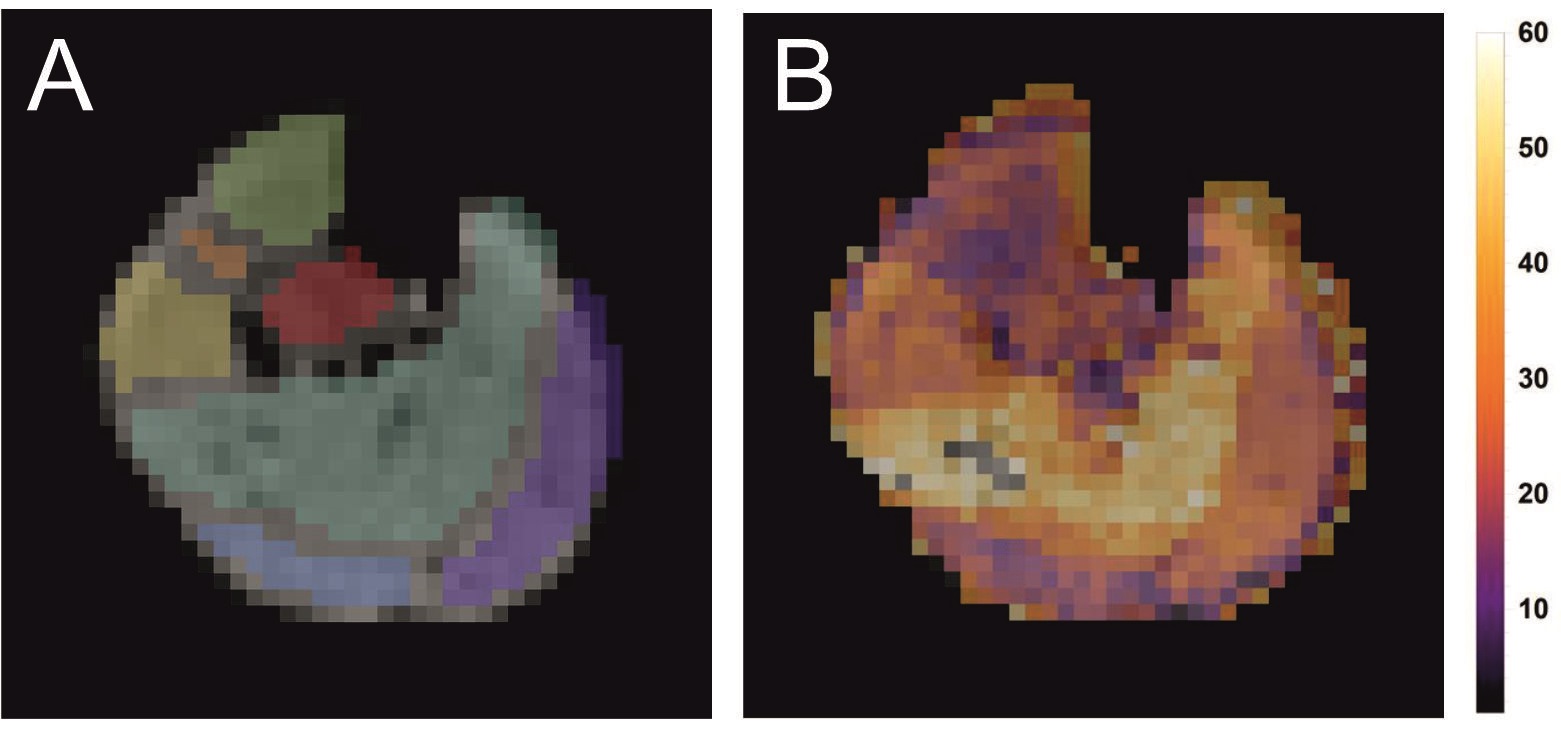
Figure 1 shows the results of the DMRSI measurements of the lower leg positioned parallel with B0. Spectra from selected voxels in the Tibialis Anterior (TA), Soleus (SOL) and Gastrocnemius Medialis (GM) muscles show a distinctive pattern. The HDO signal in TA is clearly split (splitting = 35±2 Hz), while in SOL a single peak with a linewidth (LW) of 35±1 Hz was observed. In GM, a splitting can be observed, but it is smaller (26±4 Hz) than in the TA.The splitting of the HDO signals arise from the large deuterium quadrupole moment that is not isotropically averaged in skeletal muscle tissue. Like for dipolar couplings in 1H MR spectra, the size of the quadrupole moment splitting depends on the angle θ between the muscle fibers and B0, via a term (3cos2θ - 1). Figure 2 shows muscle fiber angles with respect to the central axis of the tibia bone determined from DTI data in the lower leg of a healthy volunteer. Average angles for 44 volunteers were determined to be 22°±7° for TA, 29°±5° for GM, and 39°±7° for SOL. Thus, with the lower leg positioned parallel with B0, the muscle fibers in TA are most parallel with B0, leading to the largest quadrupole moment splitting, while the muscle fibers in SOL are closest to the magic angle, resulting in the smallest quadrupole moment splitting, which is in good accordance with the data (Figure 1).
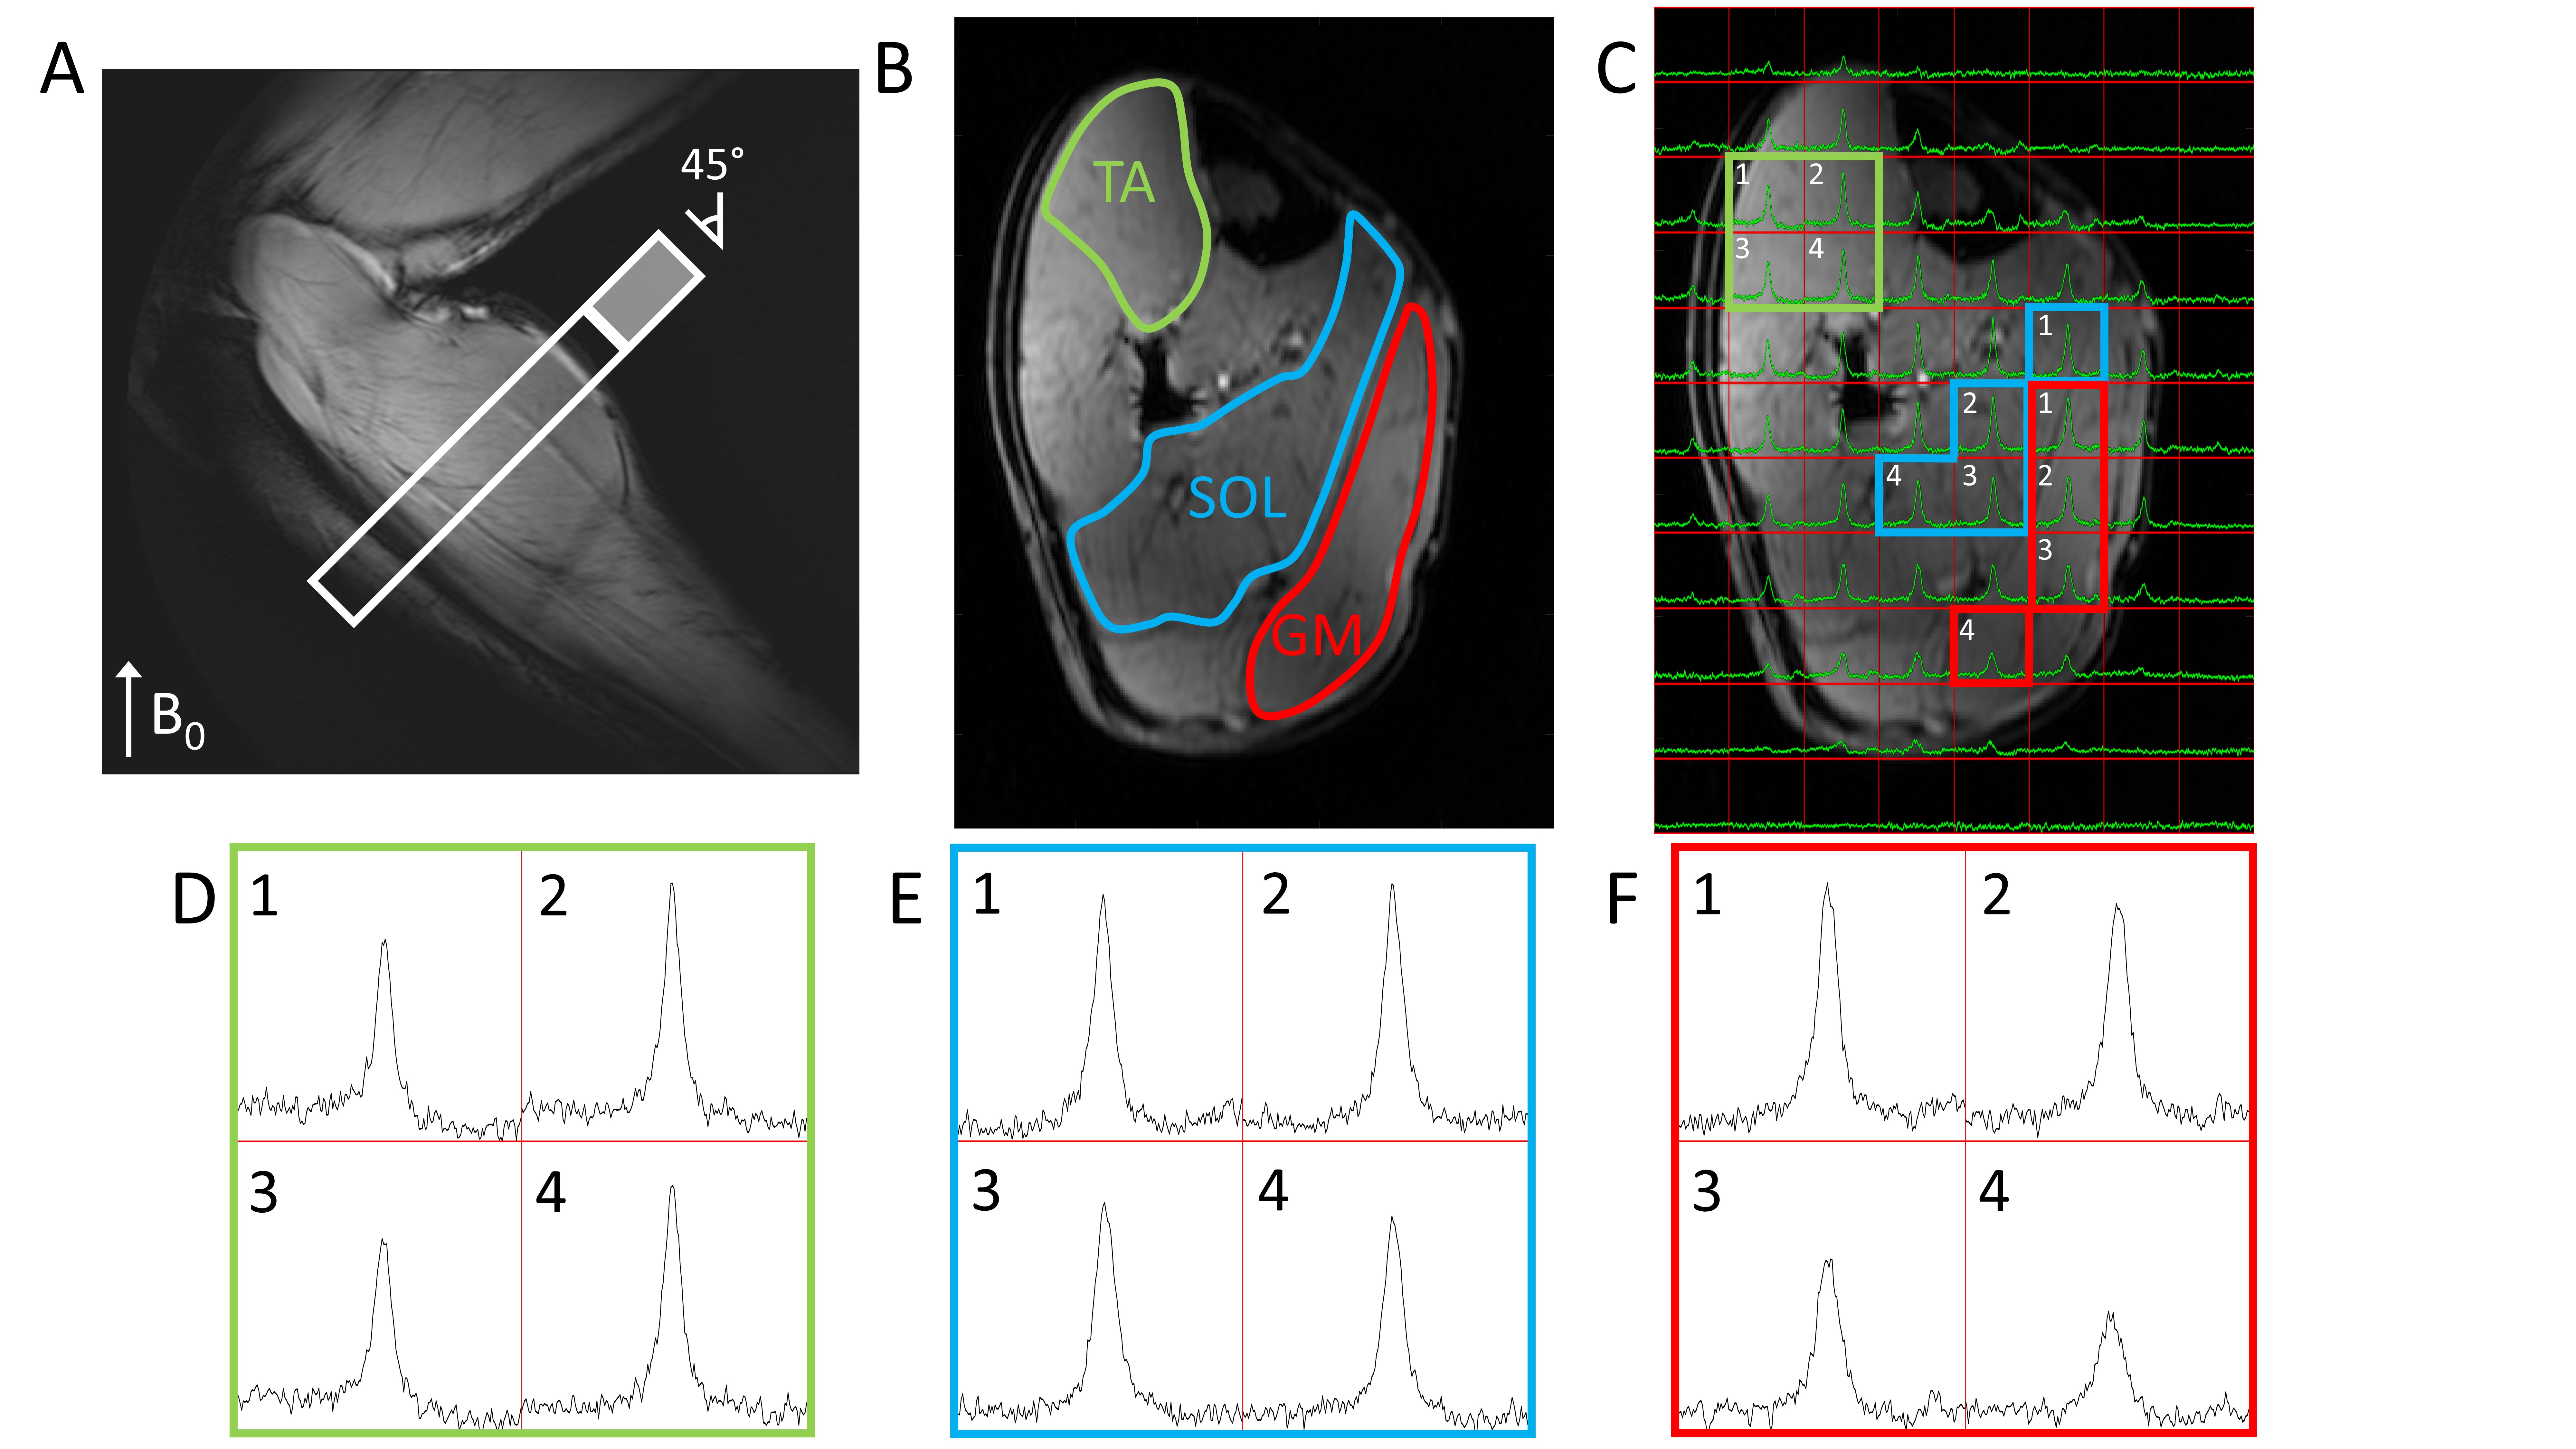
The results from the DMRSI measurements with the lower leg at an angle of approximately 45° with B0 are shown in Figure 3. With this orientation, no quadrupole moment splittings can be observed in any of the three muscles (LW’s 30±3, 35±3 and 41± 3 Hz for TA, SOL and GM, respectively), which is expected from the angles between the muscle fibers and B0.
Conclusion
Anisotropic motional averaging in skeletal muscle leads to deuterium quadrupole moment splittings of the HDO signal, the size of which depends on the angle between the muscle fibers and B0. This effect is also expected for signals from deuterated glucose, glutamate, glutamine and lactate, which will complicate DMI spectra in skeletal muscle and should be taken into account during analysis.Acknowledgements
This work was funded by a HTSM grant from NWO TTW (project number 17134) and by a FET Innovation Launchpad grant from the EU (grant number 850488).References
1. De Feyter HM, Behar KL, Corbin ZA, Fulbright RK, Brown PB, McIntyre S, Nixon TW, Rothman DL, De Graaf RD. Deuterium metabolic imaging (DMI)for MRI-based 3D mapping of metabolism in vivo. Sci Adv. 2018;4(8):1-12. doi:10.1126/sciadv.aat7314
2. Lu M, Zhu XH, Zhang Y, Mateescu G, Chen W. Quantitative assessment of brain glucose metabolic rates using in vivo deuterium magnetic resonance spectroscopy. J Cereb Blood Flow Metab. 2017;37(11):3518-3530. doi:10.1177/0271678X17706444
3. Kreis F, Wright AJ, Hesse F, Fala M, Hu DE, Brindle KM. Measuring tumor glycolytic flux in vivo by using fast deuterium MRI. Radiology. 2020;294(2):289-296. doi:10.1148/radiol.2019191242
4. Riis-Vestergaard MJ, Laustsen C, Mariager CØ, Schulte RF, Pedersen SB, Richelsen B. Glucose metabolism in brown adipose tissue determined by deuterium metabolic imaging in rats. Int J Obes. 2020;1. doi:10.1038/s41366-020-0533-7
5. Befroy DE, Falk Petersen K, Rothman DL, Shulman GI. Assessment of in vivo mitochondrial metabolism by magnetic resonance spectroscopy. Methods Enzymol. 2009;457:373-93. doi: 10.1016/S0076-6879(09)05021-6
6. Vermathen P, Boesch C, Kreis R. Mapping fiber orientation in human muscle by proton MR spectroscopic imaging. Magn Reson Med. 2003;49(3):424-432. doi:10.1002/mrm.10396
7. Boesch C, Kreis R. Dipolar coupling and ordering effects observed in magnetic resonance spectra of skeletal muscle. NMR Biomed. 2001;14(2):140-148. doi:10.1002/nbm.684
8. Roemer PB, Edelstein WA, Hayes CE, Souza SP, Mueller OM. The NMR phased array. Magn Reson Med. 1990;16(2):192-225. doi:10.1002/mrm.1910160203
9. Schlaffke L, Rehmann R, Rohm M, Otto LAM, De Luca A, Burakiewicz J, Baligand C, Monte J, Den Harder C, Hooijmans MT, Nederveen A, Schaeger S, Weidlich D, Karampinos DC, Stouge A, Vaeggemose M, D'Angelo MG, Arrigoni F, Kan HE, Froeling M. Multi-center evaluation of stability and reproducibility of quantitative MRI measures in healthy calf muscles. 2019. doi:10.1002/nbm.4119
Figures