1783
Optical Flow-based Data Augmentation and its Application in Deep Learning Super Resolution1School of Information Technology and Electrical Engineering, the University of Queensland, Brisbane, Australia, 2Research and Development MR, Siemens Healthcare, Brisbane, Australia
Synopsis
Deep learning (DL) methods have been a hot topic in MRI reconstruction, such as super-resolution. However, DL usually requires a substantial amount of training data, which may not always be accessible because of limited clinical cases, privacy limitation, the cross-vendor, and cross-scanner variation, etc. In this work, we propose an affine transformation data augmentation method to increase training data for MRI super-resolution. Comprehensive experiments were performed on real T2 brain images to validate the proposed method.
Introduction
Supervised CNN-based super-resolution (SR) methods are used to enhance image resolution in MRI. However, insufficient training data in SR may cause overfitting, which degrades image quality. The acquisition of adequate high-quality images requires considerable time and resources, limiting the development of DL in SR. Data augmentation (DA) is a practical way to increase the image dataset in deep learning (DL)-based MRI reconstructions. However, conventional DA methods (e.g., translating, rotating) proposed in the computer vision field usually do not utilize MR images' characteristics, where organs, tissue structure between MR slices have high similarity. The Optical flow (OF) is a widely used method in the computer vision domain to compute a flow field and estimate the motion of pixels between two consecutive image frames in a video. Here, we introduce the optical flow technique to MRI to characterize the anatomical image similarity and diversity.Methods
The optical flow with two spatial dimensions can be mathematically described as:$$I(x,y,t)=I(x+dx, y+dy, t+dt)$$
where we assume the image intensity $$$I$$$ between two MRI slices $$$t$$$ as a function of space $$$(x,y)$$$ is constant. $$$(dx, dy)$$$ denotes its moving pixels from the source image $$$I(x,y,t)$$$ to the target image $$$I(x+dx, y+dy)$$$. Then the first-order Taylor series approximation is adopted to arrive at the following equation:
$$(∂I)/(∂x)u+(∂I)/(∂y)v+(∂I)/(∂t)=0$$
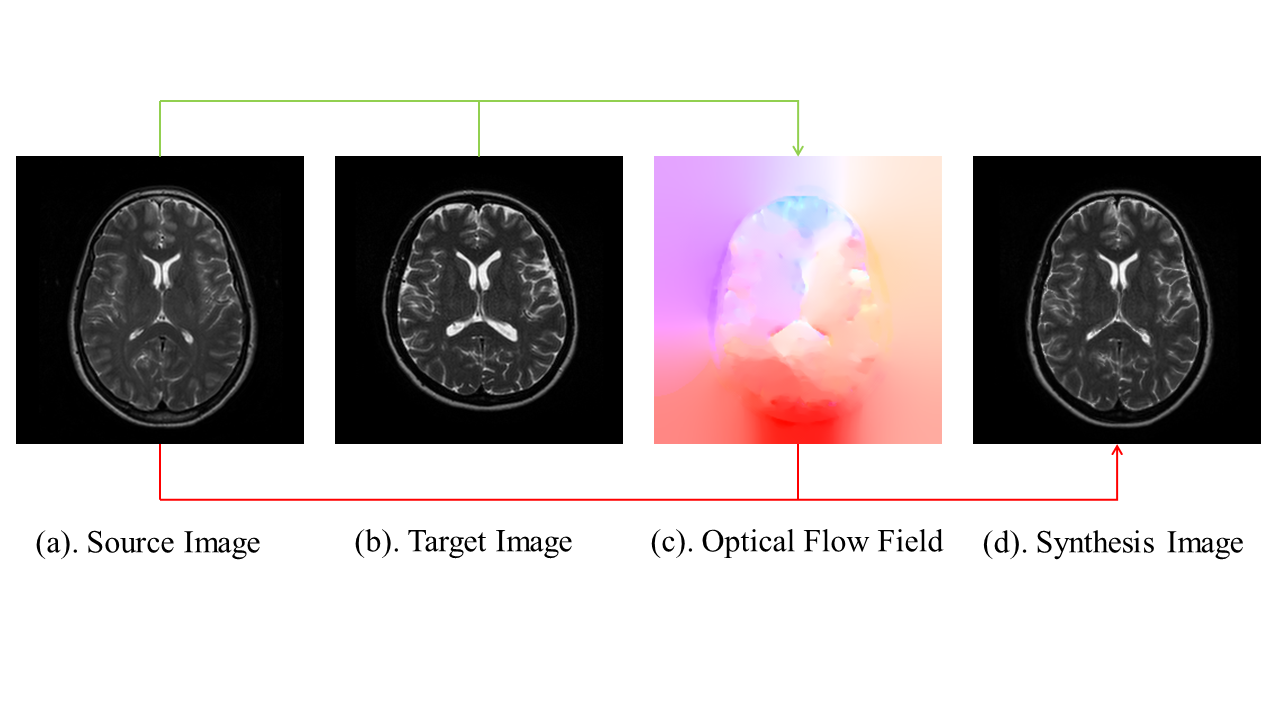
where $$$(∂I)/(∂x)$$$ , $$$(∂I)/(∂y)$$$, $$$(∂I)/(∂t)$$$ are the image gradients along the $$$x$$$, $$$y$$$, $$$t$$$ axis. $$$u=dx/dt$$$ and $$$v=dy/dt$$$ are the objective displacement terms. Horn-Schunck method 1 is implemented to provide an approximate solution to this ill-posed equation. Figure 1 presents an example source image, target image, and the synthesis image OF example between two MR images, where the synthesis image is obtained by applying the objective displacement terms on the source image.
Dataset and experiment
The experiment was performed on T2 brain images from the IXI dataset (https://brain-development.org/ixi-dataset/). Each 3D data volume contains 256×256×130 data points. In this preliminary study, only the central 2D MR slices were considered. The probability of applying the OF method for each slice was set to 50‰. The target images were either 10 adjacent slices within the same volume or 10 adjacent slices at the same location of a different volume. This was to prevent excessive transitions of the synthesis image, which could cause distortion artifacts. Two volumes of MR images were used for training, testing, and validation, respectively. The magnitude of slices in the image domain was used as the ground truth. Low-resolution slices were generated by bicubic downsampling by a factor of 2. Three experiments are conducted:- To evaluate the performance of the OF as a DA method: the OF was compared with three DA methods: Cutout 2, Mixup 3, and Cutblur 4. EDSR 5 was used as the baseline model. The reconstruction error was quantified using PSNR and SSIM.
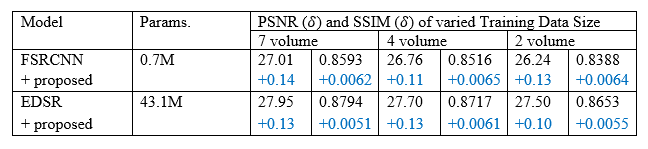
- To evaluate the effectiveness of the proposed method with varied model sizes, the following two SR modules were used: FSRCNN 6 and EDSR with the number of parameters scaling from 0.07M to 43.2M (million).
- To demonstrate the performance of the proposed model with various dataset scales: 7 volumes, 4 volumes, and 2 volumes of T2 brain images were applied for training separately.
Results and discussion
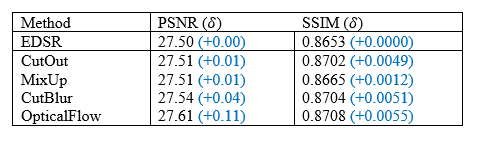
The performance of the OF as a DA method was compared to other DA methods as shown in Table 1. CutMix and MixUp increased the computational burden significantly without noticeably improving the training quality, with marginal improvement in PSNR of 0.01dB. In contrast, the OF method achieved a notable improvement in PSNR (0.11dB) when compared with EDSR without DA.The impact of the OF on various model sizes and dataset scales is summarized in Table 2. The proposed method improved the DL training performance at different model scales. With 7 volumes, it brought 0.14dB and 0.13 dB improvement on FSRCNN, and EDSR, respectively. Moreover, different volume sizes and model sizes did not noticeably affect the performance of the OF method, indicating the robustness of the proposed method against variations of model and training data size.
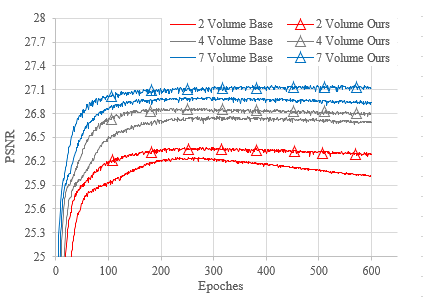
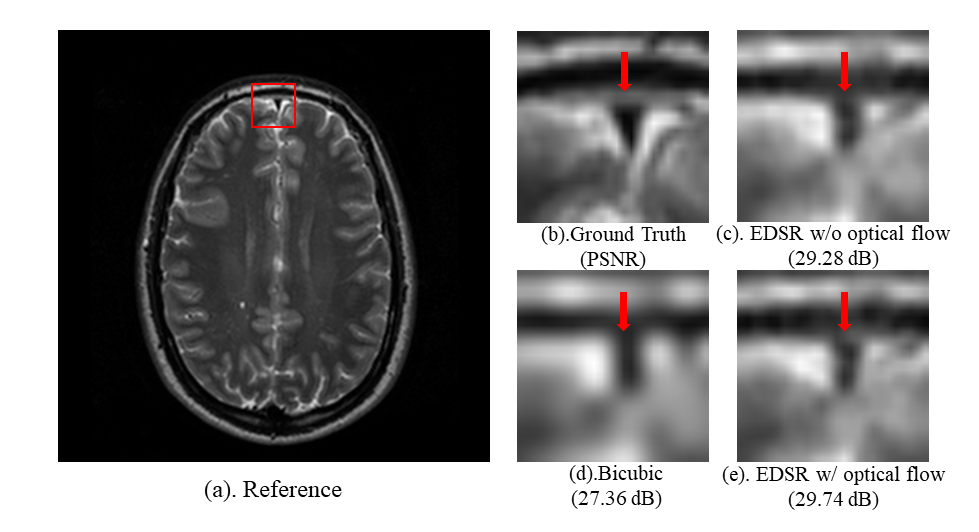
The convergence rate on the validation set is shown in Figure 2. The OF method significantly reduced the overfitting. Note the EDSR model suffered from severe overfitting when 2 volumes were used for training. In contrast, the overfitting was greatly reduced by the proposed method with the same condition. Overfitting was further alleviated with more training data, namely 4 and 7 volumes. In all cases, OF provided significantly improved convergence speed. Figure 3 illustrated an example of when the EDSR method was used with and without applying the OF method. The quality of the recovered image was notably enhanced using the proposed OF-based DA method.
Conclusion
An optical flow method was introduced to the synthesis of new training data for deep learning-based MRI super-resolution. The method was validated on T2 brain images and compared with different CNN-model sizes and training data sizes. The results indicate that our OF method not only reduces the overfitting problem but also boosts the performance of CNN-models. The proposed work is tested with 2D data. The framework can be extended for a higher dimension, which will be subjected to further study in the future.Acknowledgements
No acknowledgement found.References
1. Horn, B.K.P., Schunck, B.G. Determining optical flow. Artificial Intelligence 17, 185–203, 1981
2. T. DeVries and G. W. Taylor. Improved Regularization of Convolutional Neural Networks with Cutout. arXiv preprint arXiv:1708.04552, 2017.
3. H. Zhang, M. Cisse, Y. N. Dauphin, and D. Lopez-Paz. mixup: Beyond Empirical Risk Minimization. arXiv preprint arXiv:1710.09412, 2017.
4. J. Yoo, N. Ahn, and K.-A. Sohn. Rethinking Data Augmentation for Image Super-resolution: A Comprehensive Analysis and a New Strategy. arXiv preprint arXiv:2004.00448, 2020.
5. B. Lim, S. Son, H. Kim, S. Nah, and K. M. Lee. Enhanced Deep Residual Networks for Single Image Super-Resolution. In Proceedings of the IEEE conference on computer vision and pattern recognition workshops, pages 136-144, 2017.
6. C. Dong, C. C. Loy, and X. Tang. Accelerating the super-resolution convolutional neural network. In Proceedings of the European Conference on Computer Vision (ECCV), 2016.
Figures