1776
Higher Resolution with Improved Image Quality without Increased Scan Time: Is it possible with MRI Deep Learning Reconstruction?1Canon Medical Systems USA, Inc., Tustin, CA, United States, 2Steadman Philippon Research Institute, Vail, CO, United States, 3The Steadman Clinic, Vail, CO, United States, 4Stanford University, Stanford, CA, United States
Synopsis
In magnetic resonance imaging (MRI), increased resolution leads to increased scan time and reduced signal-to-noise ratio (SNR). Parallel imaging (PI) can be used to mitigate the increased scan time but comes with an additional penalty in SNR resulting in reduced image quality. Deep Learning Reconstruction (DLR) has recently been developed to intelligently remove noise from low SNR input images producing increased SNR and quality output images. SNR gain from DLR could be used to increase resolution while maintaining scan time. This work demonstrates that DLR could be used to increase resolution and image quality without increased scan time.
INTRODUCTION
In MRI, there is an inherent tradeoff between SNR, scan time, and resolution governed by MR physics. For example, increased resolution leads to increased scan time and reduced SNR. Parallel imaging (PI) can be used to mitigate the increased scan time but comes with an additional penalty in SNR resulting in reduced image quality especially in challenging sequences such as those with fat suppression. DLR [1-3] has been developed to intelligently remove noise from low SNR input images producing increased SNR and quality output images. SNR gain from DLR could be used to increase resolution while maintaining scan time. This work aims to investigate if DLR could be used to increase resolution and image quality without increased scan time.METHODS
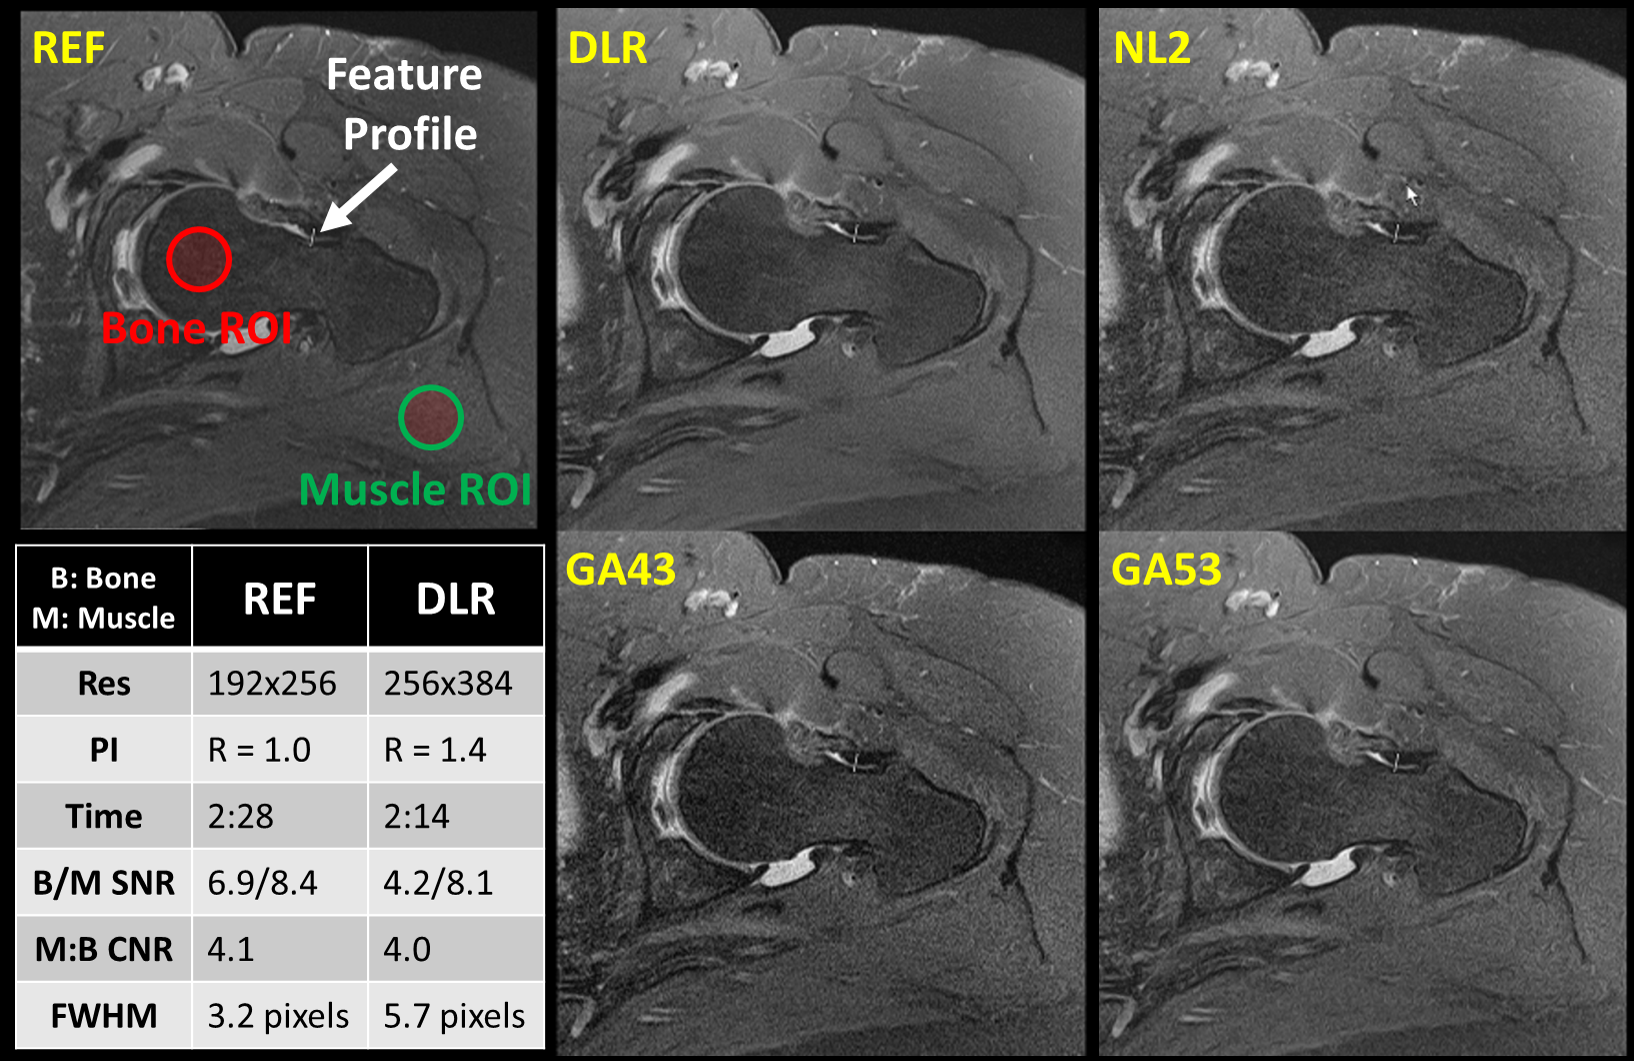
Data acquisition:Institutional review board (IRB) approval and written consents were obtained for 17 patients (10 shoulders and 7 hips) scanned on a Canon Galan 3T. Each patient underwent the routine clinical protocol plus 3 additional matched sequences, which were modified to increased resolution while maintaining scan time using PI. Each additional sequence was reconstructed with DLR and 3 conventional methods (NL2, GA43, and GA53). The DLR-reconstructed images were evaluated and compared against 3 conventional methods and the matched sequence in the routine protocol (REF). The labels of the 5 reconstructions were removed and their order was randomized before sharing with two experienced MSK specialists for blinded review via a cloud-based webPACS. An example of 5 reconstructions are shown in Figure 1.
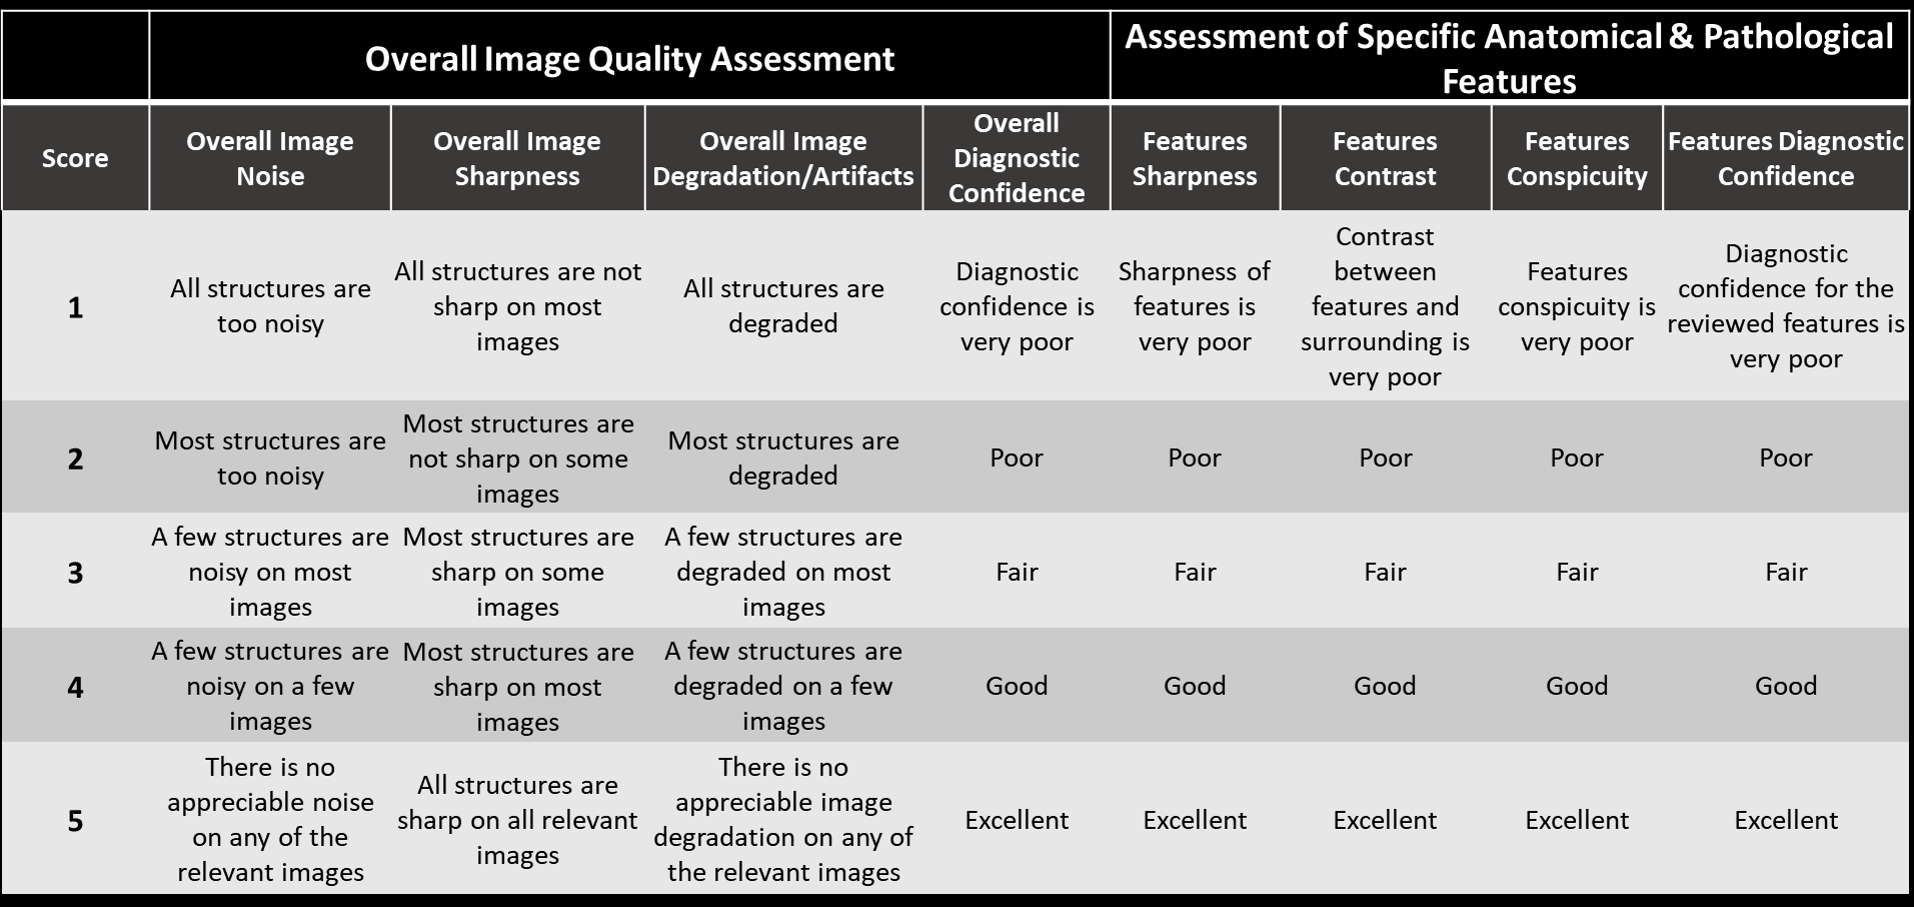
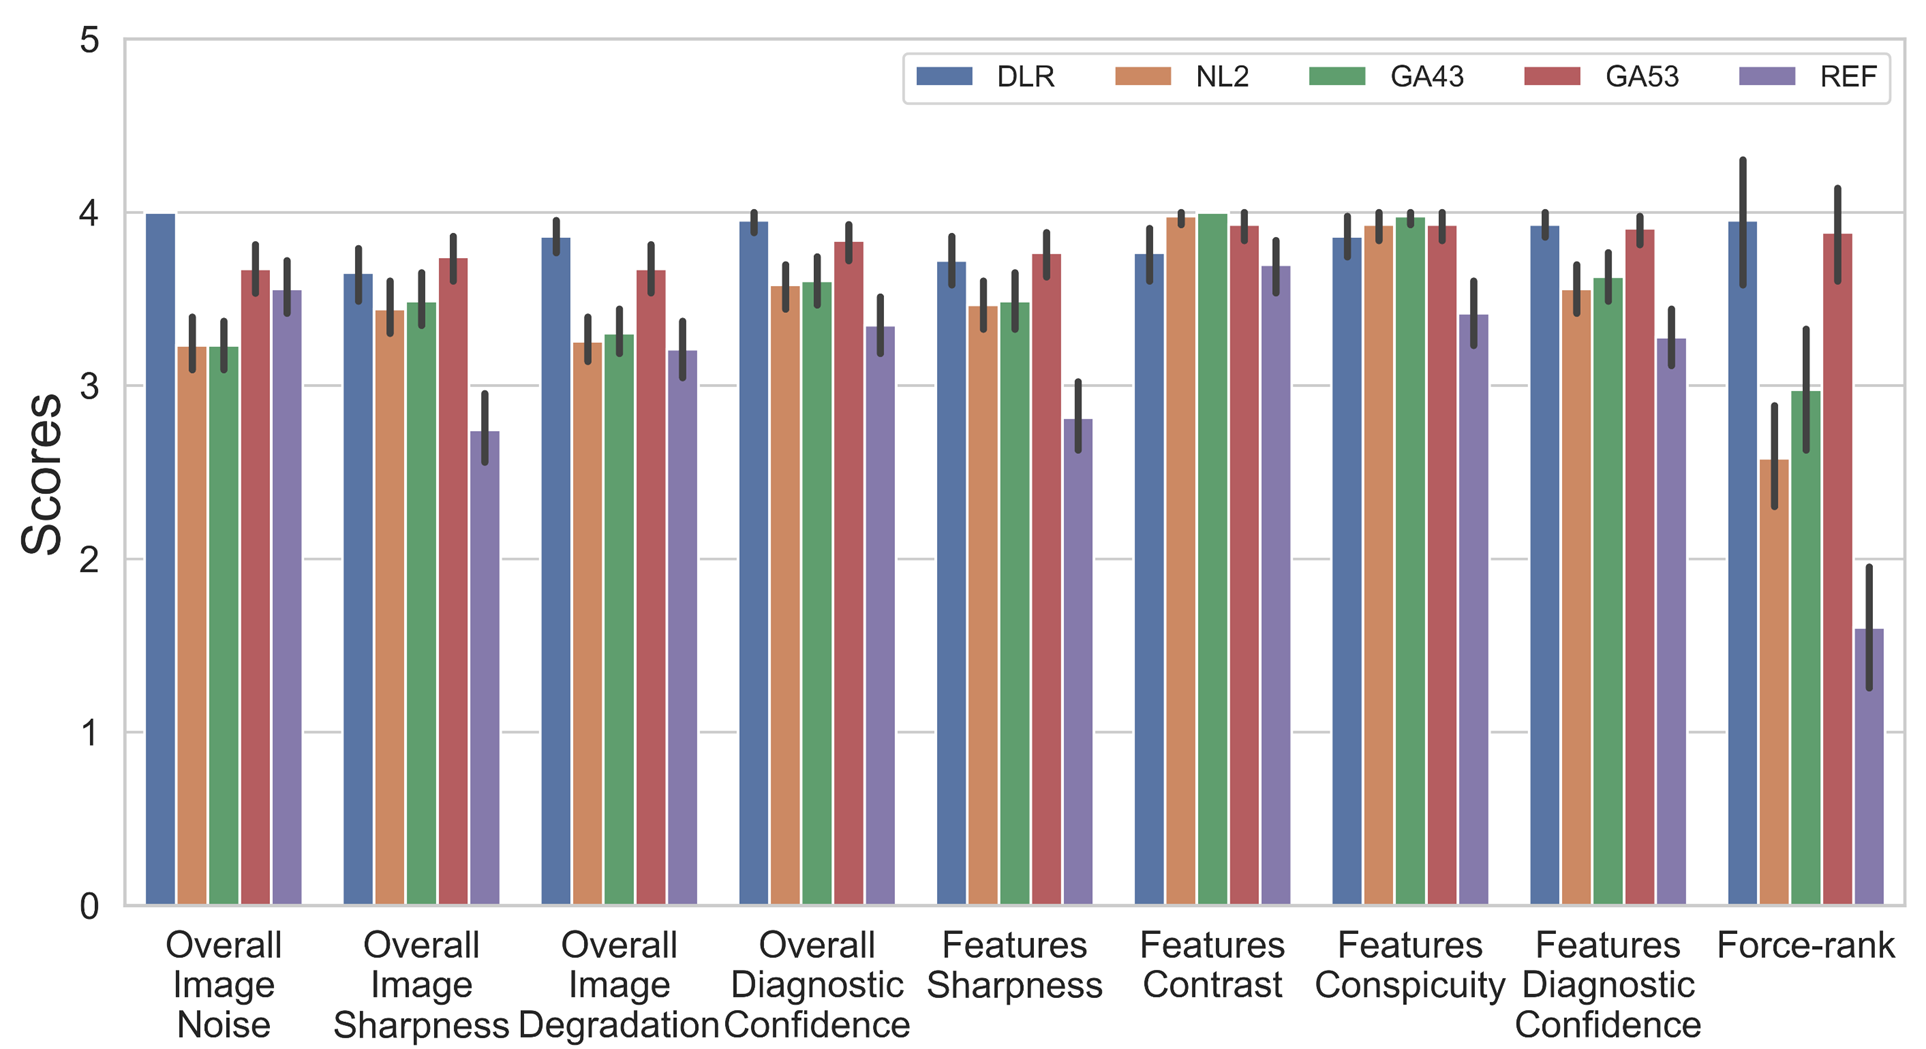
Image Scoring: Each of the 5 reconstructions was reviewed and scored based on a Likert scale from 1 to 5 (1=lowest, 5=highest) on 8 criteria [4] as shown in Figure 2. Besides overall image quality assessment, radiologists’ attention is drawn to review and assess the specific and clinically relevant anatomical and pathological structures. Three to five clinically relevant anatomical features for each anatomical region were pre-specified while pathological features and findings were identified by radiologists during the review. Additionally, force-ranking from 1 to 5 (1=worst, 5=best) was also requested to assess the radiologists’ preference among the 5 reconstructions for each sequence.
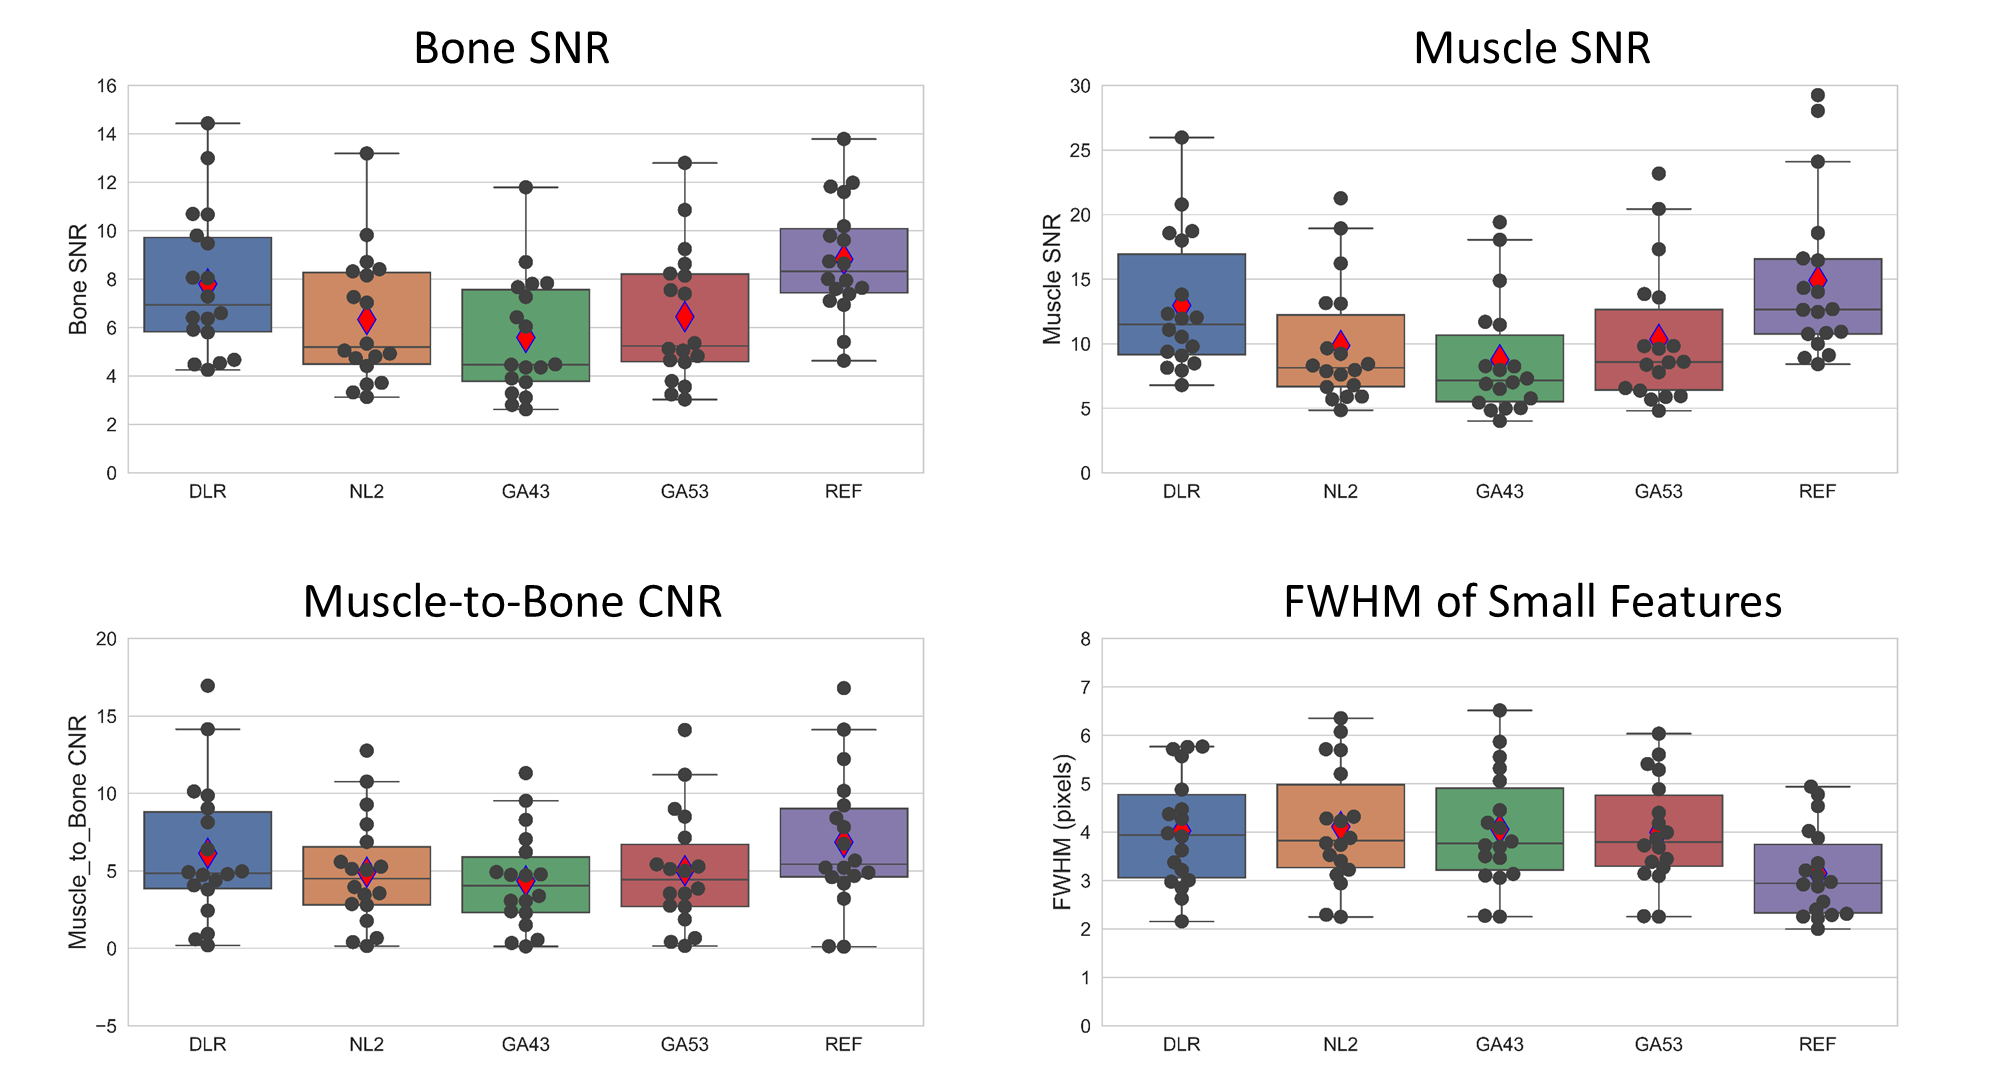
Quantitative Measures: DLR’s SNR for bone and muscle, Contrast-to-Noise Ratio (CNR) between bone and muscle, and full-width-at-half-maximum (FWHM) of small features were measured (on 3 hips and 3 shoulders) and compared against those measured from other 4 counterparts (NL2, GA43, GA53, and REF). Representative placements of regions of interest (ROIs) and feature profile were at identical locations for all 5 reconstructions and shown in Figure 1. Due to lack of background-only region in some of the images, SNR was measured as mean divided by the standard deviation of the signal intensities within the ROI. CNR was calculated as abs(meanS_roi1 – meanS_roi2)/ stdS_roi2.
Statistical Analysis: Scores received from radiologists were un-blinded and organized for visualization and statistical analysis. Inter-rater agreement was assessed using the Gwet’s Agreement Coefficient (AC2) with ordinal weighting [5, 6]. AC2 values indicate agreement levels as follows: 0-0.20, slight, 0.21-0.40, fair, 0.4-0.60, moderate, 0.61–0.80, substantial, and 0.81–1 as almost perfect agreement. Friedman test was used to determine if an overall statistically significant differences within the groups were present, followed by separate Wilcoxon signed-rank tests on the four pairwise comparisons ((i) DLR vs NL2, (ii) DLR vs GA43, (iii) DLR vs GA53, and (iv) DLR vs REF) with a priori Bonferroni adjustment (to correct for the multiple comparisons) for a significance level of 0.0125 (i.e., 0.05/4). Paired Student’s T-tests were used when comparing SNR, CNR, FWHM, Resolutions, and Scan time. A P-value smaller than 0.0125 (i.e., 0.05/4) is considered statistically significant.
RESULTS
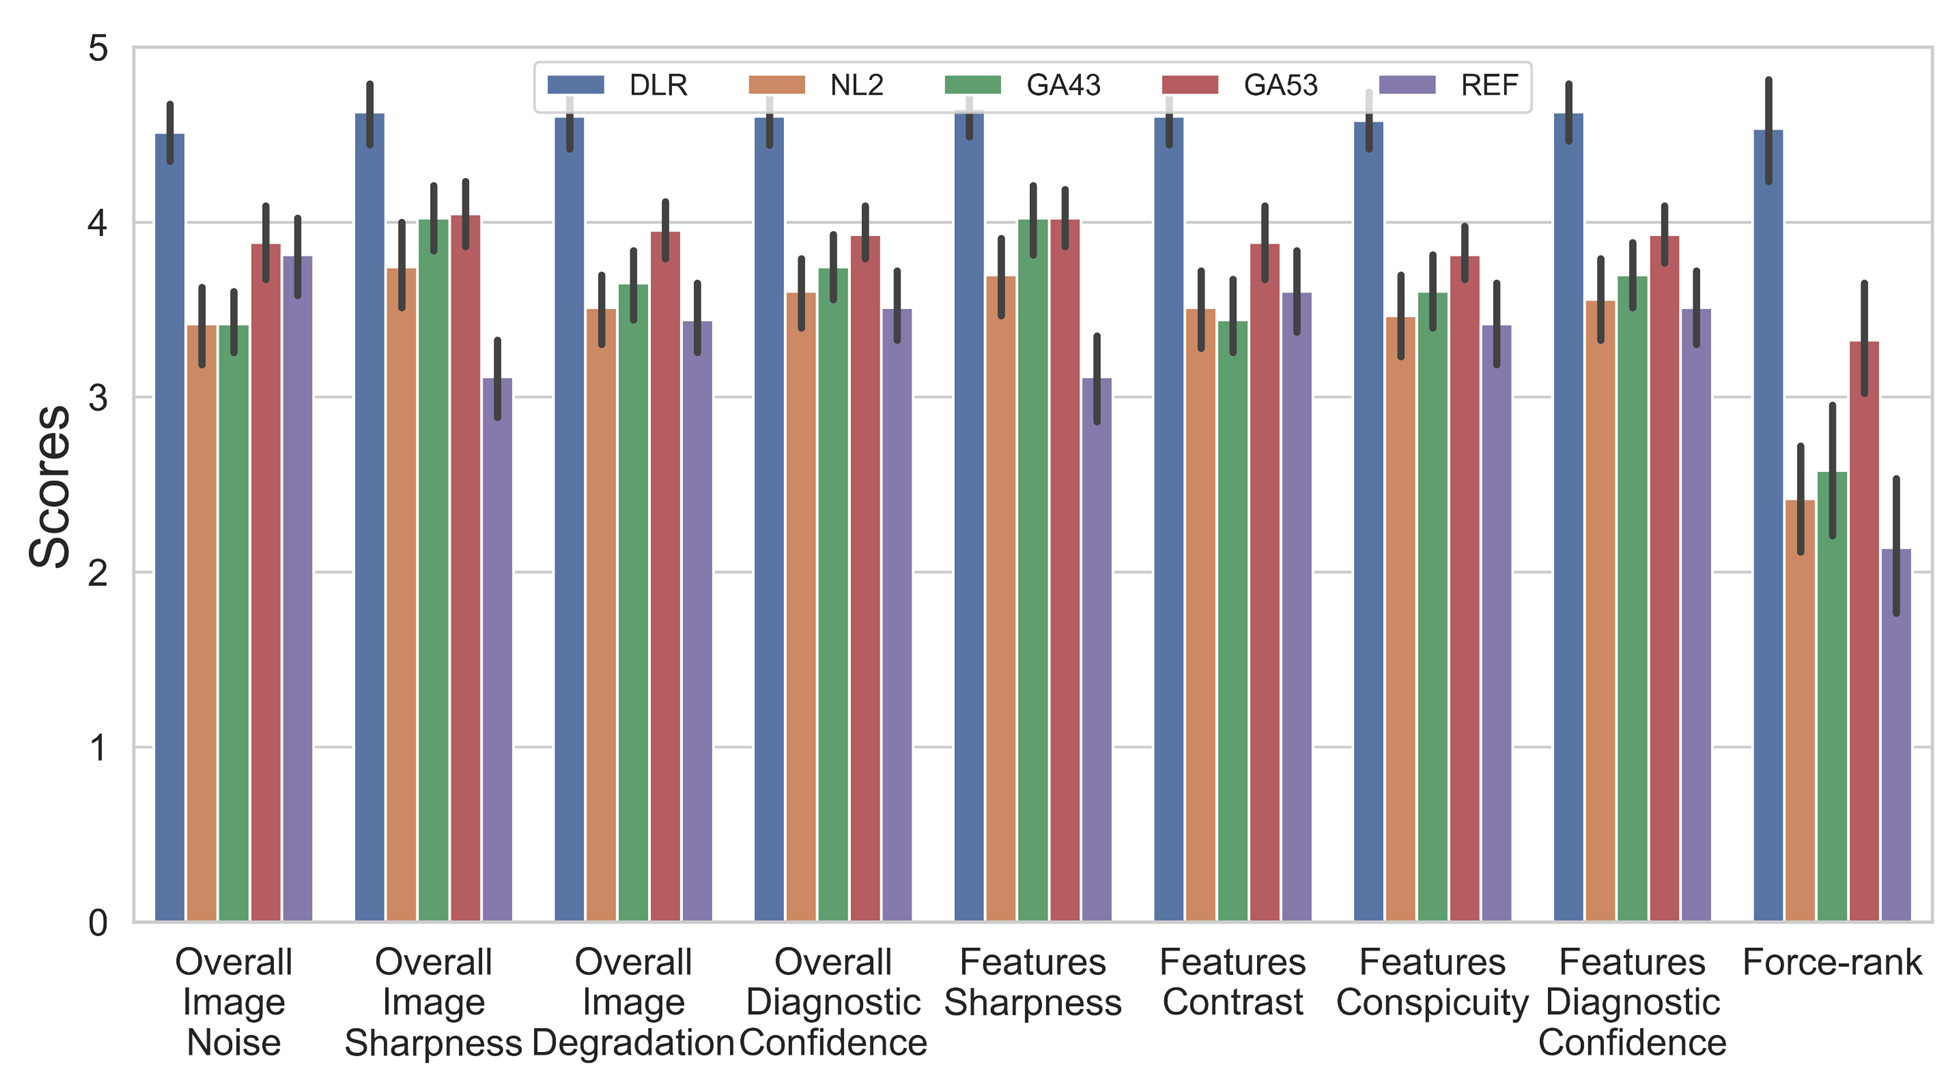
Average scan time was 172 ± 22 and 167 ± 20 seconds for REF and DLR (p = 0.10), respectively. (X, Y) resolutions were increased by (41%, 39%) from (269 ± 26, 192) to (380 ± 23, 266 ± 19) with p <0.001. SNR, CNR, and FWHM results are shown in Figure 3. DLR’s SNR and CNR was statistically higher than those from NL2, GA43, and GA53 (p < 0.001). There were no statistical difference for SNR/CNR between DLR and REF (p = 0. 049/0.13). DLR’s FWHM was statistically higher (i.e. higher resolution) than that of REF (p <0.001) and similar to those from NL2, GA43, and GA53 (p > 0.17).Figure 4 and 5 shows average scores for Reviewer 1 and 2, respectively. The Gwet’s Agreement Coefficient (AC2) for rater agreement assessment ranges from 0.79 to 0.88 (i.e. substantial or almost perfect) for 8 scoring criteria and 0.44 (i.e. moderate) for force-ranking. The Friedman test indicated that there were significant differences among the 5 reconstructions (p < 0.001) from both reviewers’ scores. For Reviewer 1, DLR was rated statistically higher (p < 0.001) than all 4 other reconstructions for all 9x4=36 comparisons. For reviewer 2, DLR was rated statistically higher (p < .001) than the REF for all 9 categories (8 scoring criteria + 1 force-ranking). DLR was rated statistically higher than NL2, GA43, GA53 in 6/9, 6/9, and 2/9 categories, respectively.
DISCUSSIONS AND CONCLUSIONS
This prospective study demonstrates that that Deep Learning Reconstruction enables the acquisition of MR images with increased resolution and image quality simultaneously without increasing scan time in studied sequences and anatomies.Acknowledgements
The authors would like to thank Catherine Bywaters, Robin Redman, Rob Stein, and Bruno Orellana for their assistance of this project.References
1. Kidoh M, et al. Deep Learning Based Noise Reduction for Brain MR Imaging: Tests on Phantoms and Healthy Volunteers. Magn Reson Med Sci doi:10.2463/mrms.mp.2019-0018
2. Isogawa K, et al. Noise level adaptive deep convolutional neural network for image denoising. Proceedings of ISMRM, Paris, 2018; 2797.
3. Shinoda K, et al. Deep Learning Based Adaptive Noise Reduction in Multi-Contrast MRI; ISMRM 2019 #4701
4. Cheng JY, Chen F, Sandino C, Mardani M, Pauly JM, Vasanawala SS. Compressed sensing: from research to clinical practice with data-driven learning. arXiv preprint arXiv:1903.07824. 2019 Mar 19.
5. Gwet KL: Handbook of Inter-Rater Reliability. The Definitive Guide to Measuring the Extent of Agreement Among Raters. 2nd edition. Gaithersburg, MD 20886–2696, USA: Advanced Analytics, LLC; 2010.
6. Gwet KL: Computing inter-rater reliability and its variance in the presence of high agreement. Br J Math Stat Psychol 2008, 61:29–48.
Figures