1771
Removing structured noise from dynamic arterial spin labeling images1Department of Computer Science, State University of New York at Binghamton, Binghamton, NY, United States, 2Department of Radiology, Beth Israel Deaconess Medical Center & Harvard Medical School, Boston, MA, United States
Synopsis
Dynamic arterial spin labeling (dASL) images showed the existence of large-scale structured noise, which violates the Gaussian assumptions of baseline functional imaging studies. Here, we evaluated the performance of two deep neural network (DNN) methods on removing the structured noise of ASL images, using the simulated data and real image data. The DNN model, with the noise structure learned and incorporated, demonstrates consistently improved performance compared to the DNN model without the explicitly incorporated noise structure. These results indicate that the noise structure incorporated DNN model is promising in removing the structured noise from the ASL functional images.
Introduction
Dynamic arterial spin labeling (dASL), acquiring a time series of ASL images, was shown with global fluctuations and RSN fluctuations [1, 2], which are the dominant structured noise in the statistical analysis of baseline ASL perfusion imaging. The existence of structured noise violates the assumed Gaussian-shape noise in the popular imaging statistical packages (such as SPM), challenging the validity of functional imaging studies. Recent work has demonstrated largely inflated false-positive rates for the statistical packages because of the ignored spatial dependency [3]. Recently, the deep neural network (DNN) methods have achieved very competitive performance in denoising natural images with unknown levels of Gaussian [4] and structured noise [5, 6]. However, their performance in removing noise from real functional images, in which large-scale structured noise exists, is not clear. Here, we evaluated the performance of two DNN methods on removing the structured noise of ASL images.Methods
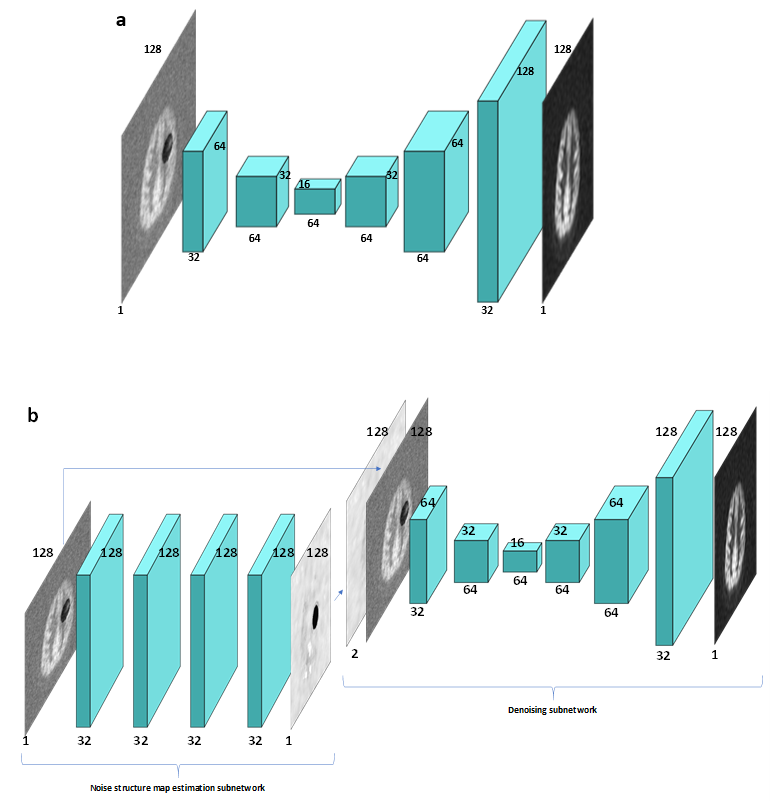
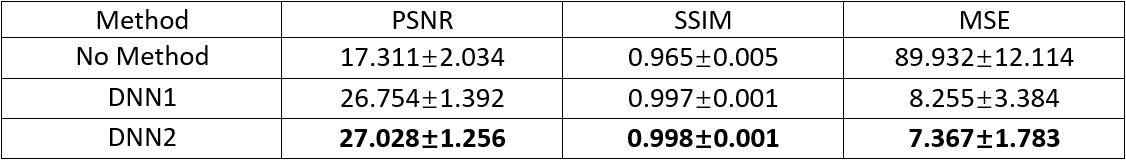
The 3D dASL images with 39 time points were acquired from 20 healthy subjects for a different project [1]. The performance of the two DNN methods was evaluated using the simulated ASL images with structured noise added and real dASL images. For simulating structured noise, the averaged 2D image axial slice from each subject was used as the ground-truth image. A circular shape of structured noise (with the signal that follows uniform distribution in the range of [-10%, 10%] of the maximum signal of the ground-truth image and in a random location inside the brain) and three levels of white noise (5%, 10%, and 15% of maximum signal) were added to a ground-truth image to simulate the noise-added images (39 simulated images for each subject). For real dASL images, the ground-truth image was considered as the mean image across 40 time points. Five-fold cross validation (16 subjects for training and 4 subjects for testing at each time) was used to evaluate the performance of denoised images. The performance of denoised images for each subject was evaluated by their PSNR and mean squared error (MSE) with the ground-truth image across 39 time points (for both simulated and real images) in each DNN method. The mean SSIM between denoised images and ground-truth images were also calculated for real dASL images. The DNN1 model that we built (Fig. 1a) was similar to the denoising convolutional neural network (DnCNN) [4] , which has 8 convolutional neural network (CNN) layers. The input image and output image are the noise-added image/real image with structured noise and denoised image. The DNN2 model that we built (Fig. 1b) was similar to the convolutional blind denoising network (CBDNet) with a noise estimation model [6]. In the DNN2 model, a noise estimation subnetwork (Left side of Fig. 1b) was built to learn the noise structure from the input image. The learned noise structure and corresponding noisy input image were input into the denoising subnetwork (Right side of Fig. 1b, same network architecture as the DNN1 except that the input image incorporated the self-learned noise structure map) to learn the denoised image. For both DNN1 and DNN2 models, we minimized the MSE loss between the denoised image and the ground-truth image.Results & Discussion
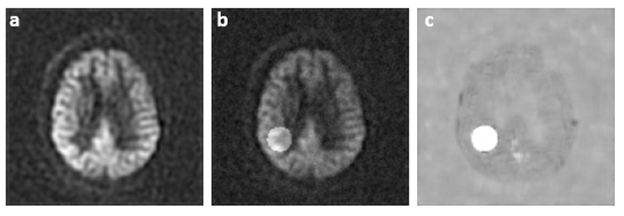
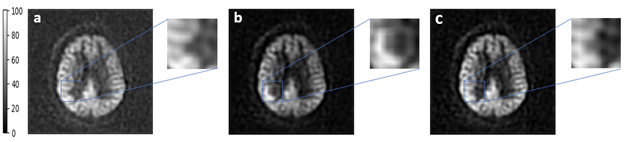
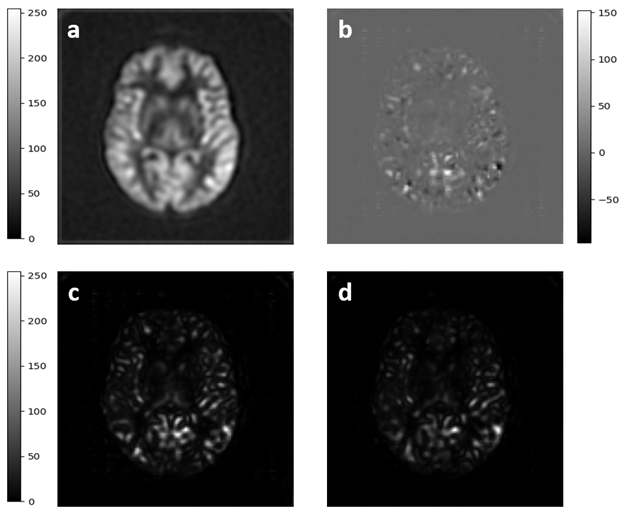
For the simulated images, an example of a ground-truth image (Fig. 2a), noise-added image (Fig. 2b), and learned noise structure (Fig. 2c) derived from the noise estimation subnetwork is shown. The results demonstrate that the noise estimation subnetwork can learn the noise structure successfully. The denoised image from the DNN1 model contains visible structured noise shapes (blue square box in Fig. 3b), while the DNN2 model successfully removes white noise and structured noise (Fig. 3c) from the denoised images. The enhanced denoising quality from the DNN2 benefits from the successfully learned noise structure. The PSNR and MSE, calculated in the noise-added locations across the testing dataset, are shown in Table 1. The PSNR and MSE from the DNN2 are consistently improved compared to those from the DNN1. For real imaging data, the mean squared error images from a representative subject are shown in Fig. 4c and Fig. 4d for the DNN1 and DNN2, respectively. The PSNR, MSE, and SSIM (Table 2) from the DNN2 are consistently improved compared to those from the DNN1. These results showed that the DNN2 model has improved performance in removing structured noise for the real ASL images, compared to the DNN1 model.Conclusion
The deep learning model DNN2, with the noise structure learned and incorporated, is promising in removing the structured noise from the ASL functional images. Further studies are warranted for its benefits in clinical investigations.Acknowledgements
No acknowledgement found.References
1. Dai W, Varma G, Scheidegger R, and Alsop DC, Quantifying fluctuations of resting state networks using arterial spin labeling perfusion MRI. J Cereb Blood Flow Metab, 2016;36(3):463-73.
2. Zhao L, Alsop DC, Detre JA, and Dai W, Global Fluctuations of Cerebral Blood Flow Indicate a Global Brain Network Independent of Systemic Factors. J Cereb Blood Flow Metab, 2019;39(2):302-312. 3. Eklund A, Nichols TE, and Knutsson H, Cluster failure: Why fMRI inferences for spatial extent have inflated false-positive rates. Proc Natl Acad Sci U S A, 2016;113(28):7900-5.
4. Zhang K, Zuo W, Chen Y, Meng D, and Zhang L, Beyond a Gaussian Denoiser: Residual Learning of Deep CNN for Image Denoising. IEEE Trans Image Process, 2017;26(7):3142-3155.
5. Zhang K, Zuo W, and Zhang L, FFDNet: Toward a fast and felxible solution for CNN based image denoising. IEEE Trans Image Process, 2018;In Press.
6. Guo S, Yan Z, Zhang K, Zuo W, and Zhang L, Toward Convolutional Blind Denoising of Real Photographs. 2019 IEEE/CVF Conference on Computer Vision and Pattern Recognition (CVPR), 2019.
Figures