1770
A Marriage of Subspace Modeling with Deep Learning to Enable High-Resolution Dynamic Deuterium MR Spectroscopic Imaging1Department of Electrical and Computer Engineering, University of Illinois at Urbana-Champaign, Urbana, IL, United States, 2Beckman Institute for Advanced Science and Technology, University of Illinois at Urbana-Champaign, Urbana, IL, United States, 3Center for Magnetic Resonance Research, University of Minnesota, Minneapolis, MN, United States, 4Department of Neurosurgery, University of Minnesota, Minneapolis, MN, United States
Synopsis
Dynamic deuterium MR spectroscopic imaging (DMRSI) is a powerful metabolic imaging method, with great potential for tumor imaging. However, current DMRSI applications are limited to low spatiotemporal resolutions due to low sensitivity. This work overcomes this issue using a machine learning-based method. The proposed method integrates subspace modeling with deep learning to effectively use prior information for sensitivity enhancement and thus enables high-resolution dynamic DMRSI. Experimental results have been obtained from rats with and without brain tumor, which demonstrate that we can obtain dynamic metabolic changes with unprecedented spatiotemporal resolutions.
Introduction
Dynamic deuterium MR spectroscopic imaging (DMRSI) is a potentially powerful tool for quantitative metabolic imaging and has shown promise for imaging brain tumors.1-3 To characterize the metabolic kinetics of tissue and focal lesions, high-resolution imaging capability is essential, e.g., 10 μL spatial and 1-10 min temporal resolutions are often required to capture the spatiotemporal heterogeneity of brain tumors in animal studies. However, due to the inherently low sensitivity of DMRSI, current imaging applications are limited by either low spatial resolution or steady-state imaging measurement with many signal averages.1-5 In this work, we overcome this issue using a machine learning (ML) based method that effectively utilizes physics-based and data-driven prior information for sensitivity enhancement, thereby making high-resolution dynamic DMRSI possible. The proposed method has been evaluated in both simulation and in vivo experiments, showing that spatially resolved cerebral metabolic dynamics were successfully obtained at unprecedented resolution (~10 μL spatial, 105 sec temporal).Methods
Probabilistic Subspace ModelWe propose a probabilistic subspace model to represent the desired spatial-spectral-temporal function of $$$L$$$ 2H-labelled molecules:
$$\hspace{10em}\rho(\boldsymbol{x},f,T)=\sum_{\ell=1}^{L}\rho_{\ell}(\boldsymbol{x},f,T)\hspace{10em}\\\hspace{7.5em}=\sum_{\ell=1}^{L}\rho_{\ell}\phi_{\ell}(\boldsymbol{x},f)\varphi_{\ell}(\boldsymbol{x},T)\\\hspace{22em}=\sum_{\ell=1}^{L}\left\{\sum_{r=1}^{R_{\ell}}c_{r,\ell}(\boldsymbol{x})\phi_{r,\ell}(f)\right\}\left\{\sum_{q=1}^{Q_{\ell}}a_{q,\ell}(\boldsymbol{x})\varphi_{q,\ell}(T)\right\}\hspace{3em}[1]$$
where the coefficients are assumed to follow distributions:
$$\hspace{12.5em}c_{r,\ell}(\boldsymbol{x})\sim\text{Pr}\left(\left\{c_{r,\ell}\right\}\right)\quad\text{and}\quad{a_{q,\ell}(\boldsymbol{x})\sim\text{Pr}}\left(\left\{a_{q,\ell}\right\}\right)\hspace{12.5em}[2]$$
The proposed model explicitly exploits the partial separability of MRSI data6 and expresses the spectral-temporal, spatial-spectral, and spatial-temporal distributions by rank-1, rank-$$$R_{\ell}$$$, and rank-$$$Q_{\ell}$$$ subspaces, respectively. As a result, the overall function $$$\rho(\boldsymbol{x},f,T)$$$ resides in a union-of-subspaces with a significantly reduced degrees-of-freedom as compared to conventional Fourier series model. Our model also imposes statistical distributions on the model coefficients to further constrain the signal variations allowed, thus providing additional sensitivity gain.
Subspace-Based Spectral Denoising
In the proposed model, the spectral distribution of each molecule is represented by a low-dimensional subspace spanned by $$$\{\phi_{r,\ell}(f)\}$$$. This representation enables effective use of both physics and data-driven priors for spectral denoising. Particularly, in construction of $$$\{\phi_{r,\ell}(f)\}$$$, we absorbed physics-based prior knowledge which includes the known resonance structures; we also incorporated spectral lineshape functions of each molecule obtained from training data. With $$$\{\phi_{r,\ell}(f)\}$$$ determined, we performed spectral denoising by further imposing prior distributions (obtained from training data) on the model coefficients $$$\{c_{r,\ell}\}$$$ via the Bayesian statistical framework.
Machine Learning-Based Temporal Denoising
The temporal variations were denoised using deep learning. In this work, four U-Net-based neural networks were built,7 one for each observable molecules (i.e., water, Glc: glucose, Glx: mixed glutamate/glutamine, and Lac: lactate); these networks took noisy time courses (obtained after spectral denoising) as input and produced denoised time courses. Then, we treated them as prior signals and absorbed them to constrain the temporal reconstruction via a regularization functional:
$$\hspace{7.5em}\bar{\varphi}_{\ell}(\boldsymbol{x},T)=\text{arg}\min_{\varphi_{\ell}(\boldsymbol{x},T)}\left\lVert\hat{\varphi}_{\ell}(\boldsymbol{x},T)-\varphi_{\ell}(\boldsymbol{x},T)\right\rVert_2^2+\lambda_{T}\left\lVert\varphi_{\ell}(\boldsymbol{x},T)-\tilde{\varphi}_{\ell}(\boldsymbol{x},T)\right\rVert_2^2\hspace{7.5em}[3]$$
where $$$\hat{\varphi}_{\ell}(\boldsymbol{x},T)$$$ is the outcome of spectral denoising, and $$$\tilde{\varphi}_{\ell}(\boldsymbol{x},T)$$$ from denoising network. This step effectively absorbs the ML-based prior signals (via the 2nd term) while also preserves data consistency (via the 1st term).
Estimation of the Spatial-Spectral-Temporal Functions
After both spectral and temporal denoising of the measured data, the final spatial-spectral-temporal functions were determined by fitting Eq. [1] to the denoised data with some weak spatial constraints. The weak spatial constraints were in the form of empirical distributions $$$\text{Pr}\left(\left\{c_{r,\ell}\right\}\right)$$$ and $$$\text{Pr}\left(\left\{a_{q,\ell}\right\}\right)$$$, derived from the model coefficients at different imaging voxels obtained after denoising. The desired spatial-spectral-temporal functions were then obtained by maximum a posterior (MAP) estimation:
$$\hspace{1.5em}\min_{\{c_{r,\ell}\},\{a_{q,\ell}\}}\left\lVert\bar{\rho}(\boldsymbol{x},f,T)-\sum_{\ell=1}^{L}\left\{\sum_{r=1}^{R_{\ell}}c_{r,\ell}(\boldsymbol{x})\phi_{r,\ell}(f)\right\}\left\{\sum_{q=1}^{Q_{\ell}}a_{q,\ell}(\boldsymbol{x})\varphi_{q,\ell}(T)\right\}\right\rVert_2^2-\lambda\log\left(\text{Pr}\left(\left\{c_{r,\ell}\right\}\right)\text{Pr}\left(\left\{a_{q,\ell}\right\}\right)\right)\hspace{1.5em}[4]$$
Results
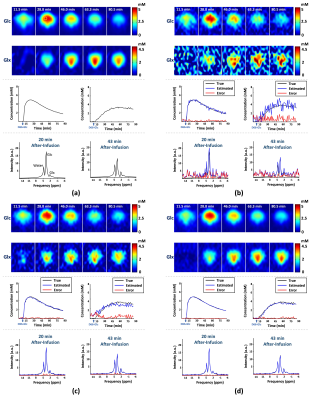
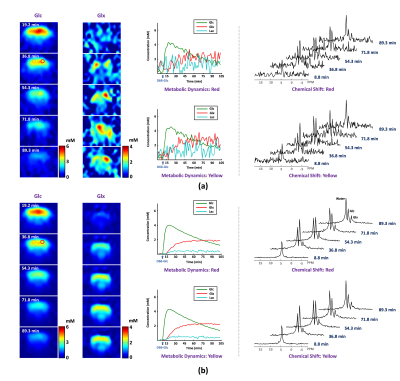
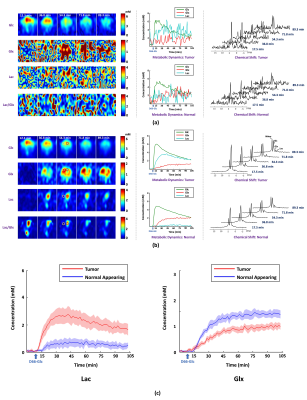
In vivo DMRSI data were collected from rats at a 16.4T scanner (Varian/VNMRJ) before and after an infusion of deuterated glucose. All data were acquired using the 3D-CSI sequence with TR=45 ms and FOV=2.8×2.8×2.4 cm3. For training data, we collected 9×9×5 phase encodings with 80 dynamic volumes (69 sec/volume). For high-resolution but low-SNR data, we acquired 17×17×5 phase encodings with 60 dynamic volumes (105 sec/volume).The proposed method has been evaluated in both simulation and in vivo experiments. For simulation, numerical phantom was generated based on a high-SNR training dataset with random noise. As a benchmark, we compared our method with Fourier-based method and rank-reduction-based denoising. As shown in Fig. 1, our method produced the most accurate quantification results with significantly less temporal signal fluctuations, especially for the low-concentration metabolites (e.g., Glx). We have also compared with the direct outcomes from denoising networks. As shown in Fig. 2, while the neural networks can significantly reduce the spatial and temporal signal fluctuations, it introduced a noticeable bias (especially for Glx), which is undesirable for subsequent kinetic analysis. We have also evaluated our method using in vivo data. Figure 3 shows the results obtained from one healthy rat. As can be seen, the proposed method significantly reduced the noise-induced fluctuations of key molecules, consistent to the simulation study. To demonstrate the translational utility and potential, we applied the proposed method to brain tumor imaging, with the results summarized in Fig. 4. As can be seen, using the proposed method, we clearly captured the Warburg Effect showing a much higher ratio of deuterated Lac and Glx in the tumor as compared to normal-appearing brain tissue, while the conventional scheme completely overlooked the tumor.
Conclusions
This work presents a new learning-based method for high-resolution dynamic DMRSI. The proposed method overcomes the low-sensitivity issue by synergistically integrating subspace modeling and deep learning. This method is expected to be useful for applications involving dynamic DMRSI, in particular, for imaging the Warburg effect in tumors.Acknowledgements
This work was supported in part by NIH grants R21-EB023413, R01-CA240953, U01-EB026978, R01-MH111413, P30-NS076408 and P41-EB027061.References
[1] Lu M, Zhu X-H, Zhang Y, et al. Quantitative assessment of brain glucose metabolic rates using in vivo deuterium magnetic resonance spectroscopy. J. Cereb. Blood Flow Metab. 2017;37(11):3518-3530.
[2] Zhu X-H, Lu M, Chen W. Quantitative imaging of brain energy metabolisms and neuroenergetics using in vivo X-nuclear 2H, 17O and 31P MRS at ultra-high field. J. Magn. Reson. 2018;292:155–170.
[3] De Feyter HM, Behar KL, Corbin ZA, et al. Deuterium metabolic imaging (DMI) for MRI-based 3D mapping of metabolism in vivo. Sci. Adv. 2018;4:1–11.
[4] Kreis F, Wright AJ, Hesse F, et al. Measuring tumor glycolytic flux in vivo by using fast deuterium MRI. Radiology 2020;294:289–296.
[5] Riis-Vestergaard MJ, Laustsen C, Mariager, CØ, et al. Glucose metabolism in brown adipose tissue determined by deuterium metabolic imaging in rats. Int. J. Obes. 2020;44:1417–1427.
[6] Liang ZP. Spatiotemporal imaging with partially separable functions in In Proc. IEEE. Int. Symp. Biomed. Imag., (2007), pp. 988–991
[7] Ronneberger O, Fischer P, Brox T. U-net: Convolutional networks for biomedical image segmentation in Proc. Int. Conf. Medical Image Comput. Comput.-Assisted Intervention, (2015), pp. 234–241.
Figures


