1769
Improving Deep Learning MRI Super-Resolution for Quantitative Susceptibility Mapping
Antoine Moevus1,2, Mathieu Dehaes2,3,4, and Benjamin De Leener1,2,4
1Departement of Computer and Software Engineering, Polytechnique Montréal, Montréal, QC, Canada, 2Institute of Biomedical Engineering, University of Montreal, Montréal, QC, Canada, 3Department of Radiology, Radio-oncology, and Nuclear Medicine, Université de Montréal, Montréal, QC, Canada, 4Research Center, Ste-Justine Hospital University Centre, Montreal, QC, Canada
1Departement of Computer and Software Engineering, Polytechnique Montréal, Montréal, QC, Canada, 2Institute of Biomedical Engineering, University of Montreal, Montréal, QC, Canada, 3Department of Radiology, Radio-oncology, and Nuclear Medicine, Université de Montréal, Montréal, QC, Canada, 4Research Center, Ste-Justine Hospital University Centre, Montreal, QC, Canada
Synopsis
In this preliminary work, we are exploring the application of deep learning (DL) super-resolution techniques to improve quantitative susceptibility maps (QSM). We trained a light deep learning neural network on the QSM data from the AHEAD dataset. We studied different variants of the mean squared error (MSE) as loss functions and two different training strategies : cyclic learning rate and an adaptive learning rate. We found that the cyclic learning rate yielded better results in general if correctly optimized with the learning rate finder algorithm.
Introduction
Quantitative Susceptibility Mapping (QSM) enables the detection of several biomarkers in the brain including cerebral metabolic rate of oxygen (CMRO2), calcification, demyelination, and other magnetic susceptibility properties. In QSM, image reconstruction is an ill-posed problem and artifacts due to numerical imprecision can occur, which may lead to misleading interpretations. In this work, we hypothesized that artifacts and imprecision can be reduced by using super-resolution (SR) algorithms that are applied to QSM data. To address this hypothesis, we trained a convolutional neural network using specific loss functions that were based on the mean square error (MSE). In particular, we used a loss MSE based on the entire image, specifically on the brain, or with a linear combination of the two previous approaches as well as specific training techniques including a stochastic gradient descent (SGD) with a cyclic learning rate, and a SGD with adaptive learning rate.1Methods
Datasets. We used the Amsterdam ultra-high field adult lifespan database (AHEAD) that includes 105 whole-brain structural MRI acquired at 7T in both male (43%) and female (57%) participants from 19-80 years of age.2 First, we selected all the 105 whole-brain QSM images and resampled them from 0.64x0.64x0.7mm to 1x1x0.7mm resolution. Then, we kept 1% of the 2D empty slices to keep the dataset balanced. For each slice, we generated an input-target pair consisting of a downsampled image with a linear interpolation and the corresponding high-resolution image (groundtruth) leading to a dataset of 19010 pairs of low- and high-resolution images.Model training. Slices were grouped in three sets: training (to optimize model parameters), validation (for hyperparameters tuning), and test (to evaluate the models) with slices ratios of 70%, 10%, and 20%. The architecture was based on a fast super resolution convolutional neural network (FSRCNN) as it previously showed improved performances compared to similar approaches with ~5x fewer number of parameters.3 The model was fed with either the entire image. It was trained with a batch size of 10 slices and a total of 500 epochs. We used the SGD optimizer with two types of learning rate (LR) scheduler: (1) a triangular cyclic LR, and (2) an adaptive LR that was initialized with the ADAM optimizer4 for 10 epochs and then switched to a SGD with an adaptive LR. The adaptive LR was set to be reduced by 10% if the loss stagnates for 5 epochs.1 For the triangular cyclic LR, specific experiments were conducted through MSE variants: Whole image MSE (WIMSE), Brain region MSE (BRMSE), and Blended MSE: 95% brain region MSE + 5% whole image MSE. In order to obtain the brain region, we used the brain mask from the high-resolution image. Optimal learning rates were obtained using the learning finder algorithm5 for each specific loss function to ensure optimal parameters optimization.
Model performance. The final step was to assess the performance of the model by evaluating the MSE and SSIM (structural similarity index measure)6 on the entire test dataset (3967 slices) using the whole image, or only the brain region. A paired t-test was used to evaluate the performance of the learning strategies with a statistical significance of 0.05.
Results
Table 1 shows comparisons between models performance using the MSE and SSIM metrics. The performance of the cyclic LR WIMSE was higher than the other models when using the entire images as inputs. For brain region inputs, the performance of the cyclic LR BRMSE was slightly higher than the other models, and was tied with the cyclic LR Blend MSE when assessed by the SSIM.Figure 1 and 2 show the errors distributions on the test set for the brain MSE and the brain SSIM for selected models and the downsampled data compared to the ground truth. For all the cyclic LR error distribution, when compared to the downsample one, the results of the paired t-test significantly reject the hypothesis of equal average. For the adaptive LR, the null hypothesis was not rejected.
Table 2 shows the p-value scores for each error distribution. The error distributions were not significantly different for the cyclic LR when compared to each other, but it was for the adaptive LR.
Figure 3 shows the input, the inferences, and the ground truth (high resolution image) for different models on the whole image and zoomed regions. The best results were obtained with the cyclic LR WIMSE model.
Discussion and Conclusion
In this study, we evaluated different super-resolution models on quantitative susceptibility mapping data. The results demonstrated the capacity of deep learning models to successfully improve the quality of QSM data. We also demonstrated that training neural networks for super-resolution requires proper learning rate adaptation, as well as choosing the right evaluation metric (Figures 1-3). In this study, we investigated the different training approaches with a lightweight neural network model while the performance of the superresolution algorithm might improve significantly with more complex models. Future work will include the evaluation of U-Nets and Attention Based CNN as well as evaluating the capacity of deep learning to perform multi-level superresolution in a single model.Acknowledgements
This study was supported by Polytechnique Montréal, by the Canada First Research Excellence Fund, by the TransMedTech Institute, by the Institut de valorisation des données (IVADO), by the Fonds de recherche du Québec – Nature et technologies (FRQNT).References
- Tax CM, Grussu F, Kaden E, et al. Cross-scanner and cross-protocol diffusion MRI data harmonisation: A benchmark database and evaluation of algorithms. Neuroimage 2019; 195: 285–99.
- Alkemade A, Mulder MJ, Groot JM, et al. The Amsterdam Ultra-high field adult lifespan database (AHEAD): A freely available multimodal 7 Tesla submillimeter magnetic resonance imaging database. Neuroimage 2020; 221: 117200.
- Dong C, Loy CC, Tang X. Accelerating the Super-Resolution Convolutional Neural Network. arXiv [cs.CV]. 2016; published online Aug 1. http://arxiv.org/abs/1608.00367.
- Kingma DP, Ba J. Adam: A Method for Stochastic Optimization. arXiv [cs.LG]. 2014; published online Dec 22. http://arxiv.org/abs/1412.6980.
- Smith LN. Cyclical Learning Rates for Training Neural Networks. arXiv [cs.CV]. 2015; published online June 3. http://arxiv.org/abs/1506.01186.
- Zhou Wang, Bovik AC, Sheikh HR, Simoncelli EP. Image quality assessment: from error visibility to structural similarity. IEEE Trans Image Process 2004; 13: 600–12.
Figures
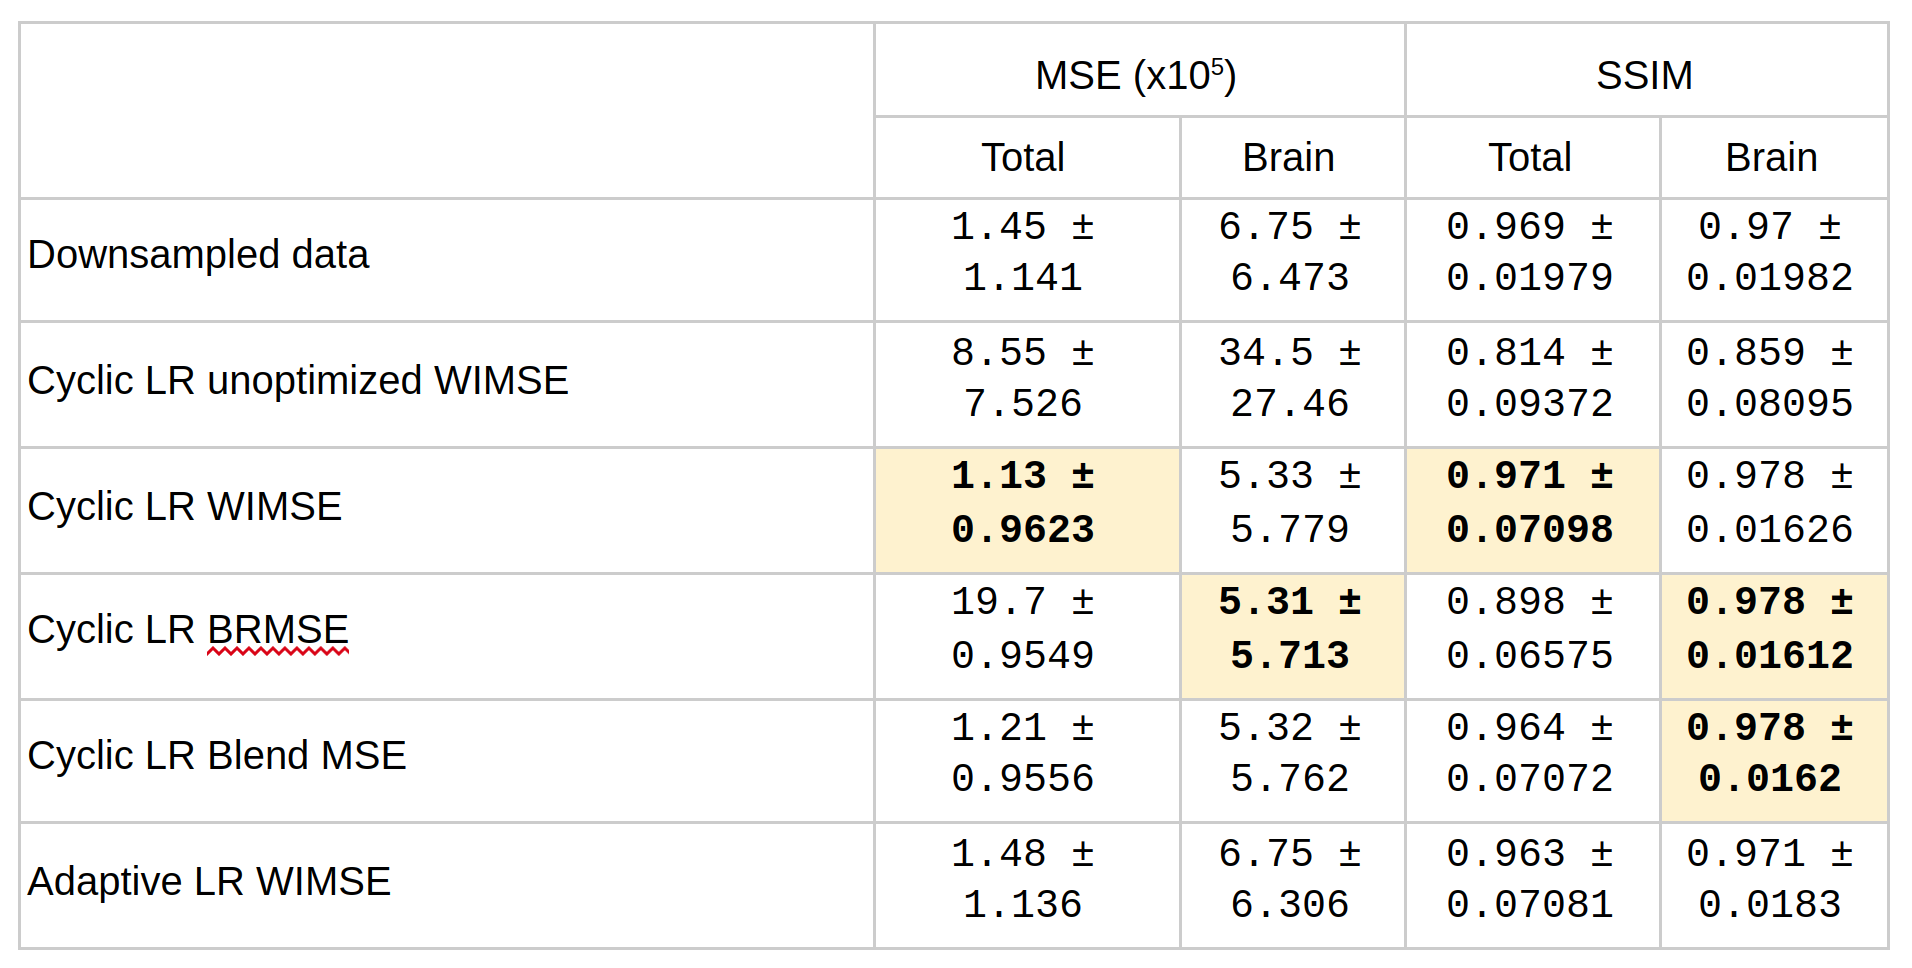
Table 1 - Comparison of models performance using the MSE and SSIM metrics. MSE: low score refers to high performance, SSIM: high score refers to high performance. Best performances are highlighted.
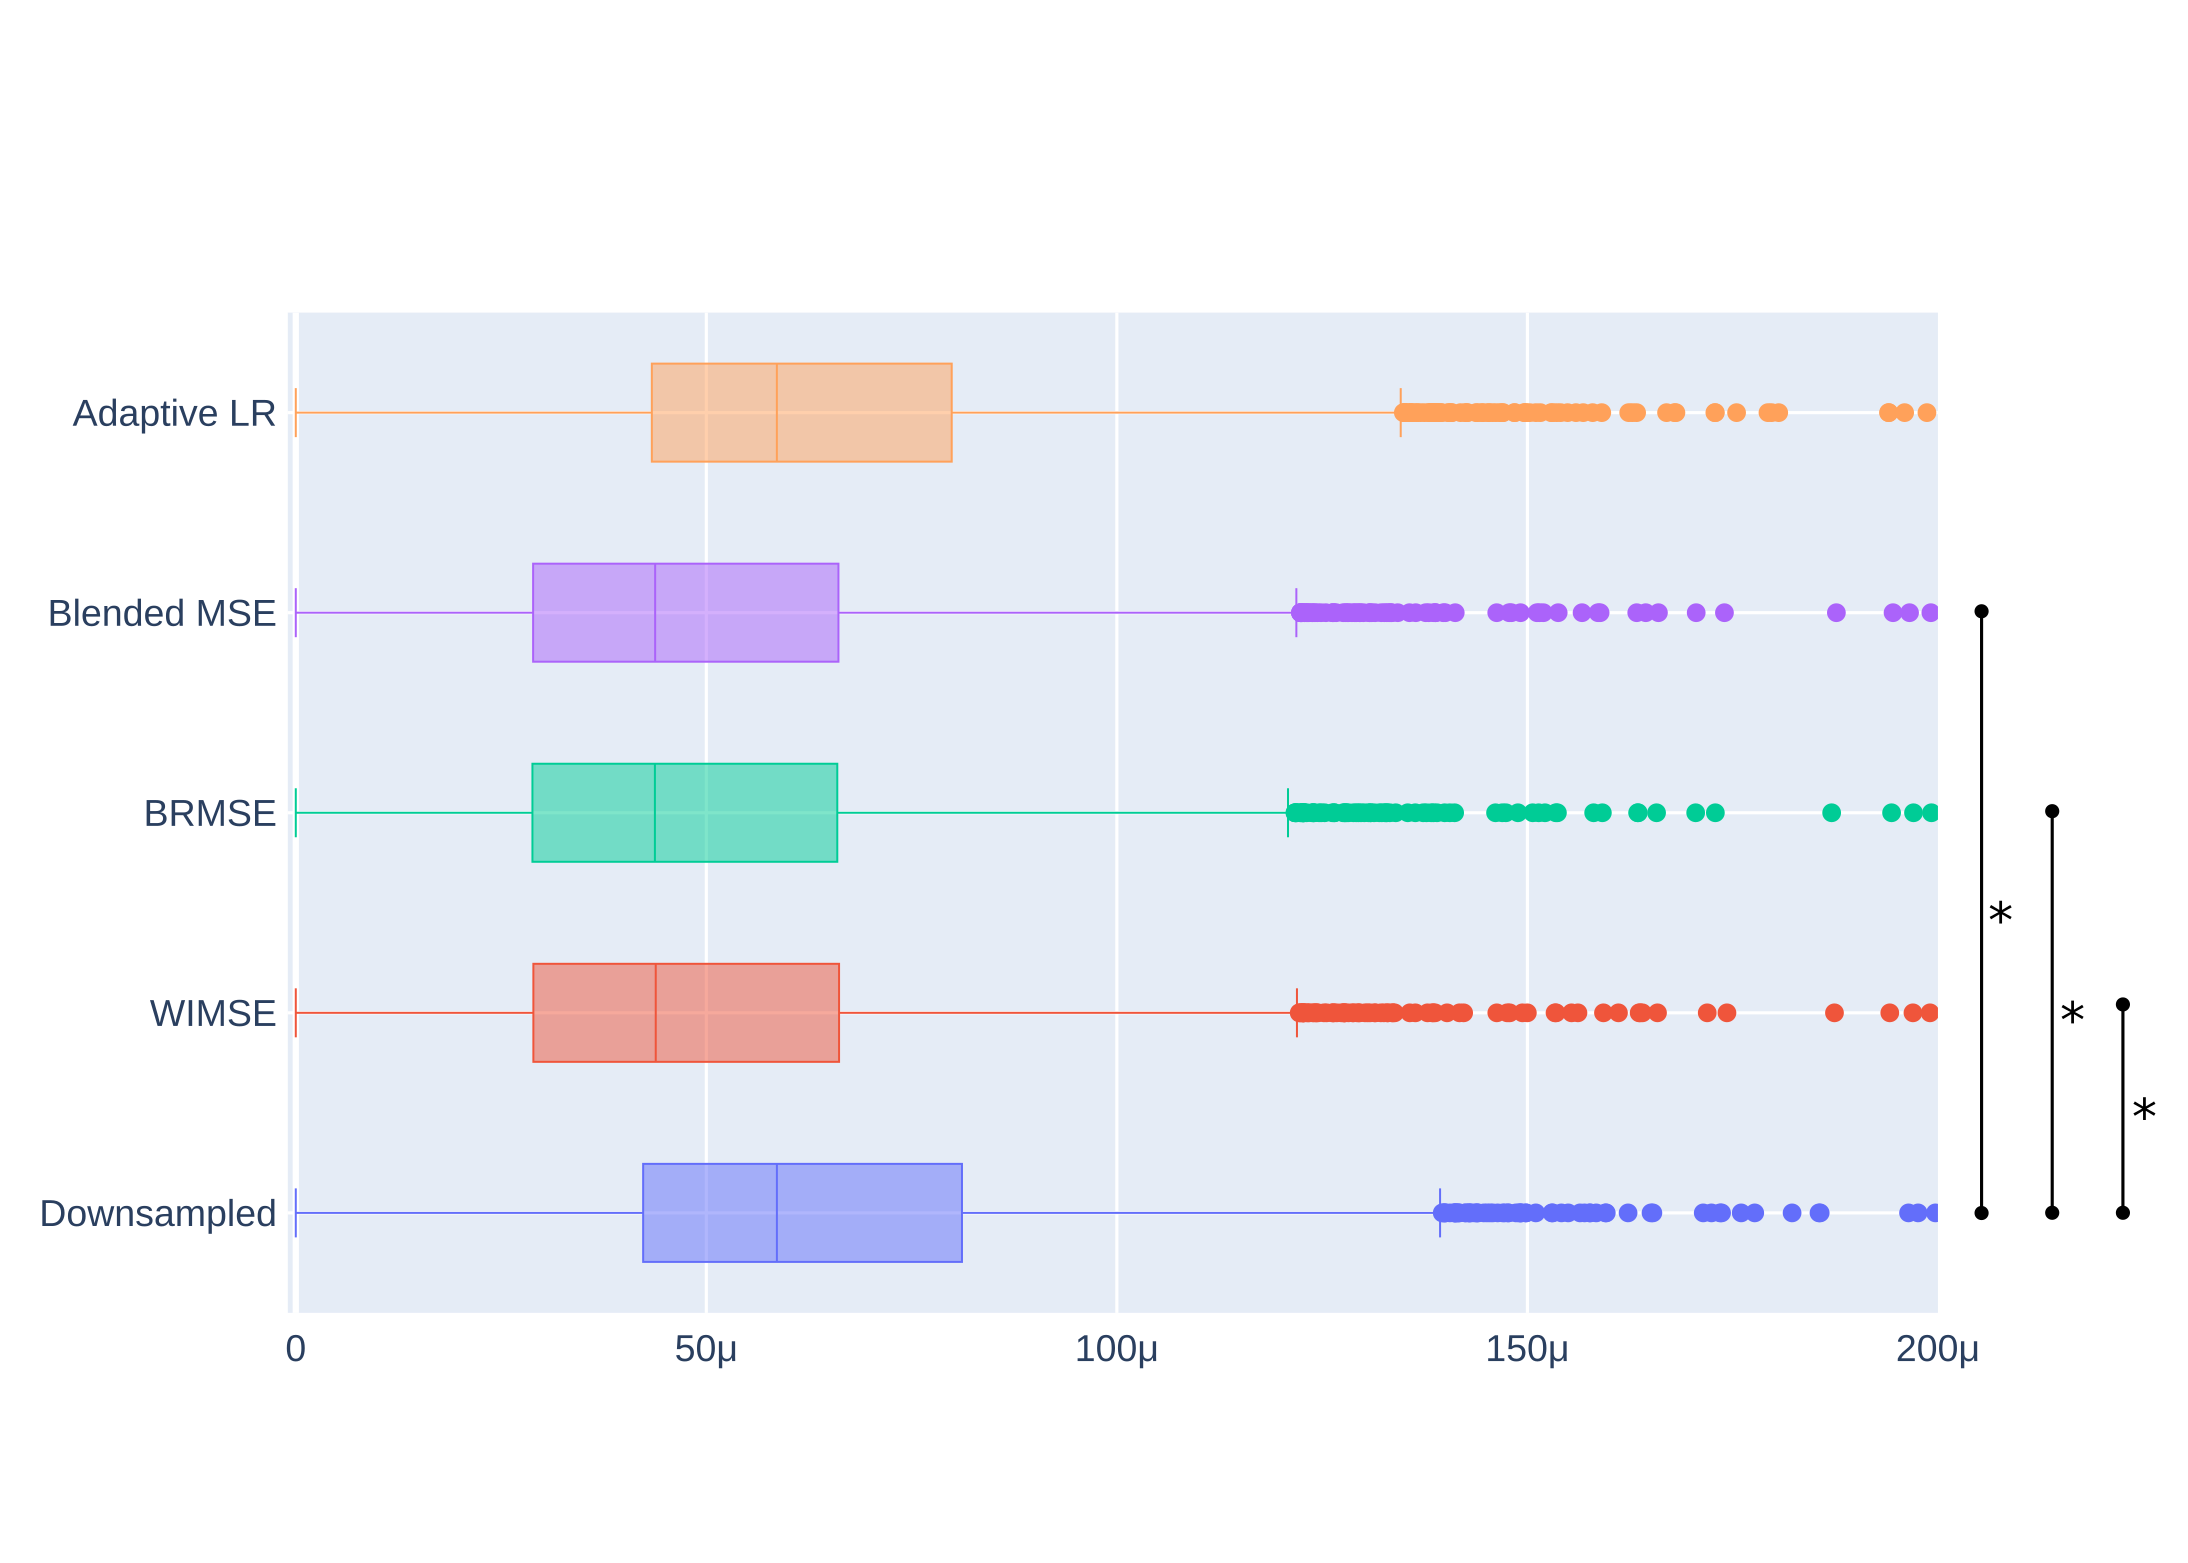
Figure 1 - Brain MSE distributions for the evaluation compared to the ground truth The starred lines represent the results of the paired t-test that significantly rejects the hypothesis of equal average of a model compared to the downsample data. The images was cropped to reject around a dozen of outliers.
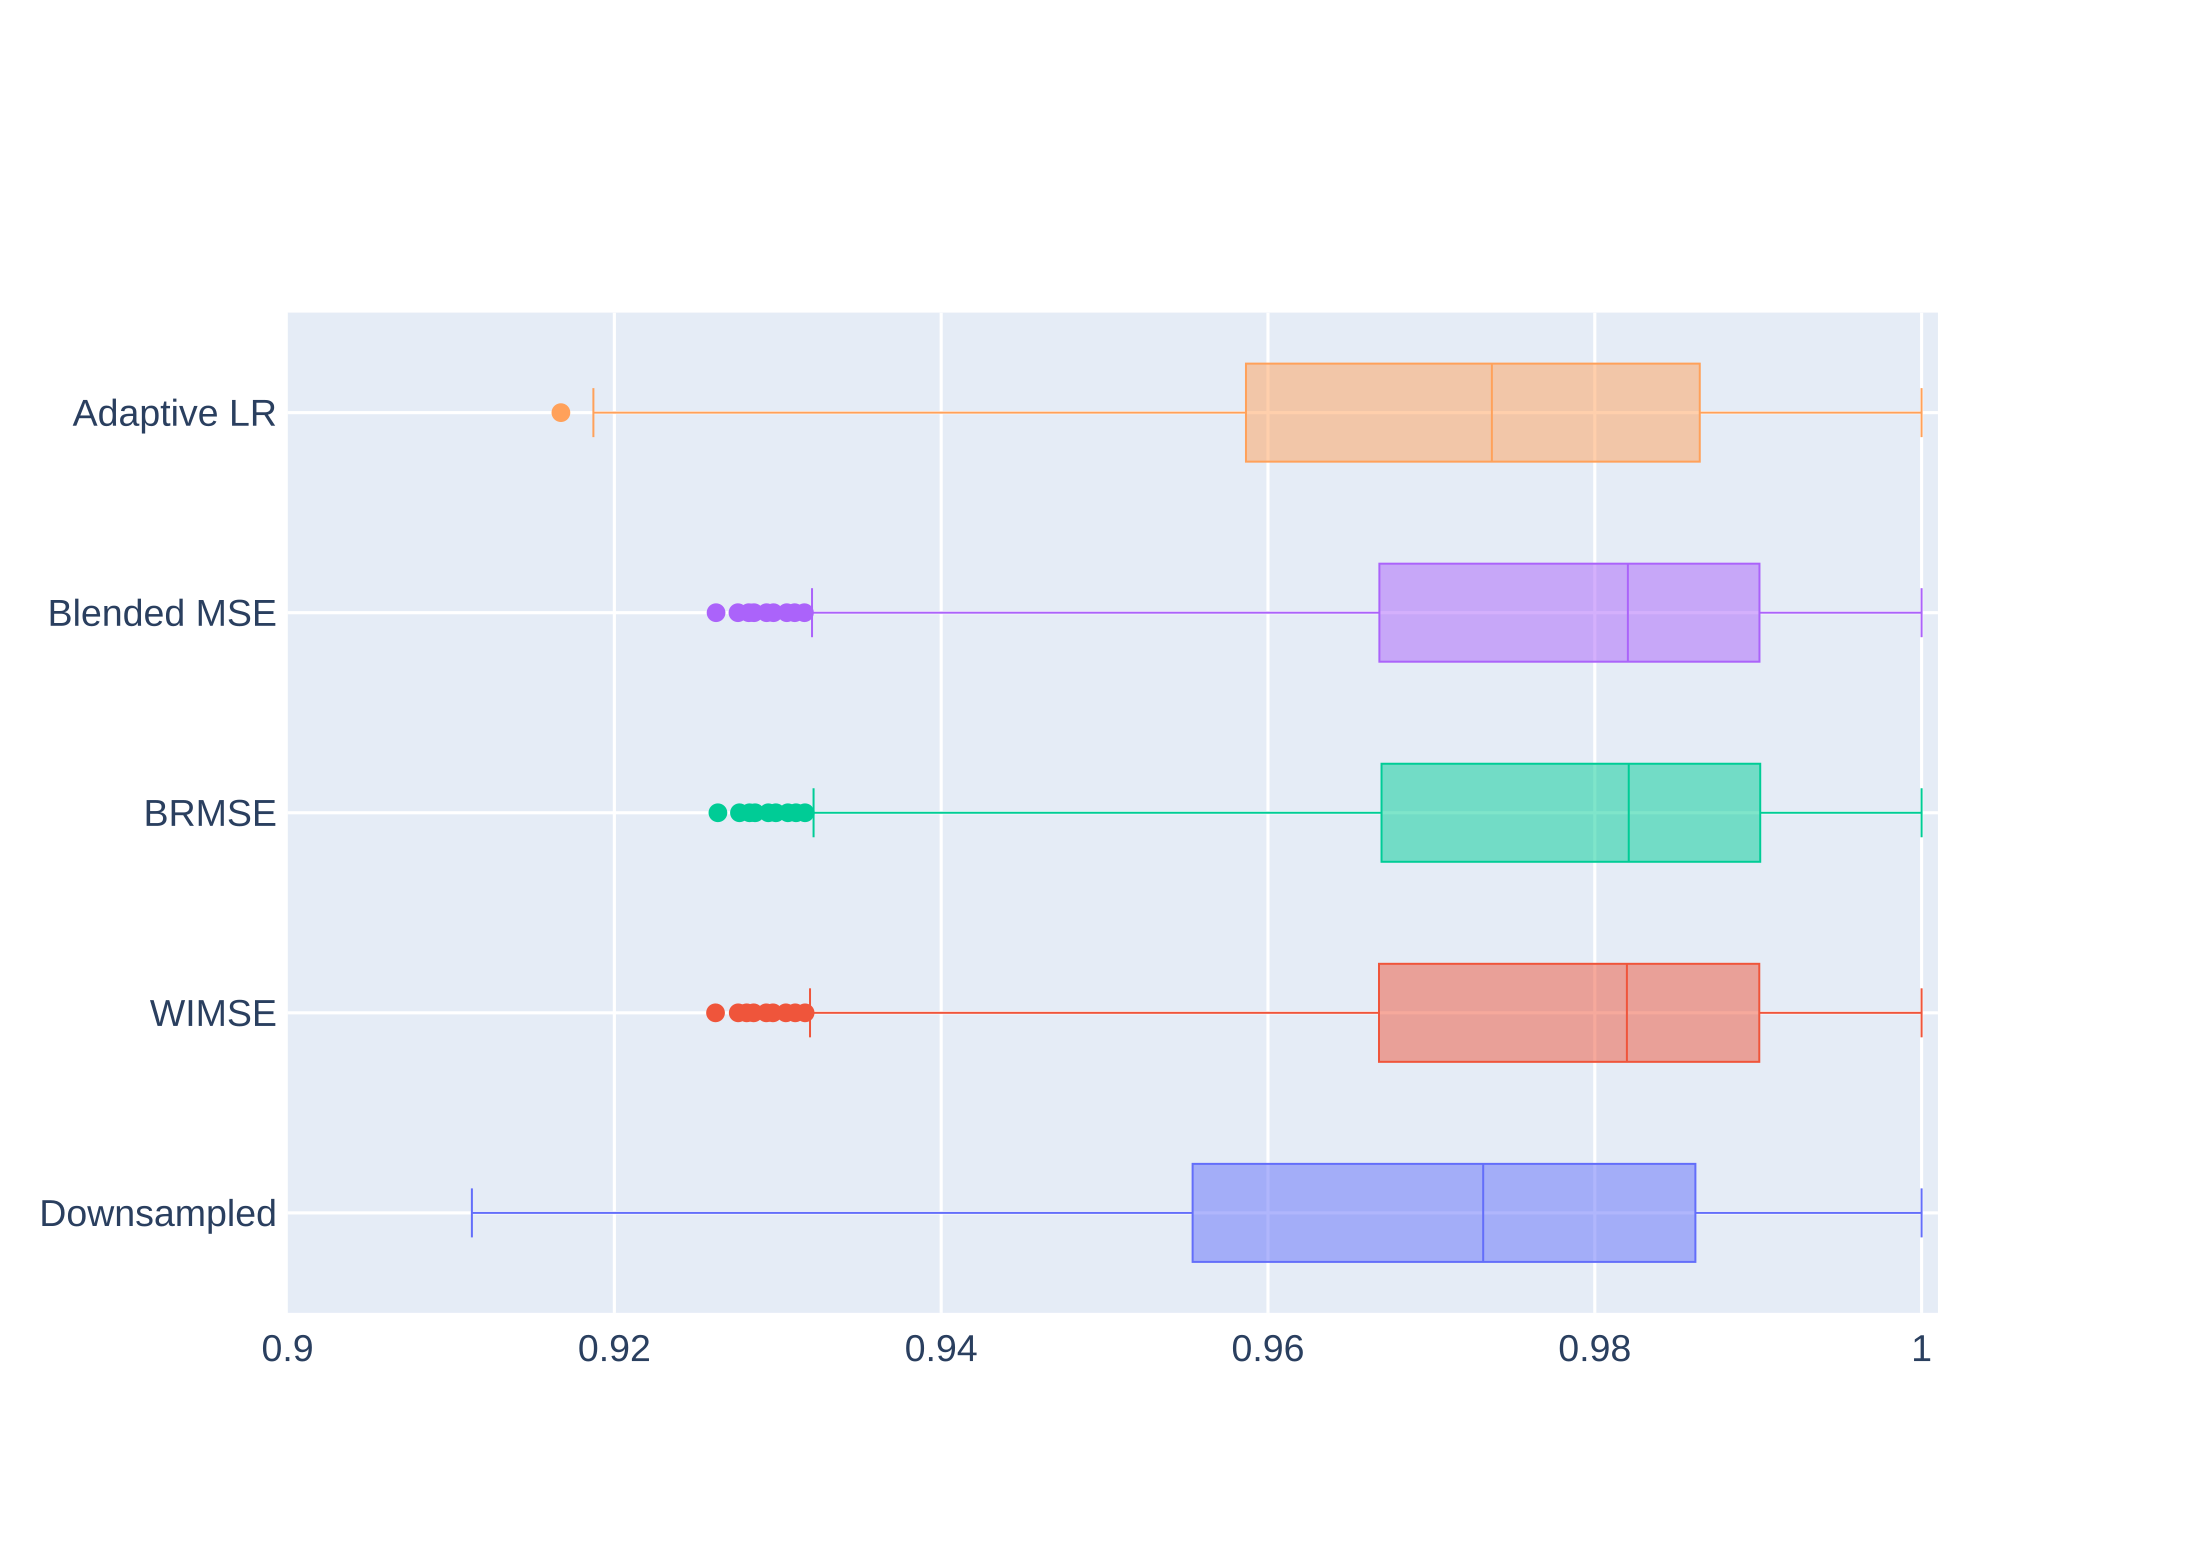
Figure 2 - Brain SSIM distributions for the evaluation compared to the ground truth.
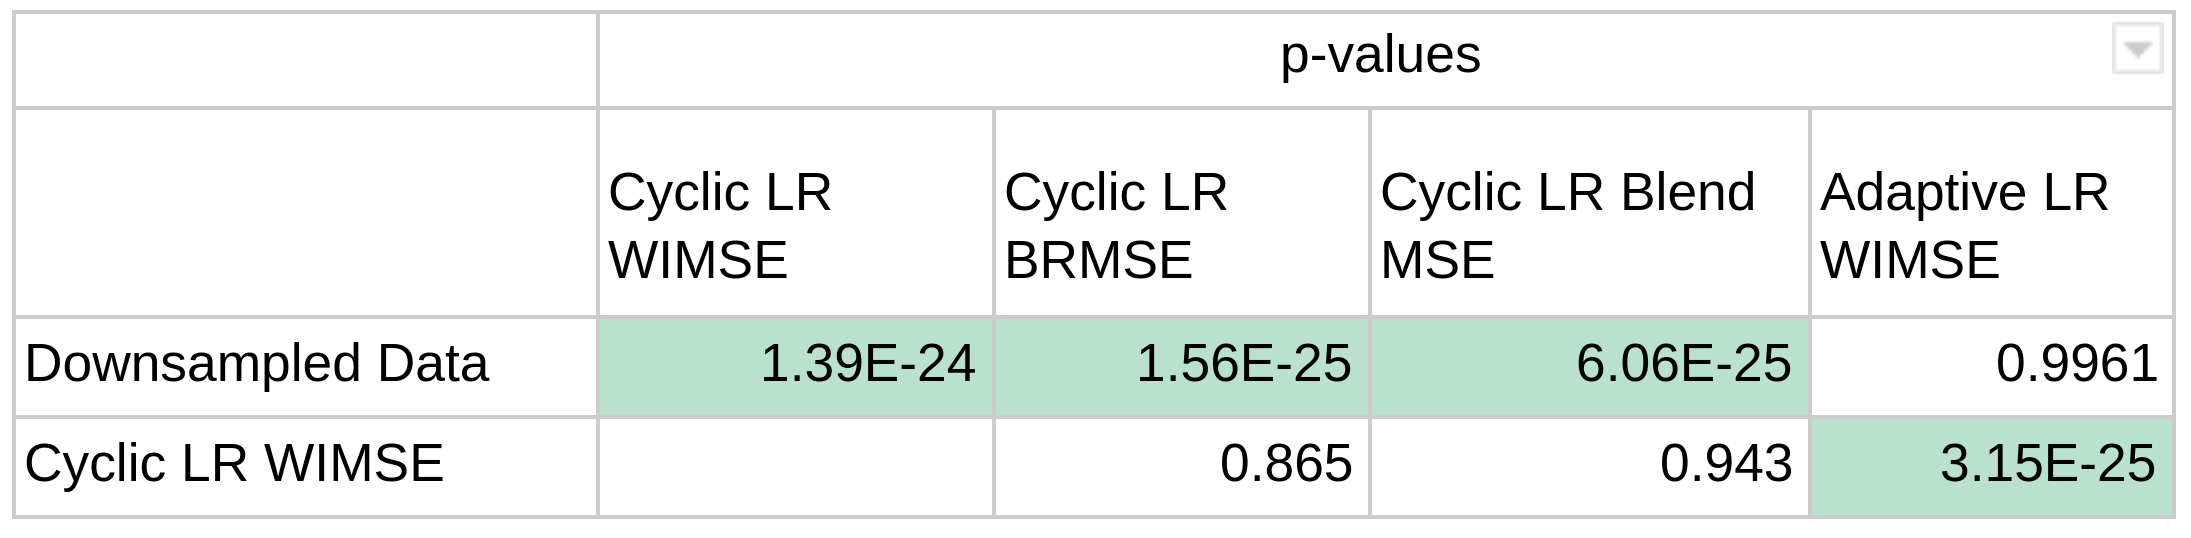
Table 2 - p-values of the paired t-tests for each model. The three MSE for the cyclic LR, are not significantly different between each other.
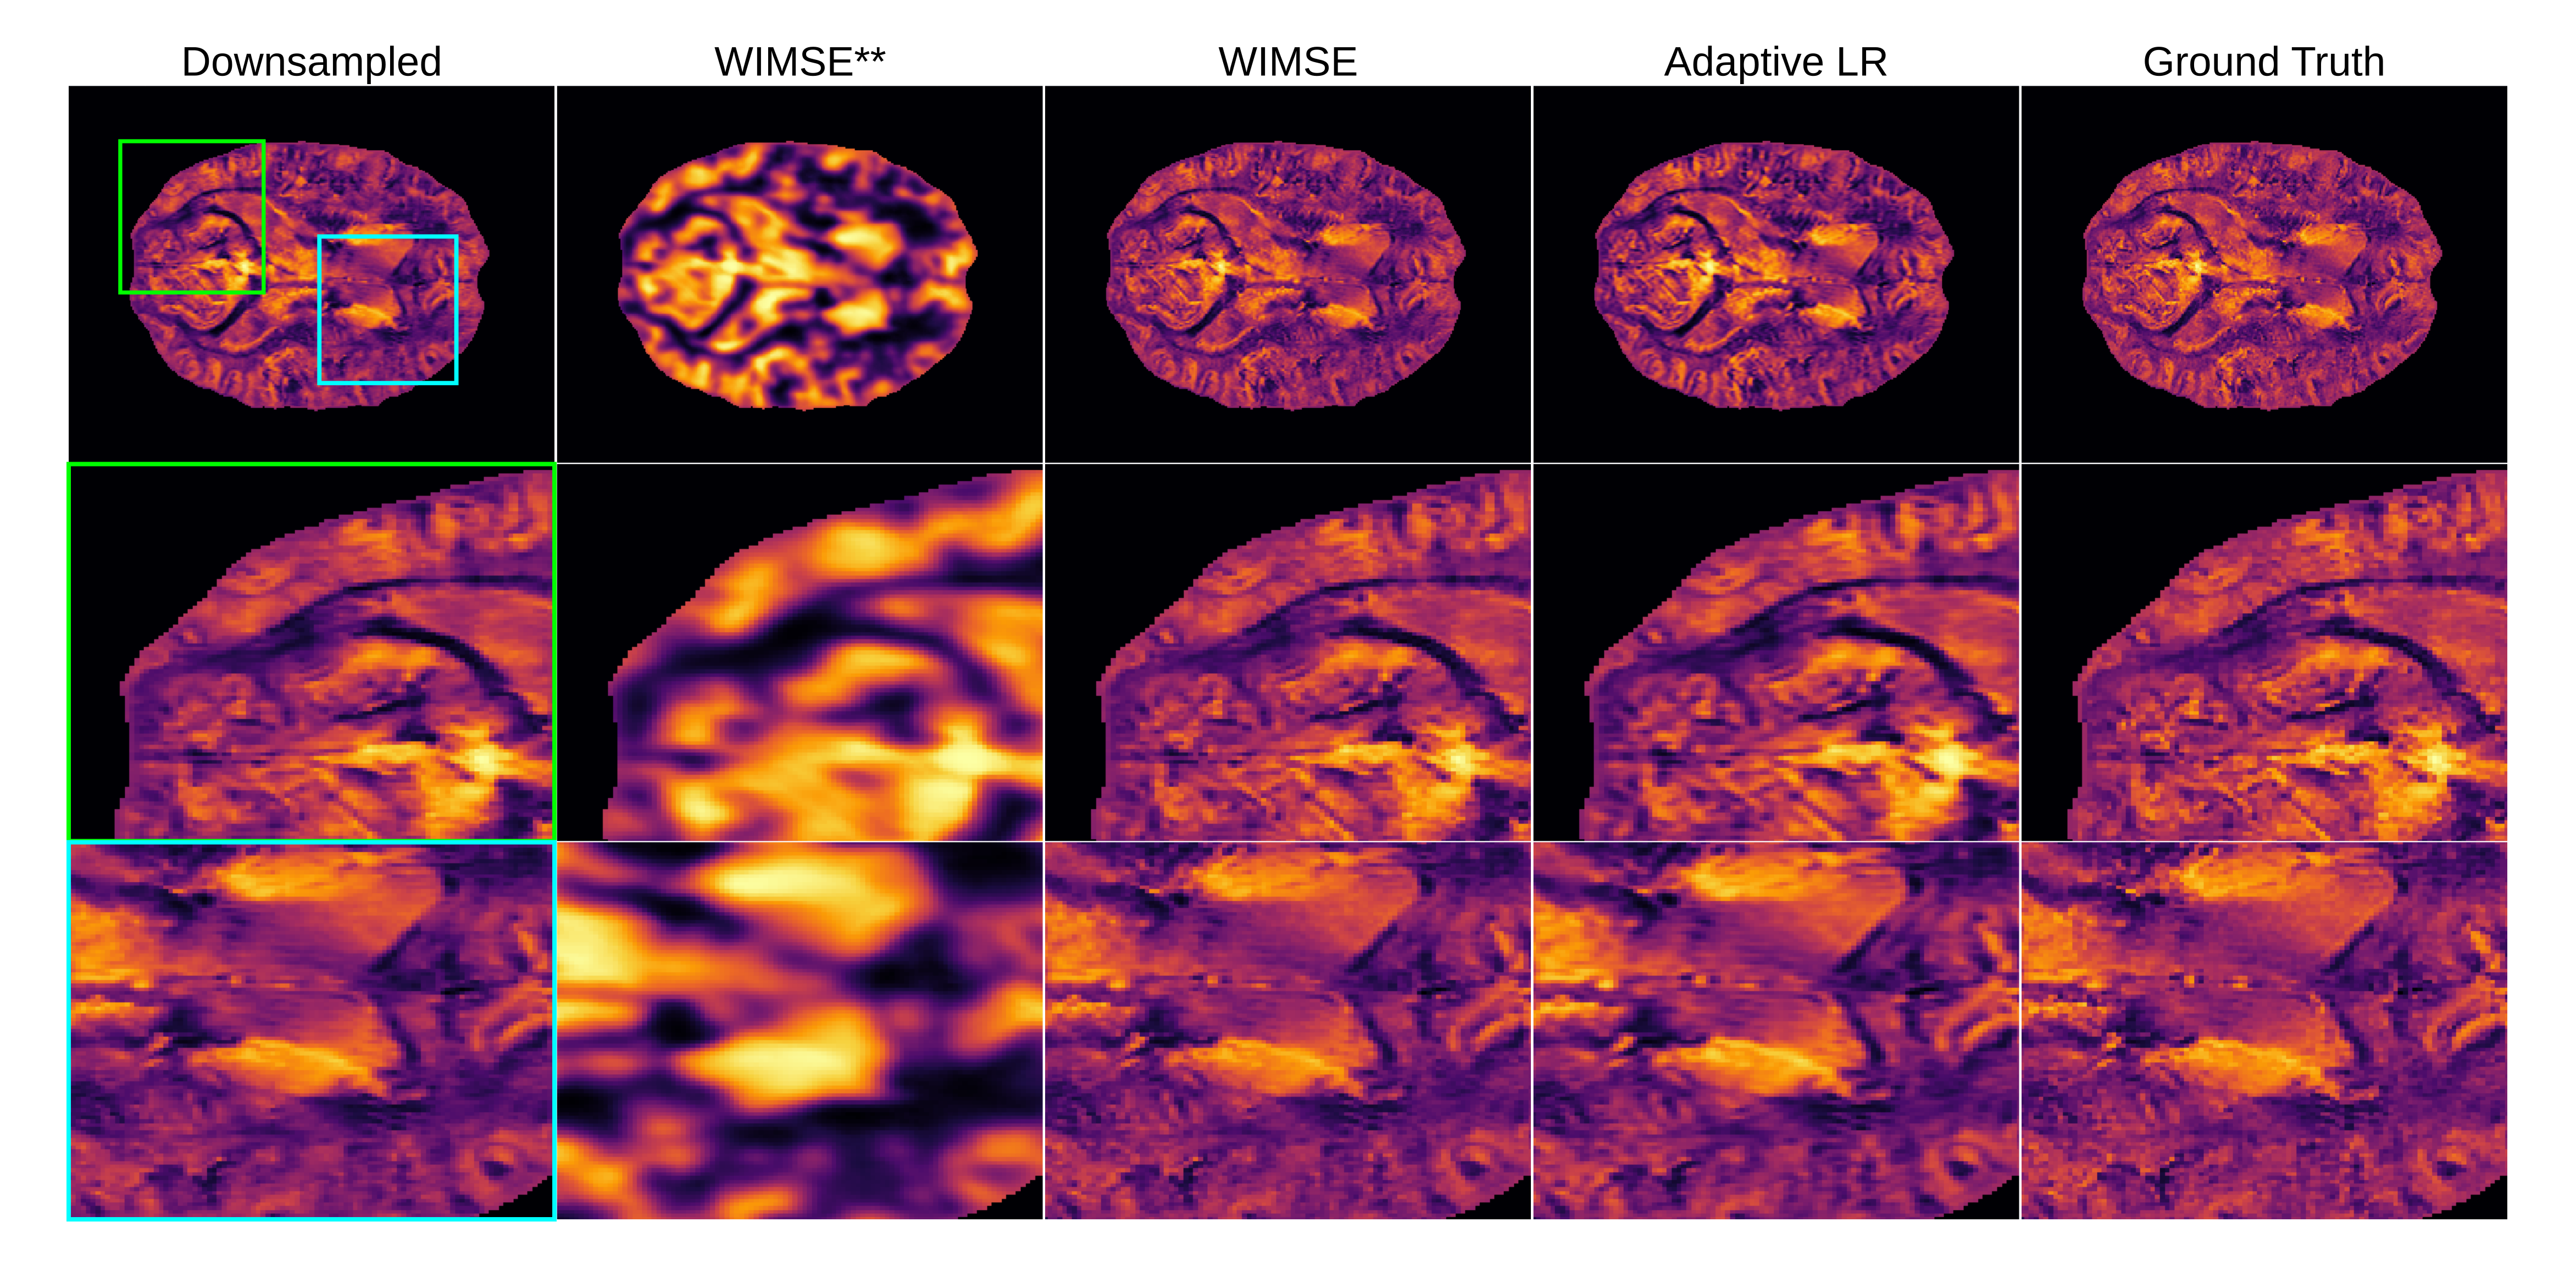
Figure 3 - Qualitative comparison of the models on a selected slice for the whole brain and two selected regions (green and blue boxes). The AHEAD reference is subject 005 slice 158. The ** represents the unoptimized cyclic LR WIMSE.