1766
Uncertainty estimation for DL-based motion artifact correction in 3D brain MRI1Philips Research, Hamburg, Germany
Synopsis
Test-time augmentation (TTA) is explored as an uncertainty prediction method for a neural network based 3D motion artifact correction starting from magnitude images. To this end, a synthetic training dataset is generated using a dedicated 3D motion artifact simulation pipeline. After training, a TTA-based uncertainty metric is employed to predict the network performance for data not contained in training. Using synthetic test data, we find that the proposed method can accurately predict the overall motion correction accuracy (total RMSE) but fails in certain cases to reliably detect local “hallucinations” (brain-like structures different from the actual anatomy) of the network.
Introduction
Artificial intelligence (AI) based image post-processing is a promising approach to improve image quality without additional scan time. However, erroneous network inference may have severe consequences in medical imaging. This raises the question of network uncertainty prediction, which has not been addressed extensively in MR-related research. Here we investigate test-time augmentation (TTA)1 as an uncertainty prediction method for the case of network-based motion artifact correction as performed on 3D magnitude brain images (e.g., DICOM).Methods
Volunteer data from N=10 subjects (informed consent obtained) were acquired on a 1.5T MRI system (Ingenia, Philips, NL) using a 16-channel head-coil and a 3D-T1w sequence with the following scan parameters: Segmented GRE (115 segments, interval 3000ms), linear profile order, SENSE R=2, FOV 256$$$\times$$$238$$$\times$$$180 mm3, sagittal orientation, acquisition(recon) voxel 1.05$$$\times$$$1.05$$$\times$$$1.1(0.64$$$\times$$$0.64$$$\times$$$1.1)mm3, inversion pre-pulse delay 950ms, a=8°, TR/TE=7.5/3.5ms, acquisition time 5:47min. The volunteers were instructed not to move during the scans, and all datasets were visually inspected to be artifact-free. Next, a motion artifact simulation pipeline, similar to previous work2, was applied to Ntrain=8 datasets to create a synthetic training dataset comprising about 180k slices (transverse reformat, 200 motion variants) extended for 3D rotations (nodding and left-right rolling, periodic and random motion variants) and including the actual k-space sampling trajectory. Synthetic test data were created with the same motion variants using the Ntest=2 remaining datasets.A U-Net with 4 max-pooling and 4 bilinear interpolation up-sampling layers was used in this study. Each pooling layer was preceded by residual blocks3 featuring two convolutional layers. A kernel size of k=3 was used, and the number of channels was n=32 in the first layer and was doubled after each pooling operation. The network was trained to predict the target artifact images using a mean-squared error (MSE) loss function and the Adam optimizer4.
After training, an uncertainty metric of the network inference was calculated using test-time augmentation (TTA)1: for each test image, the network was applied to multiple transformed versions of the image. To demonstrate feasibility of the method, flipping (horizontal, vertical, both) as well as Gaussian noise injection (4 samples) were used. For the noise-TTA, 10 different noise levels (logarithmically spaced from 0.001 to 0.01) were tested, and the value with the highest correlation to the true MSE (motion-corrected output compared to the motion-free ground truth) was selected for evaluation. For evaluating flipping-TTA, the network outputs were flipped back to the original orientation. Pixel-wise standard deviation (SD) was then calculated for the different outputs, and the arithmetic mean of SD-values was employed as uncertainty metric (denoted as in the following). To simplify interpretation of this quantity, the metric was scaled to the range [0.0-1.0] based on all values occurring in the test dataset.
Results
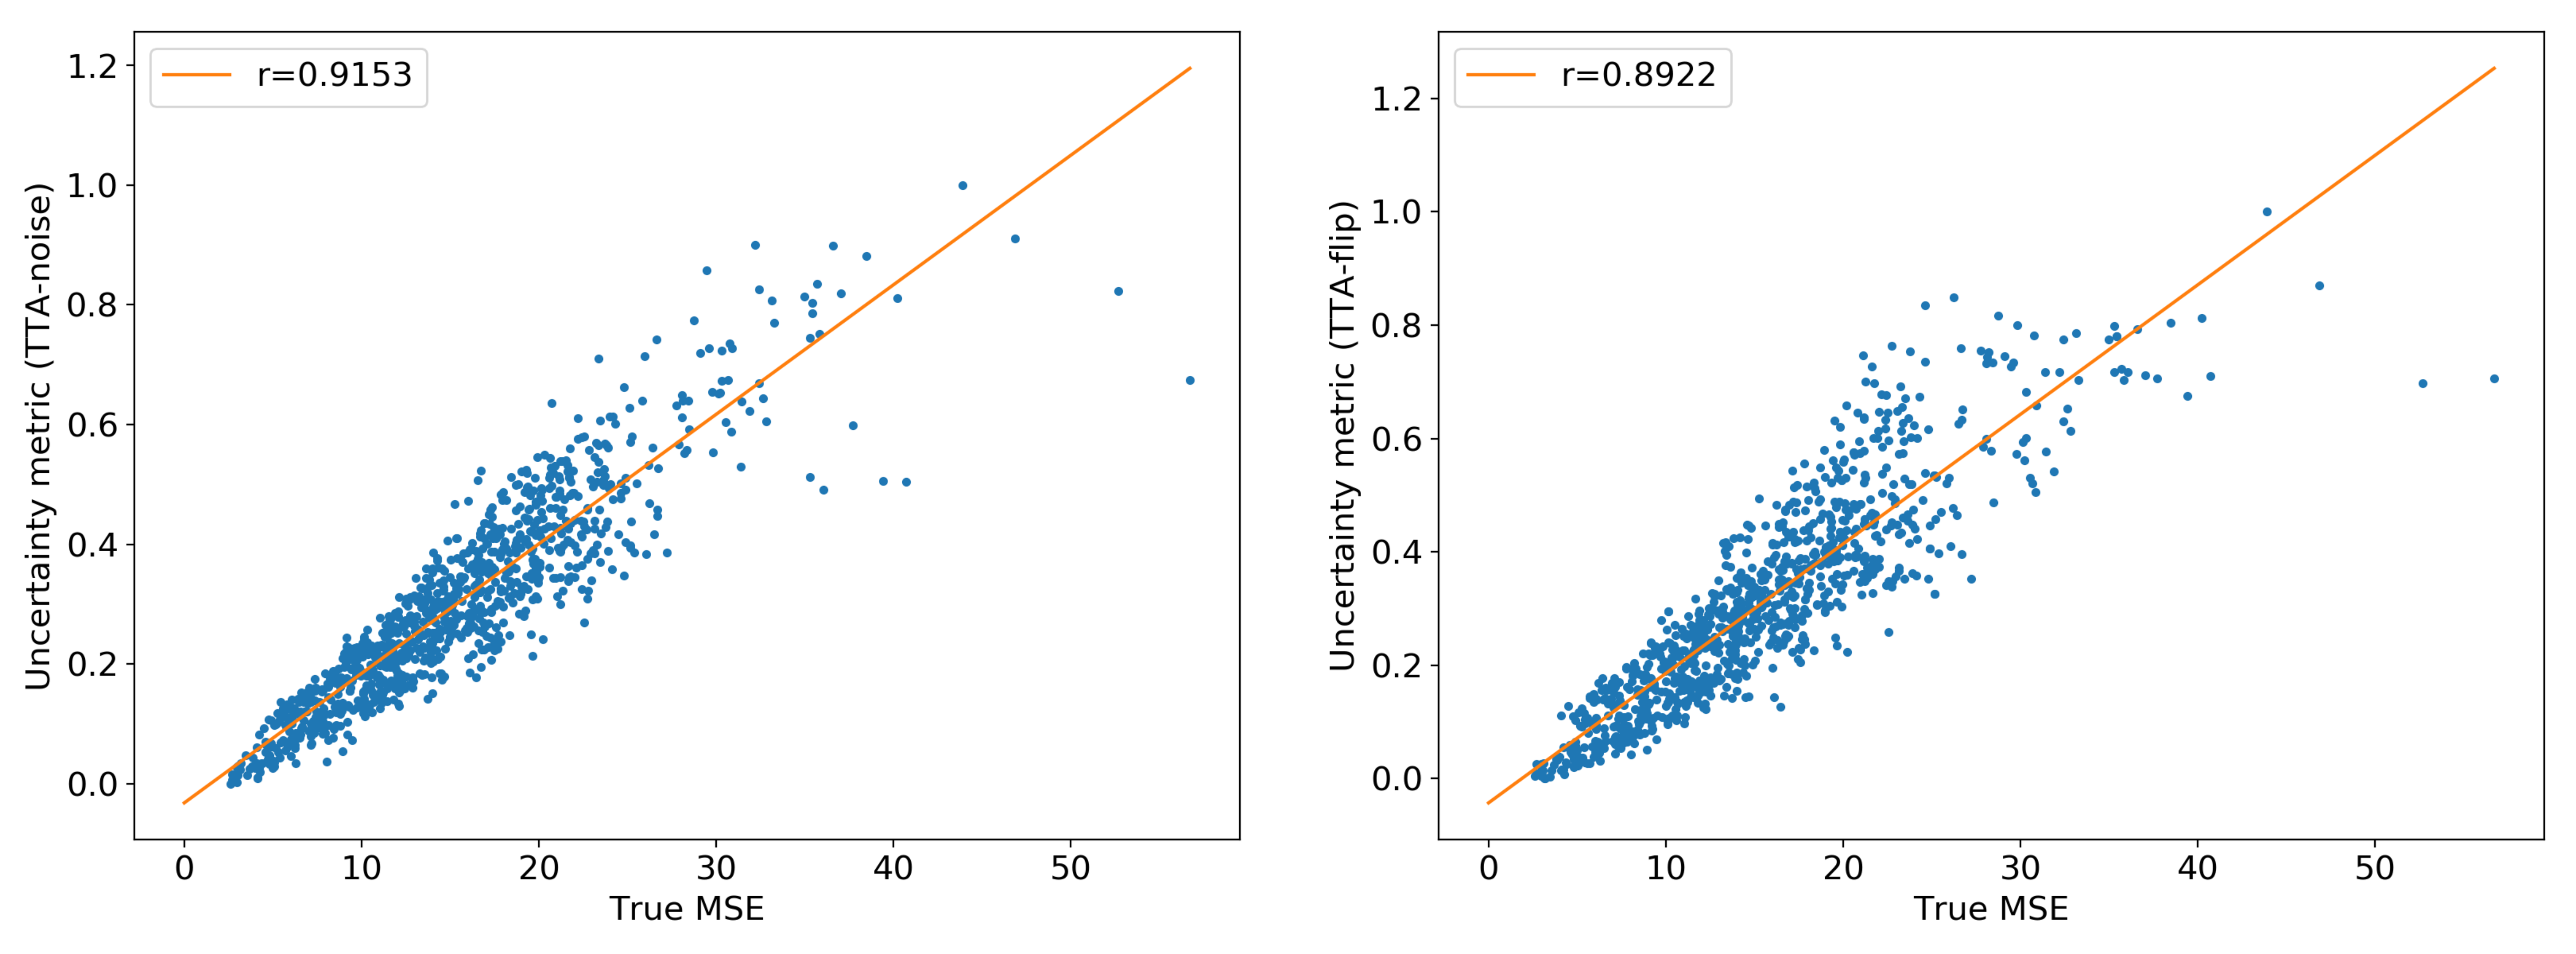
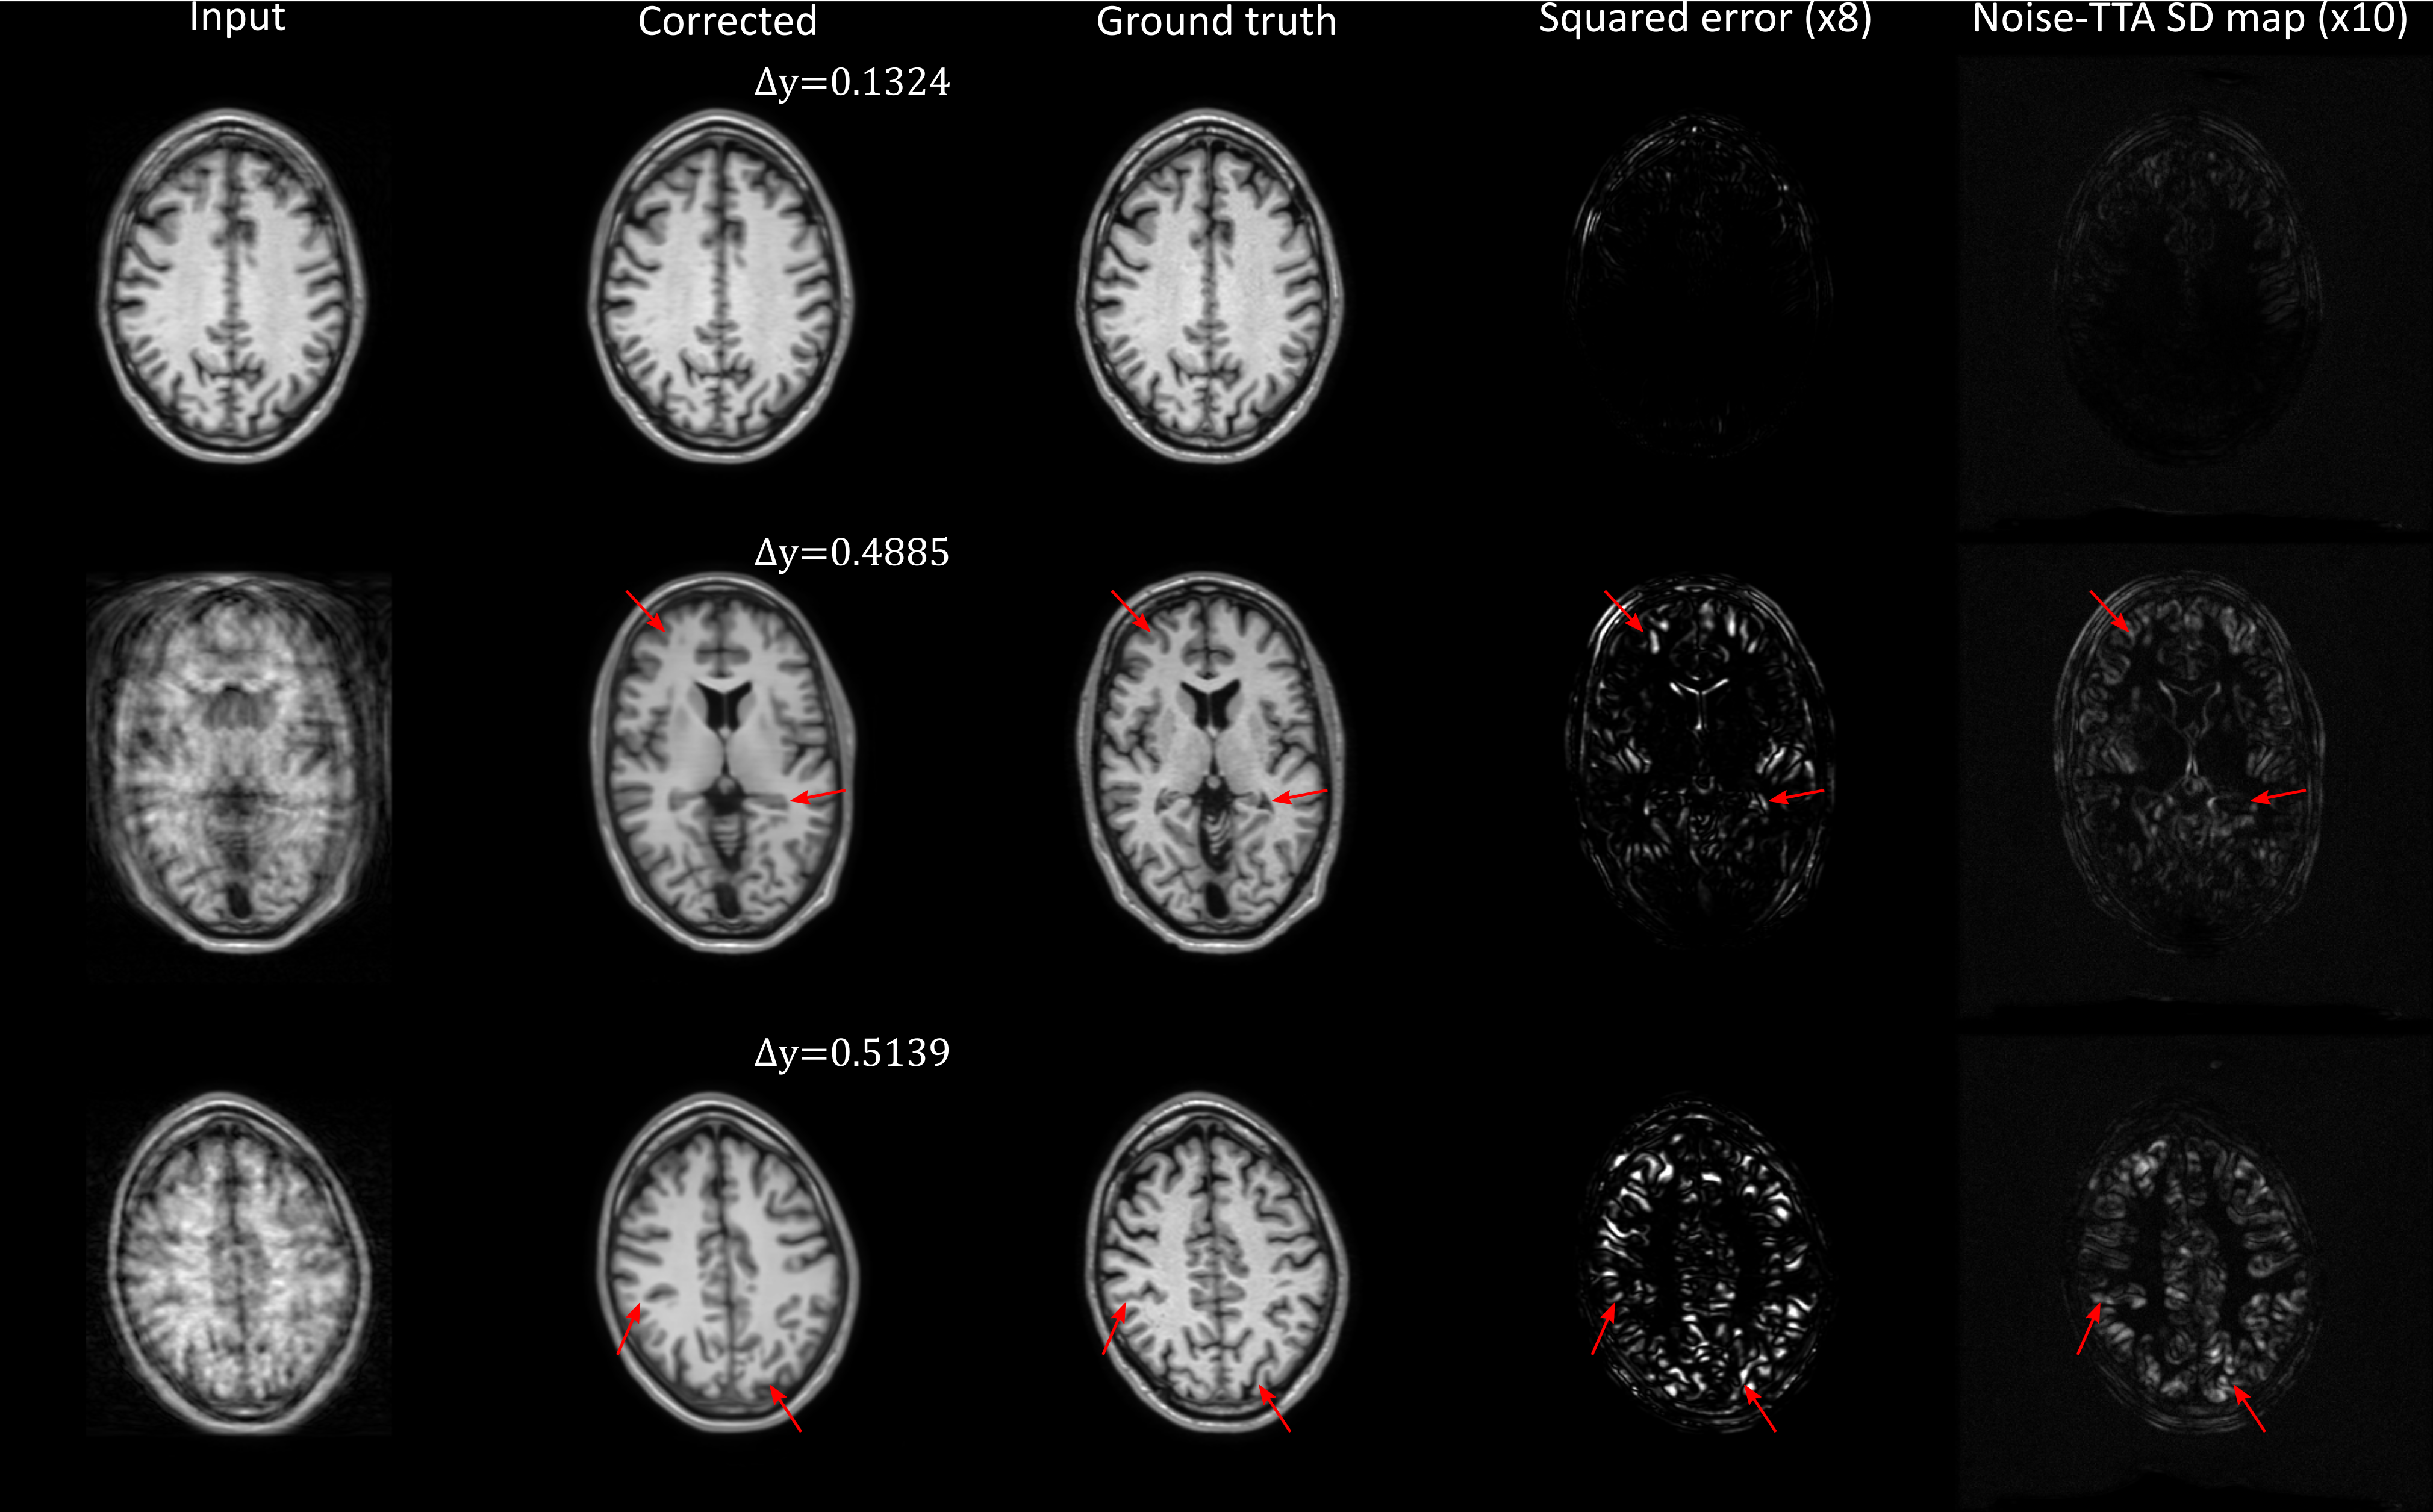
Figure 1 shows the uncertainty metrics (both flipping-TTA and noise-TTA) compared to the true MSE after network correction for n=1000 images from the test dataset. For the noise-TTA, the noise level with highest correlation is shown. Correlations of r=0.89 and r=0.92 were found between the true MSE and flipping-TTA and noise-TTA metrics, respectively.Figure 2 depicts example results from noise-TTA, where the uncertainty metric accurately predicted the validity of the corrections: For the input image shown in the top row, the network produced a faithful reconstruction of the ground truth image, which was accurately predicted by the low noise-TTA value. While the overall image quality was markedly improved by the network for the center and bottom rows, close visual inspection revealed incorrect anatomical structures of realistic appearance in some regions (“hallucinations”, marked by arrows). These substantial deviations from the ground truth were accurately predicted by the relatively high noise-TTA values.
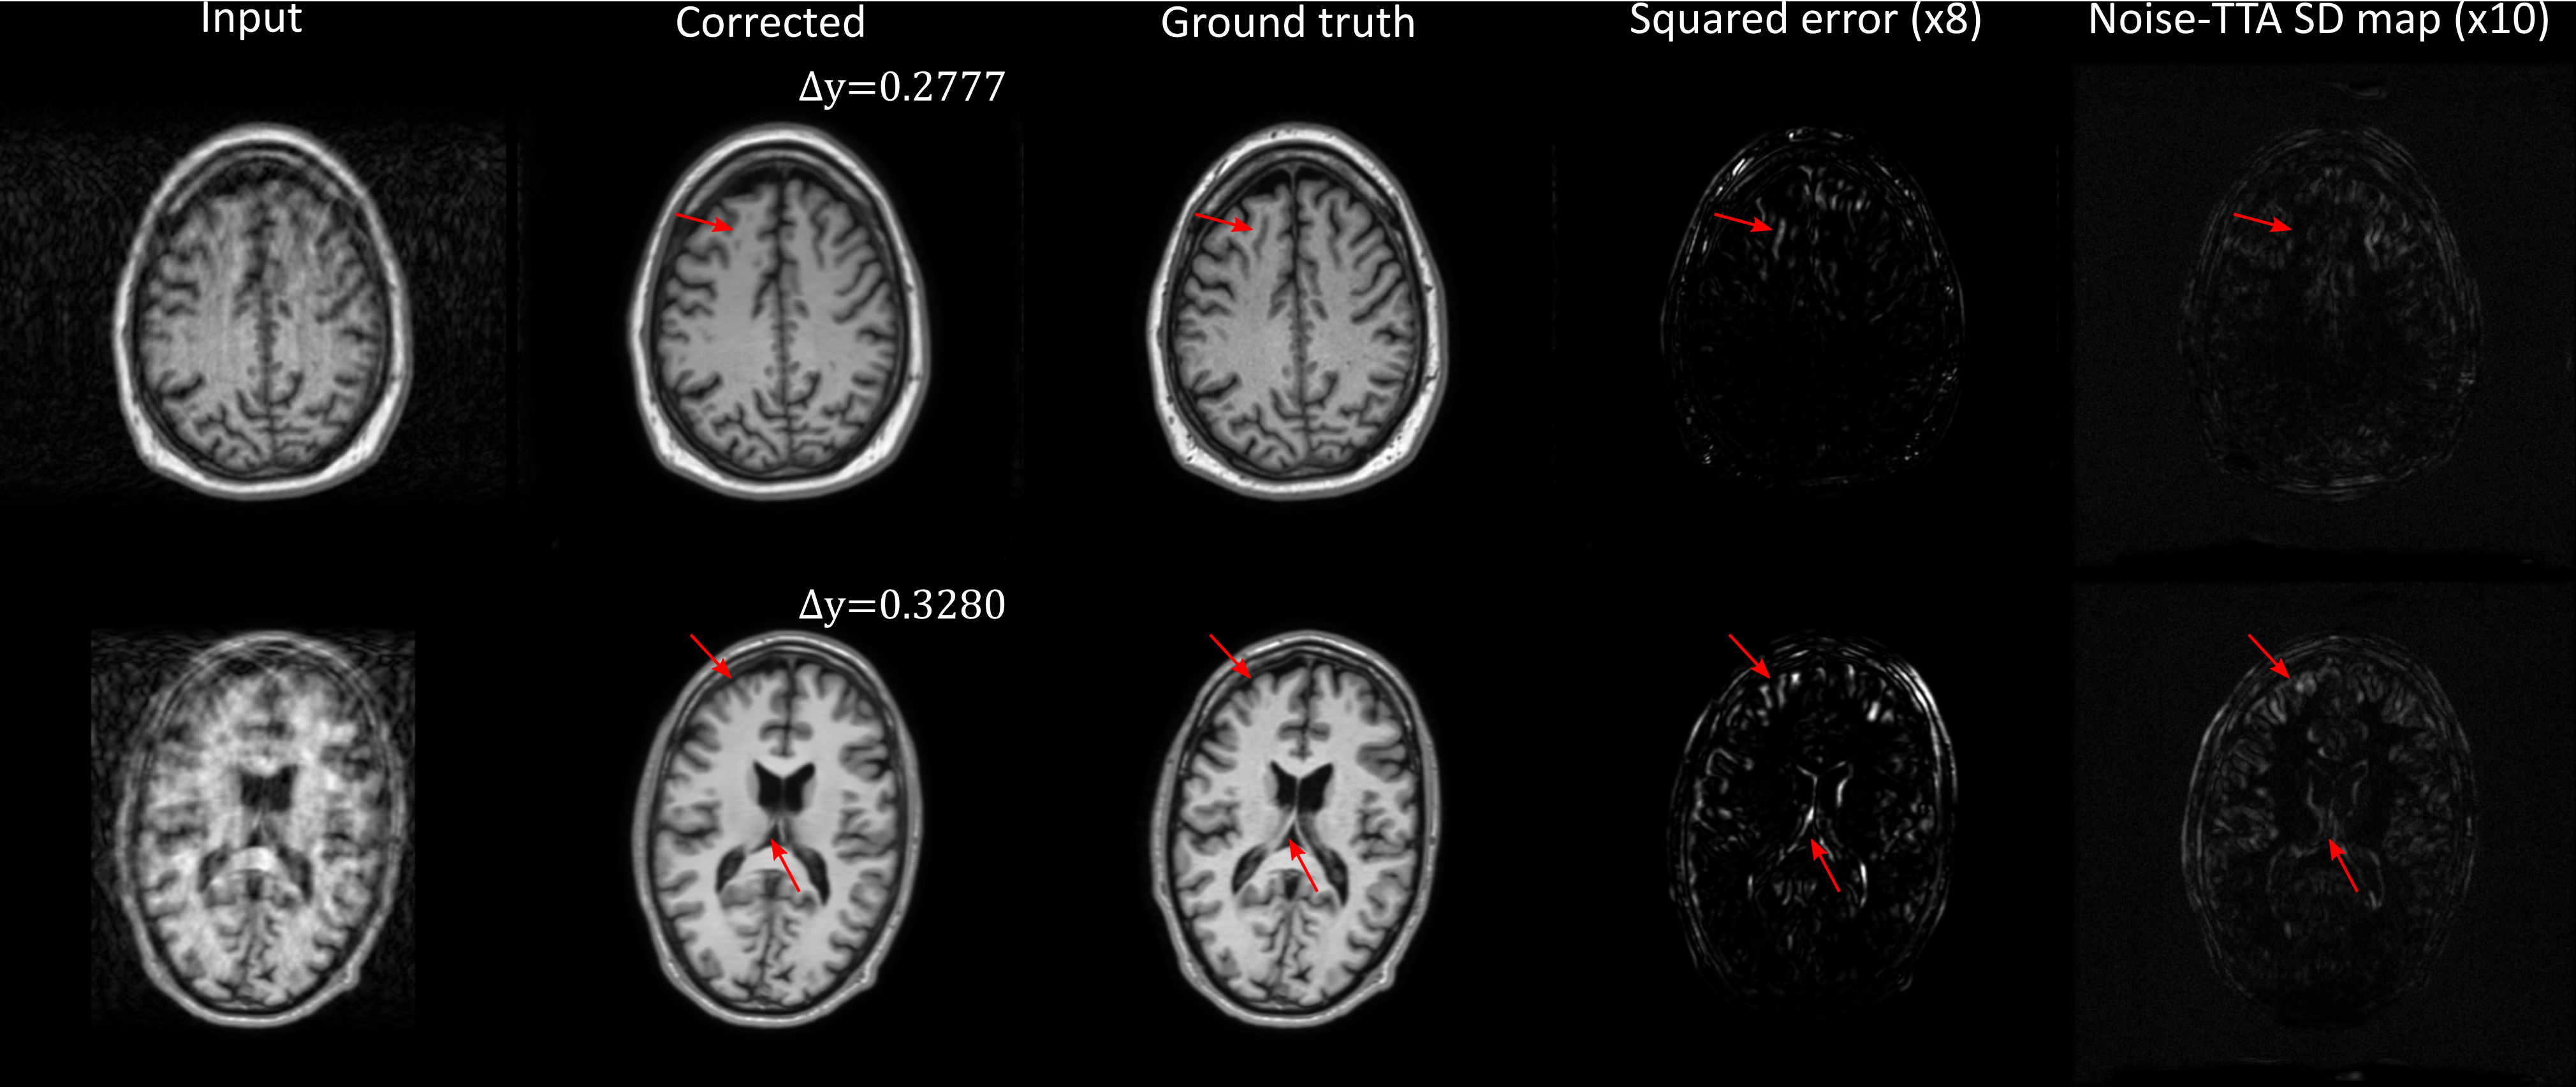
In contrast, Fig. 3 depicts two examples where the uncertainty metric did not accurately predict the validity of the corrections: in both cases, low noise-TTA values were obtained, but local hallucinations could still be observed (marked by arrows). While the overall structure of the noise-TTA standard deviation maps was generally similar to the true squared error distribution (Figs. 2 and 3), most local hallucinations were not clearly discernable in these maps.
Discussion & Conclusion
TTA was found to be a promising predictor of the overall network performance: high correlation with the MSE after correction was observed for the investigated methods. In magnitude image based motion correction, the phase information in the raw data is discarded such that reconstruction of motion-free images is inherently ill-posed. With increasing artifact level, the network output hence becomes increasingly sensitive to small perturbations of the input, like noise enhancement or image reorientation. This may explain the mechanism behind TTA-based uncertainty prediction.While noise-TTA maps have a similar appearance as true error maps, local hallucinations were not detected in all cases. Prediction of such local hallucinations is an important topic for future research. A promising option would be to use an additional network that is trained to predict a “hallucation risk” for a given input image based on the local artifact appearance. Nevertheless, accurate prediction of MSE may e.g. be used to guide iterative motion correction algorithms where network artifact correction is used to improve convergence5.
Acknowledgements
No acknowledgement found.References
1. Wang G, Li W, Aertsen M, Deprest J, Ourselin S, Vercauteren T. Aleatoric uncertainty estimation with test-time augmentation for medical image segmentation with convolutional neural networks. Neurocomputing 2019;338:34-45.
2. Sommer K, Saalbach A, Brosch T, Hall C, Cross NM, Andre JB. Correction of Motion Artifacts Using a Multiscale Fully Convolutional Neural Network. Am J Neuroradiol 2020;41(3):416-23.
3. He K, Zhang X, Ren S, Sun J. Deep residual learning for image recognition. Proc CVPR 2016:770-778.
4. Kingma D, Jimmy BA. Adam: A method for stochastic optimization. arXiv:1412.6980, 2014.
5. Haskell MW, Cauley SF, Bilgic B, Hossbach J, Splitthof DN, Pfeuffer J, Setsompop K, Wald LL. Network Accelerated Motion Estimation and Reduction (NAMER): Convolutional neural network guided retrospective motion correction using a separable motion model. Magn Reson med 2019;82(4):1452-1461.
Figures