1745
Towards to quantitative evaluation of brain damages in recovered COVID-19 patients using Synthetic MRI1Department of Radiology, the Fifth Affiliated Hospital of Sun Yat-sen University, Zhuhai, Guangdong, China, 2MR Research, GE Healthcare, Beijing, China
Synopsis
Increasing evidences support that SARS-CoV-2 can invade the central nervous system (CNS) and damage neuronal cells. However, there is no study to unravel the brain microstructural changes associated with SARS-CoV-2. Synthetic MRI provides T1 and T2 mapping, which could quantitatively evaluate the tissue microstructures. In current study, our goal is to assess the microstructural involvement of gray matter in recovered COVID-19 patients using Synthetic MRI. Our results indicated that the microstructure component of gray matter is disrupted in recovered COVID-19 patients, which provided the evidence of CNS damages.
Introduction
A novel coronavirus SARS-CoV-2 broke out in Wuhan, China in December 2019 and rapidly spread around the world, and it was named COVID-19. Because of its high rate of morbidity and mortality, nowadays it has caused severe social, economic and ecological problems. SARS-CoV-2 could cause multiple system damages. In addition, increased evidences demonstrated that SARS-CoV-2 can cause acute or late central nervous system (CNS) damages, especially the patients with severe respiratory symptoms. 1 However, there is no study to unravel the gray matter microstructural changes associated with SARS-CoV-2. Synthetic MRI is a technique for obtaining the T1, T2 Map simultaneously in one scan. Previous studies have shown that T1, T2 values are tissue-specific biophysical parameters that can be influenced by several pathological states of the tissue, such as edema, loss of myelin or axons, and inflammation. 2-4 Hence, in current study, our goal is to assess the microstructural involvement of gray matter in recovered COVID-19 patients using Synthetic MRI.Methods
A cross-sectional study was conducted in 29 recovered COVID-19 patients, including severe groups (SG, n=11) and ordinary groups (OG, n=18). 23 age-, sex- and education level-matched subjects were recruited as healthy controls (HC, n=23). Each subject underwent both SyMRI and conventional 3D T1-FSPGR scans. Quantitative parameters, T1 and T2 maps, were extracted from the SyMRI data using vendor provided postprocessing tool (SyntheticMR, v11.2.2). Thereafter, the individual T1 and T2 maps were first co-registered to 3D T1-FSPGR image, then normalized to the MNI space. The AAL atlas was applied to extract the regional quantitative values for each subject. Comparisons of T1 and T2 values of the 90 brain regions between the three groups were performed using ANCOVA analysis followed by post-hoc two-by-two comparisons using the t-test, with P < 0.05 as a statistically significant difference. A false discovery rate (FDR) correction method was applied to correct the multiple comparison.Results and Discussion
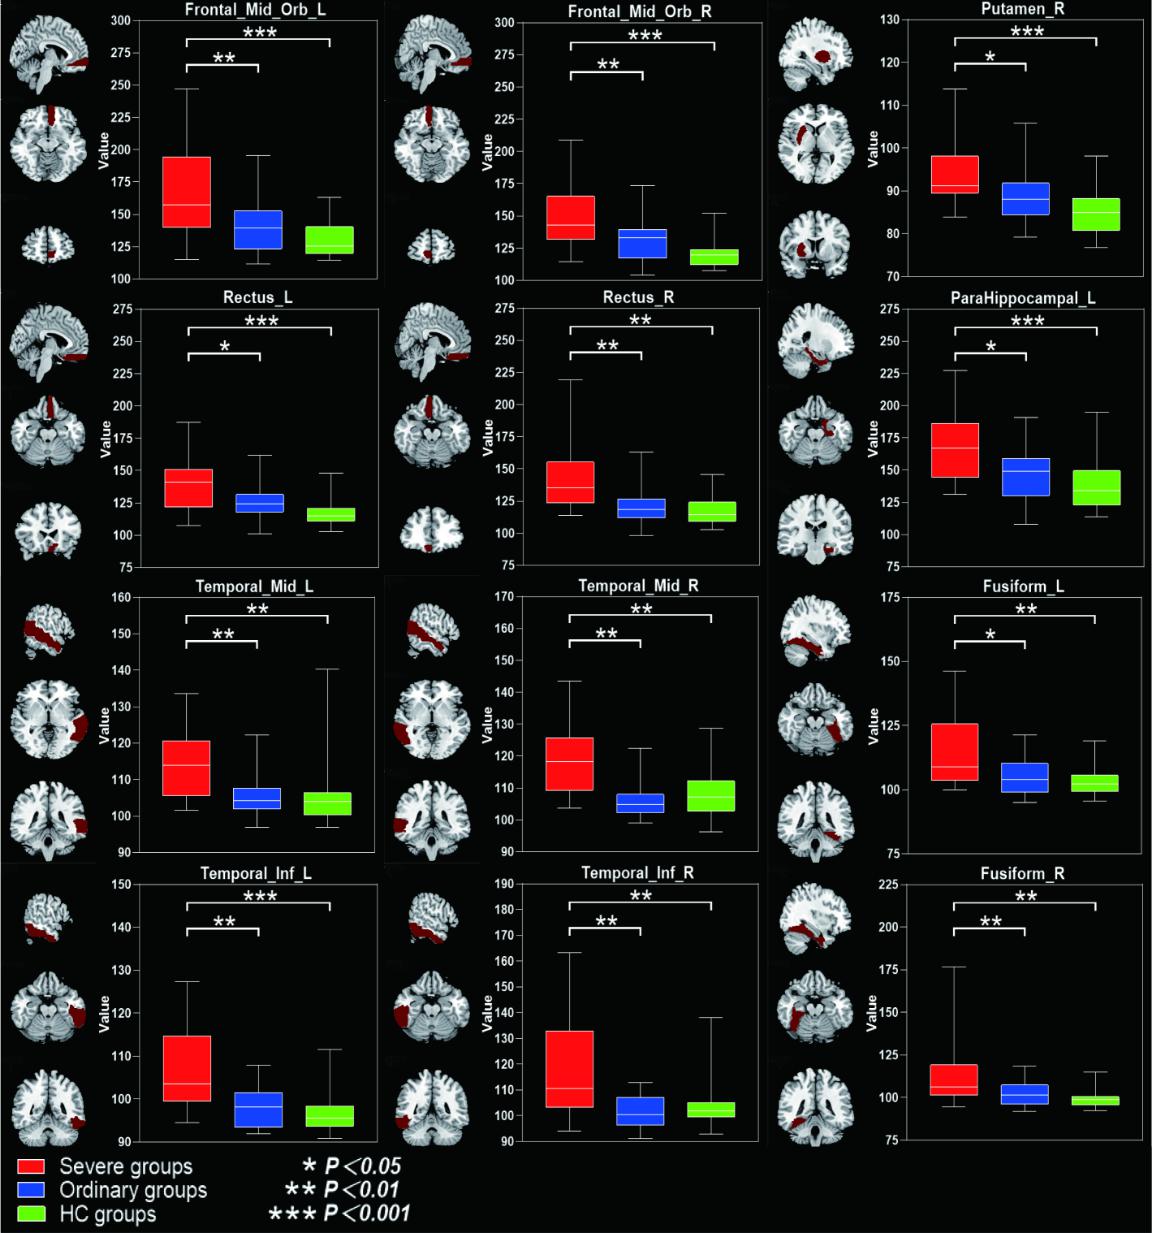
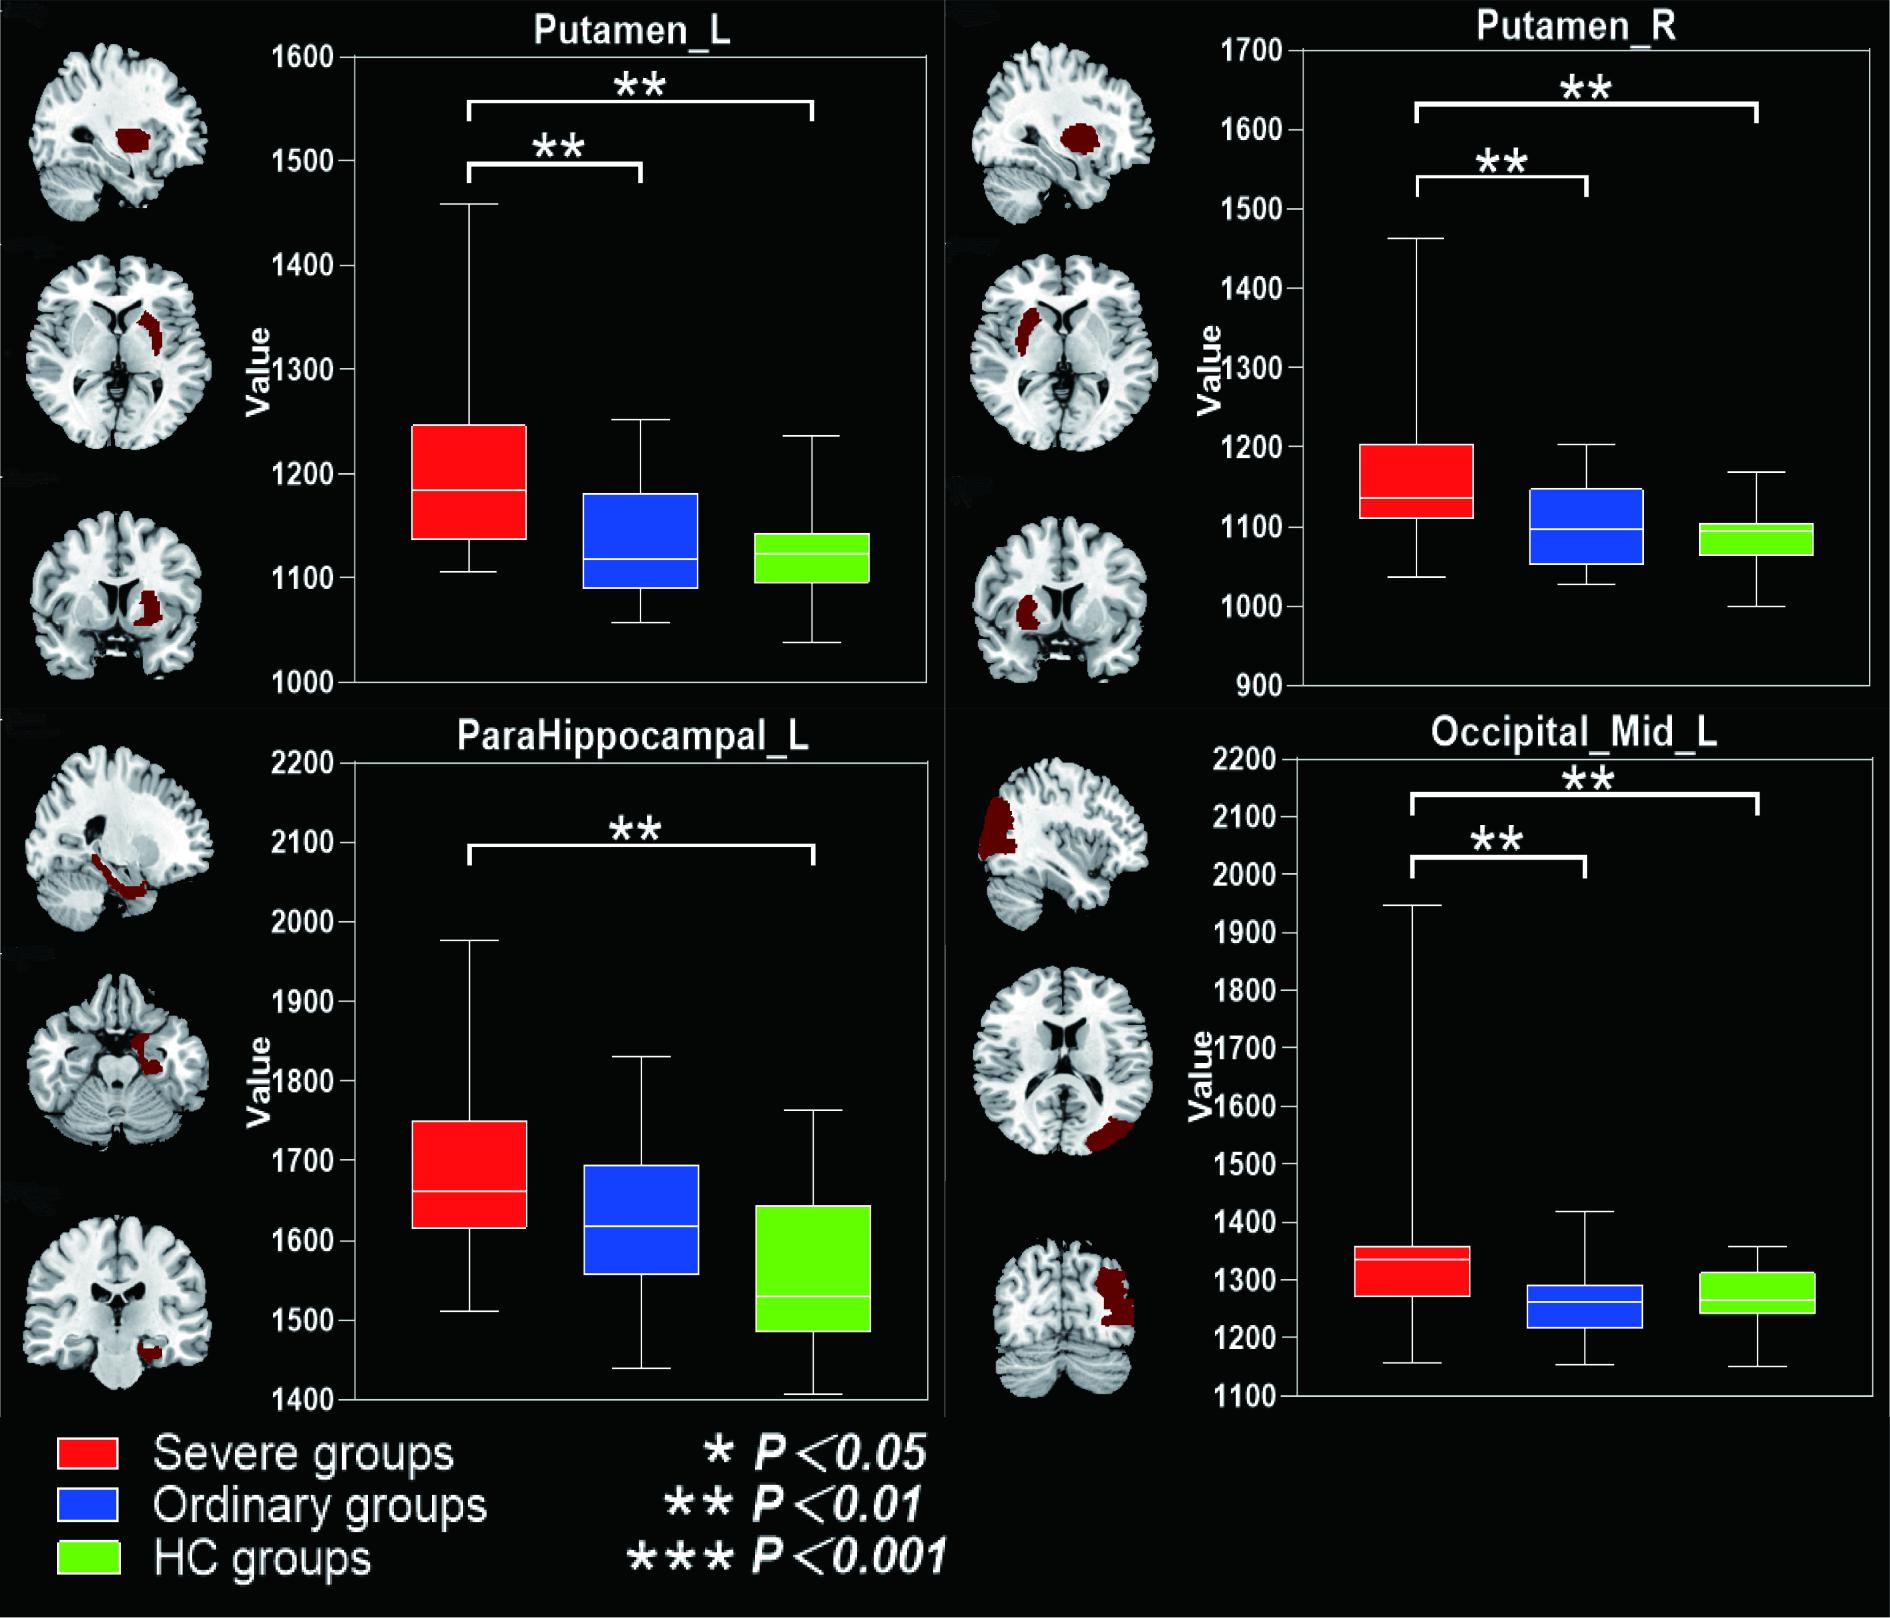
Table 1 summarized the subject characteristics. Relative to the OG and HC, the SG had significantly higher T2 values in the bilateral mid-orbital frontal gyrus, gyrus rectus, fusiform gyrus, middle temporal gyrus, inferior temporal gyrus and left pars hippocampal gyrus, and right bean-crustal nuclei (P < 0.05, corrected; Table 2 and Figure 1). Relative to HC, there was a trend of higher T1 values in the left pars hippocampal gyrus, left middle occipital gyrus, and bilateral bean-crustal nuclei in the SG (P < 0.05, uncorrected). Relative to the OG, there was a tendency for T1 values to increase in the left middle occipital gyrus, and bilateral bean-crustal nuclei in the SG ( P < 0.05, uncorrected; Table 3 and Figure 2). The results of the elevated T1 and T2 values measured in the gray matter of the brain of the recovered COVID-19 patients in this study may be related to virus-induced cellular inflammatory edema and ischemic necrosis of neurons, which demonstrated in previous studies. Specifically, earlier postmortem studies in SARS-CoV-infected patients found that signs of cerebral edema and meningeal vasodilation were detectable in most SARS cases. In addition, infiltration of monocytes and lymphocytes in the vascular wall, ischemic changes in neurons, demyelination of nerve fibers, and SARS-CoV virus particles and genome sequences (mainly in the hypothalamus and cortex) can be detected in the brain. 5,6 A pathology similar to that of SARS-CoV was found in the autopsy study of the recovered COVID-19 patients.7,8Conclusion
There may be persistent damage to the gray matter of the brain in recovered COVID-19 patients. Synthetic MRI can be used as a sensitive imaging tool to assess the damage to the microstructure of the CNS in COVID-19 patients and to dynamically monitor the CNS in recovered COVID-19 patients.Acknowledgements
No acknowledgement found.References
1. Mao L, Jin H, Wang M, et al. Neurologic Manifestations of Hospitalized Patients with Coronavirus Disease 2019 in Wuhan, China. JAMA neurology. 2020;77(6):1-9.
2. Moore GR, Laule C, Mackay A, ,et al. Dirty-appearing white matter in multiple sclerosis: preliminary observations of myelin phospholipid and axonal loss. J Neurol. 2008 Nov;255(11):1802-11.
3. Seewann A, Vrenken H, van der Valk P, et al. Diffusely abnormal white matter in chronic multiple sclerosis: imaging and histopathologic analysis. Arch Neurol. 2009 May;66(5):601-9.
4. Vavasour IM, Li DK, Laule C, et al. Multi-parametric MR assessment of T(1) black holes in multiple sclerosis : evidence that myelin loss is not greater in hypointense versus isointense T(1) lesions. J Neurol. 2007 Dec;254(12):1653-9.
5. Ding Y, He L, Zhang Q, et al. Organ distribution of severe acute respiratory syndrome (SARS) associated coronavirus (SARS-CoV) in SARS patients: implications for pathogenesis and virus transmission pathways. J Pathol. 2004 Jun;203(2):622-30.
6. Xu J, Zhong S, Liu J, et al. Detection of severe acute respiratory syndrome coronavirus in the brain: potential role of the chemokine mig in pathogenesis. Clin Infect Dis. 2005 Oct 15;41(8):1089-96.
7. Paniz-Mondolfi A, Bryce C, Grimes Z, et al. Central nervous system involvement by severe acute respiratory syndrome coronavirus-2 (SARS-CoV-2). J Med Virol. 2020 Jul;92(7):699-702.
8. Barton LM, Duval EJ, Stroberg E, et al. COVID-19 Autopsies, Oklahoma, USA. Am J Clin Pathol. 2020 May 5;153(6):725-733.
Figures
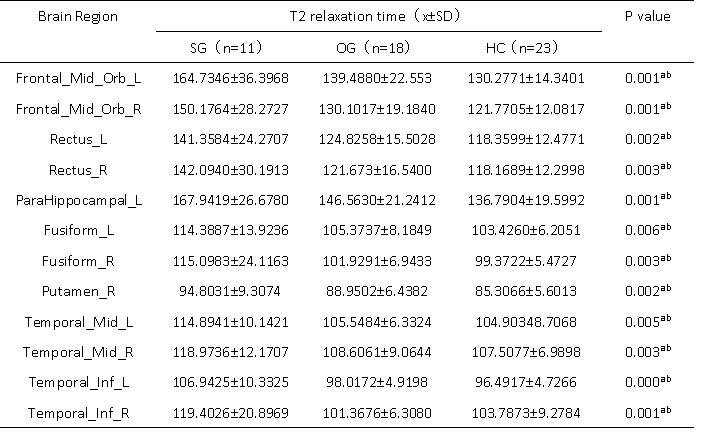
Table 1. Characteristics of all subjects.
Abbreviations: SG, severe patient group; OG, ordinary patient group; HC, healthy controls. Data are mean ± standard deviation. For comparisons of demographics, *P values are obtained using one-way ANOVA tests; #P value for the gender distribution in the three groups was obtained using a χ2 test. There were no differences among the three groups in age at scan, gender, BMI, or education.

Table 2. Between-group differences of T2 value among severe groups, ordinary groups and HC.
Abbreviations: SG, severe patient group; OG, ordinary patient group; HC, healthy controls; L, left; R, right. Indicates statistical significant different (P < 0.05, FDR corrected). aPost hoc paired comparisons showed significant group differences between SG versus HC. bPost hoc paired comparisons showed significant group differences between SG versus OG.
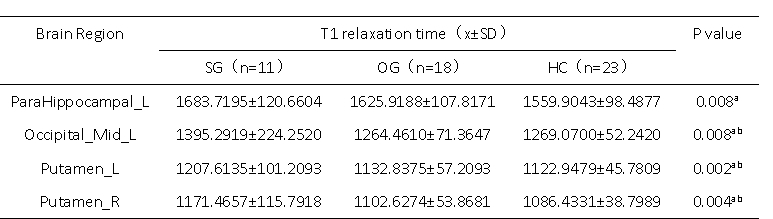
Table 3. Between-group differences of T1 value among severe groups, ordinary groups and HC.
Abbreviations: SG, severe patient group; OG, ordinary patient group; HC, healthy controls; L, left; R, right. Indicates statistical significant different (P < 0.01, uncorrected). aPost hoc paired comparisons showed significant group differences between SG versus HC. bPost hoc paired comparisons showed significant group differences between SG versus OG.