1744
Brain Metabolic Changes in COVID-19 Patients: Preliminary Observations.1Department of Radiology, Massachusetts General Hospital and Harvard Medical School, Boston, MA, United States, 22A. A. Martinos Center for Biomedical Imaging, Boston, MA, United States, 3Neurology, Massachusetts General Hospital and Harvard Medical School, Boston, MA, United States, 4Medical Image Analysis and Biometry Laboratory, Universidad Rey Juan Carlos, Madrid, Spain
Synopsis
Here we report for the first time metabolic abnormalities in white matter lesions of COVID-19 patients using MR-spectroscopic imaging. The study compares metabolic changes in COVID-19 patients to those seen in other encephalopathies and a normal control case. Findings include NAA reduction indicating neuronal injury/loss, and choline and myo-inositol elevation indicating demyelination and neuroinflammation, respectively. One COVID-19 patient exhibited pronounced lactate elevation consistent with "silent hypoxia". Other factors may be involved considering the degree of metabolic changes seen in these patients when compared to other COVID-19 cases without similar white matter changes as well as other white matter disorders.
Introduction
COVID-19 (Coronavirus Disease 2019), caused by severe acute respiratory syndrome coronavirus2 (SARS-CoV-2), was declared a pandemic by the World Health Organization on March 11, 20201. COVID-19 primarily affects the lower respiratory tract, but many organs can be involved, including the central nervous system2. There is increasing recognition of a spectrum of neurological disorders associated with the SARS-CoV-2 infection, including the development of diffuse white-matter (WM) signal abnormalities. Although COVID-19 associated white matter abnormalities resemble other forms of diffuse WM injury, there are also notable differences, such as the distribution of white matter lesions. The pathogenesis of COVID-19 WM abnormalities remains unknown, although “silent hypoxia” has been hypothesized to have a central role in its development3. MR spectroscopy is a non-invasive diagnostic tool for evaluating WM injury4, here we present examples of WM metabolic results of COVID-19 patients and compare with both other leukoencephalopathy cases and a control case.Methods
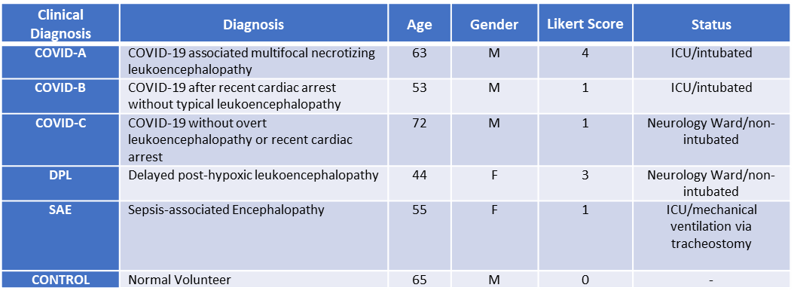
Participants: Data were collected from three COVID-19 cases, two control leukoencephalopathy cases (post-hypoxic and sepsis-related leukoencephalopathy), and one control without encephalopathy. A qualitative Likert scoring system was used for the evaluation of the extent of white matter abnormalities. The scoring system: 0 = No white matter abnormalities; 1 = Subtle diffuse WM signal abnormalities or extent of confluent WM signal abnormalities < 25%; 2 = Extent of WM abnormalities between 25 and 50%; 3 = Extent of WM abnormalities more than 50%; 4 = Presence of necrotizing or cavitary changes within the WM lesions (indicative of a necrotizing leukoencephalopathy) (See Table 1 for Demographics and clinical information).1H Brain MRSI: performed using Siemens 3T MRI scanners with a 32-channel head-coil. 3D-MRSI sequence was acquired using a Localization by Adiabatic SElective Refocusing (LASER) pulse sequence with fast SPIRAL k-space acquisition5. Acquisition parameters: TE/TR = 30ms and 288ms/1500 ms, NA = 5, vector size = 512, Matrix = 16 x 16 x 8, FOV = 160 mm, isotropic resolution 1 cc. VOIs were placed using FLAIR or T2 weighed images to include the WM abnormalities. Raw MRSI data were processed using LCModel v6.3. NAA, Choline, Myo-Inositol, Creatine, glutamate+glutamine (Glx), and Lactate were quantified. Spectra from voxels with SNR <4 and FWHM > 15Hz were excluded from the analysis. Metabolites with CRLB% < 25 were selected and for analysis, 6-8 WM voxels of the slice with most prominent WM abnormalities were chosen and their metabolite ratios averaged. Results are reported with respect to Creatine. Pearson correlations between metabolic ratios and Likert scores were assessed.
Results
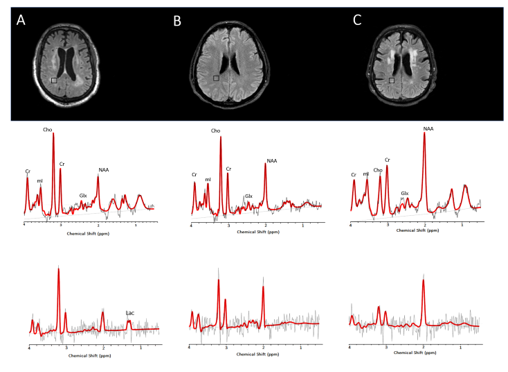
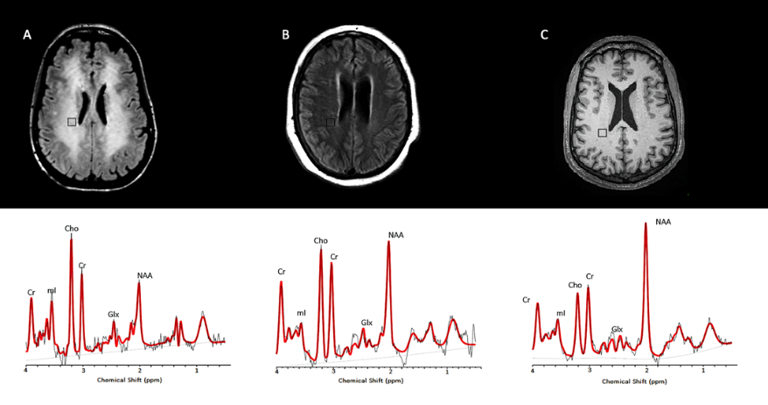
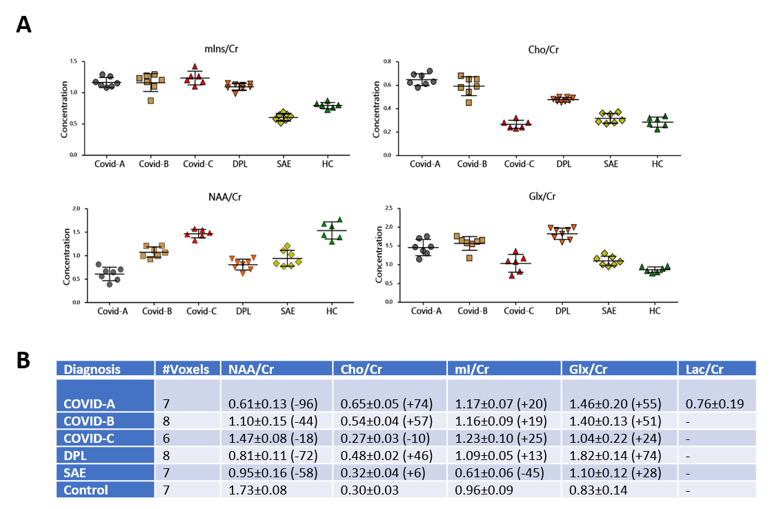
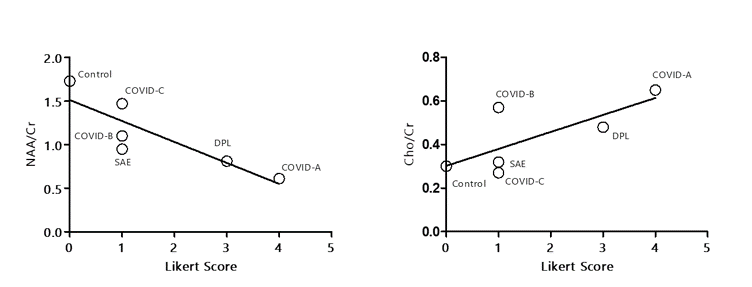
The metabolic profiles of the 3 COVID-19 patients (Figure 1A-C) were contrasted to those of two other patients with leukoencephalopathy without SARS-CoV-2 infection (DPL, SAE) and control case (Figure 2A-C). Compared to the control case, COVID-A and B patients had significant elevation of Cho levels, while COVID-C levels were similar to the control (Figure 3A-B). The patient with delayed post-hypoxic-leukoencephalopathy (DPL) with significant WM abnormalities showed increased Choline, while the patient with sepsis-associated-encephalopathy (SAE) displayed a relatively normal range (Figure 3A-B). All 3 COVID-19 patients and the DPL patient had elevated Myo-inositol levels, and interestingly, SAE patient showed a decrease (Figure 3A-B). Increased Glx and decreased NAA seen in all five-patients with leukoencephalopathy and markedly increased in COVID-A,B and DPL-patients (Figure 3A-B). Lactate was only increased in COVID-A patient with necrotizing-leukoencephalopathy (Figure 3B). Pearson correlation-coefficients and significances are as follows: Likert scores and decreased NAA/Cr levels (R2 = -0.75,p = 0.03) and a positive trend between Likert Scores and increased Cho/Cr ratios (R2 = 0.55,p = 0.09) (Figure 4).Discussion
The observed increase of Choline, a cell-membrane marker6, in leukoencephalopathy cases, particularly in COVID-A, likely is predominantly related to the presence of demyelination within WM lesions as described in the first neuropathological study in a COVID-19 patient7. In addition, the elevated lactate seen in COVID-A may be due to an anaerobic metabolic environment produced by the well-described "silent hypoxia", where prolonged impaired oxygenation to the subcortical WM is thought to promote anaerobic metabolism leading to elevated tissue lactate8. Axonal damage was also reported in the described COVID-19 neuropathological evaluation7 and could be responsible for the decrease of NAA, which is considered a marker of neuronal-axonal integrity9. Increased levels of Myo-Inositol have been often associated to Choline elevation in demyelinating pathologies10, likely reflecting glial proliferation. Elevated Glx levels have been reported in cases of acute-excitotoxic-leukoencephalopathy11 and viral-associated acute leukoencephalopathy with restricted diffusion12, both conditions thought to be mediated by excitotoxic injury to the cerebral WM and showing prominent reduced diffusivity within WM lesions. The presence of reduced diffusivity was recently reported with COVID-19 leukoencephalopathy13 and was also present in an earlier MRI scan in our COVID-19 case with necrotizing-leukoencephalopathy.Conclusion
The metabolic abnormalities observed for the first time in the setting of COVID-19 associated multifocal-necrotizing-leukoencephalopathy were more pronounced in our study than those observed with DPL. This finding raises the possibility of an additional or alternative underlying mechanism, other than hypoxia-driven processes, contributing to the pathogenesis of COVID-19 associated leukoencephalopathy. Our findings suggest that the metabolic changes in patients with SARS-CoV-2 infection increase with worsening WM changes on conventional anatomic-imaging. However, more evidence is required to validate this conclusion.Acknowledgements
No acknowledgement found.References
1. Cucinotta D, Vanelli M. WHO Declares COVID-19 a Pandemic. Acta Biomed 2020;91(1):157-160.
2. Berlin DA, Gulick RM, Martinez FJ. Severe Covid-19. N Engl J Med 2020.
3. Couzin-Frankel J. The mystery of the pandemic's 'happy hypoxia'. Science 2020;368(6490):455-456.
4. Bray MD, Mullins ME. Metabolic white matter diseases and the utility of MR spectroscopy. Radiol Clin North Am. 2014 Mar;52(2):403-11.
5. Andronesi OC, Gagoski BA, Sorensen AG. Neurologic 3D MR spectroscopic imaging with low-power adiabatic pulses and fast spiral acquisition. Radiology 2012;262(2):647-661.
6. Urenjak J, Williams SR, Gadian DG, et al. Proton nuclear magnetic resonance spectroscopy unambiguously identifies different neural cell types. J Neurosci 1993;13(3):981-989.
7.Reichard RR, Kashani KB, Boire NA, et al. Neuropathology of COVID-19: a spectrum of vascular and acute disseminated encephalomyelitis (ADEM)-like pathology. Acta Neuropathol 2020.
8. Shprecher DR, Flanigan KM, Smith AG, et al. Clinical and diagnostic features of delayed hypoxic leukoencephalopathy. J Neuropsychiatry Clin Neurosci 2008;20(4):473-477
9. Soares DP, Law M. Magnetic resonance spectroscopy of the brain: review of metabolites and clinical applications. Clin Radiol 2009;64(1):12-21.
10. Bitsch A, Bruhn H, Vougioukas V, et al. Inflammatory CNS demyelination: histopathologic correlation with in vivo quantitative proton MR spectroscopy. AJNR Am J Neuroradiol 1999;20(9):1619-1627.
11.Takanashi JI, Murofushi Y, Hirai N, et al. Prognostic value of MR spectroscopy in patients with acute excitotoxic encephalopathy. J Neurol Sci 2020;408:116636.
12. Kamate M. Acute Leukoencephalopathy with Restricted Diffusion. Indian J Crit Care Med 2018;22(7):519-523.
13. Radmanesh A, Derman A, Lui YW, et al. COVID-19 -associated Diffuse Leukoencephalopathy and Microhemorrhages. Radiology 2020:202040.
Figures