1743
Magnetic resonance fingerprinting in two-month-recovered COVID-19 patients1Department of Medical Imaging, Henan Provincial People’s Hospital & the People’s Hospital of Zhengzhou University, Zhengzhou, China, 2MR Collaboration, Siemens Healthcare Ltd., Beijing, China, 3Athinoula A. Martinos Center for Biomedical Imaging, Massachusetts General Hospital, Harvard Medical School, Boston, MA, United States
Synopsis
This study investigated the utility of magnetic resonance fingerprinting (MRF) to detect potential brain changes in recovered COVID-19 patients. MRF T1 and T2 maps of the brains of 8 recovered COVID-19 patients and 8 volunteers were non-linearly normalized into the MNI space to explore the differences between the groups using whole-brain analysis. COVID-19 patients had significantly lower T1 and T2 values in the left superior temporal gyrus, near the hub for the olfaction and gustation systems, and other brain areas. Our findings suggest that SARS-CoV-2 may widely affect the neurological system, and the effect persisted after more than two months.
Introduction
The severe acute respiratory syndrome coronavirus 2 (SARS-CoV-2) has caused a global pandemic of coronavirus disease 2019 (COVID-19) that is ongoing. SARS-CoV-2 may infect the nervous system, causing acute cerebrovascular disease and impaired consciousness [1]. Headache, dizziness, taste and smell dysfunction, and impaired consciousness were the most frequently described neurological symptoms, the latter more often seen among patients with a severe or critical disease course [2]. MR fingerprinting (MRF) [3] has emerged as a novel acquisition and reconstruction strategy that could simultaneously and efficiently obtain multiple quantitative parameter maps including T1 and T2 relaxometry [4]. Although COVID-19 has been shown to affect the brain [5], assessment of micro-structural brain changes using the quantitative T1 and T2 maps derived from MRF has not been characterized in patients with COVID-19. This study evaluated the whole-brain changes of patients who recovered from COVID-19, based on MRF T1 and T2 mapping.Methods
This study enrolled 8 COVID-19 patients (5 males; age range 20 – 57 years, mean age 42.2 ± 14.9 years) who had been recovered for two months (experimental group) and 8 sex- and age-matched healthy controls (HC). All enrolled participants underwent MRIs including the MRF and T1 MP2RAGE sequence on a 3T MAGNETOM Prisma scanner (Siemens Healthcare, Erlangen, Germany) equipped with a 64-channel head/neck coil. A prototype 3D FISP MRF sequence [4](C2P, developed by MGH and ZJU) was performed with the following parameters: FOV = 240 x 240 mm2; voxel size = 1.2 x 1.2 x 1.2 mm3; flip angles varied sinusoidally from 5 to 80 degrees; TR varied between 12 to 13 ms with a Perlin noise pattern; 460 measurements; 160 slices; and acquisition time = 8:49 mins.The MRF T1 and T2 maps were non-linearly registered to the template in the MNI space with the deformation field generated from segmentation of the T1-MP2RAGE-UNI image using SPM12 (https://www.fil.ion.ucl.ac.uk/spm/software/spm12/). Subsequently, the mean values of the T1 and T2 maps were calculated for 96 different cortical regions in the whole brain using masks from the Harvard-Oxford atlas and compared between the COVID-19 group and HC. The Shapiro-Wilk test and Levene’s test were used to evaluate the distribution type and homogeneity of variance. An independent samples t-test was used to compare the groups with SPSS 22.0. P<0.05 was considered statistically significant.Results
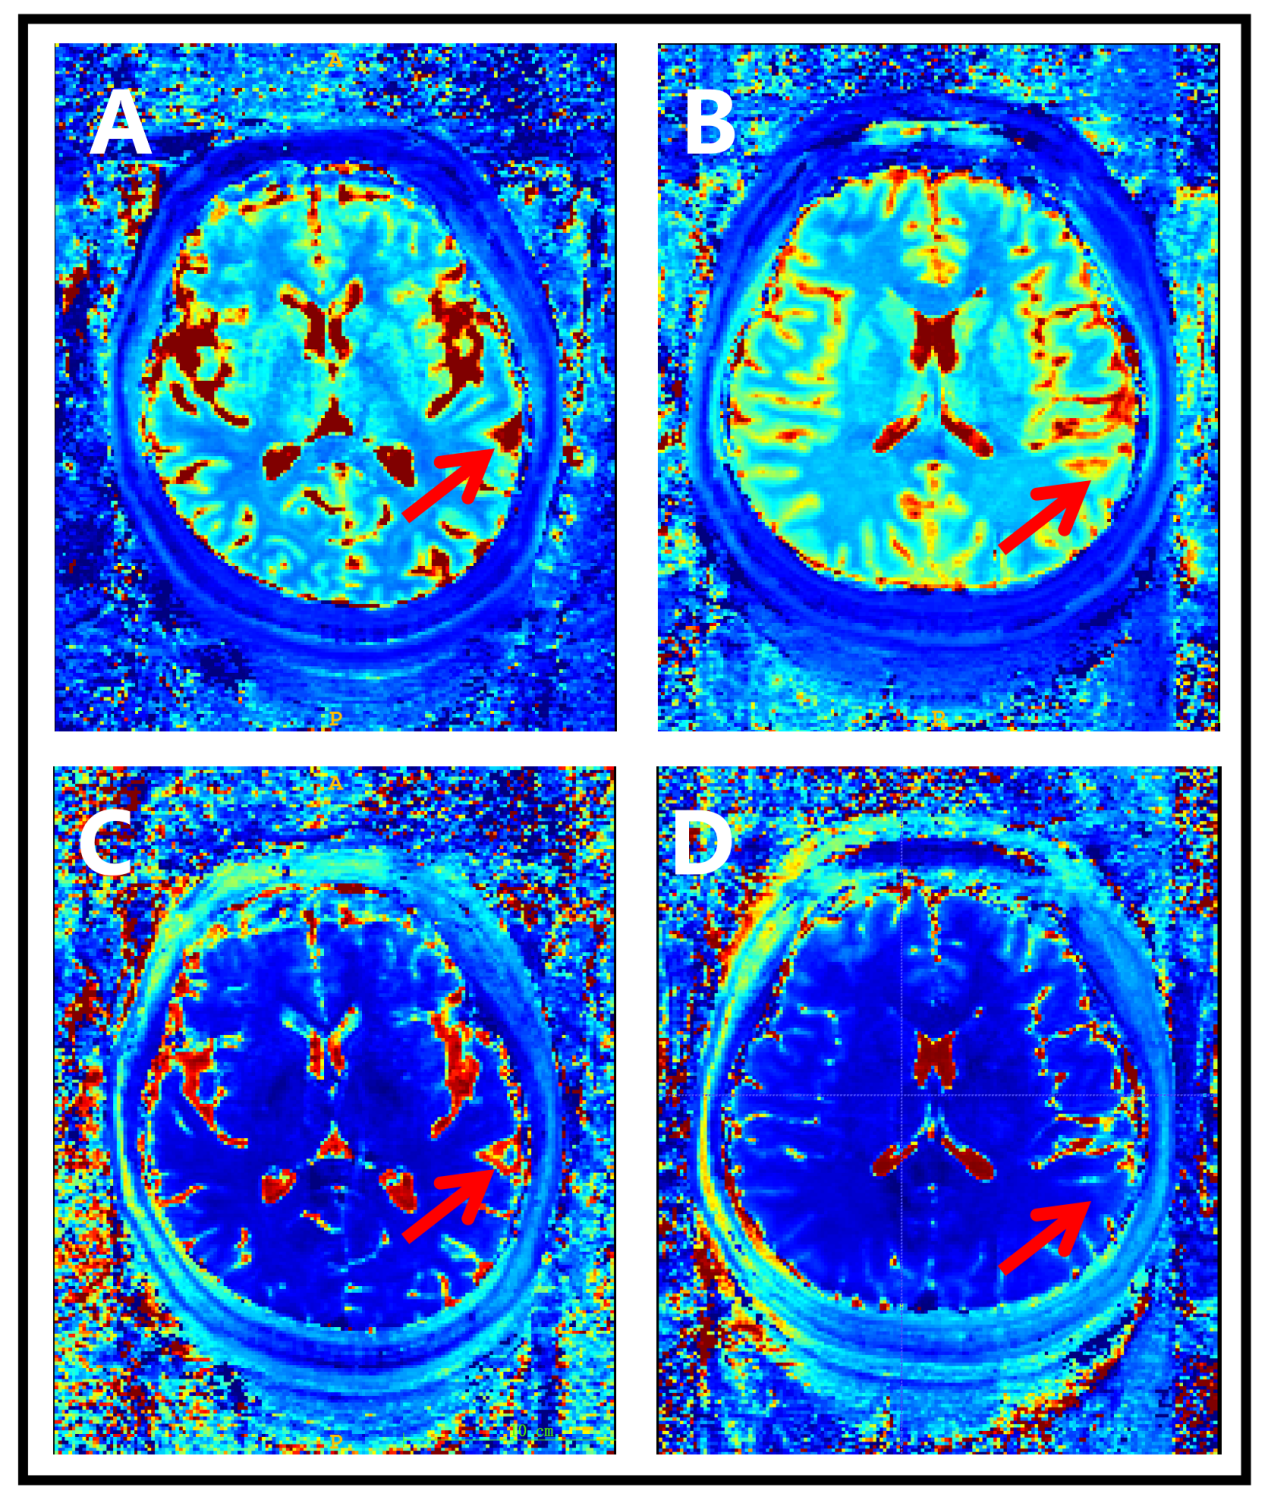
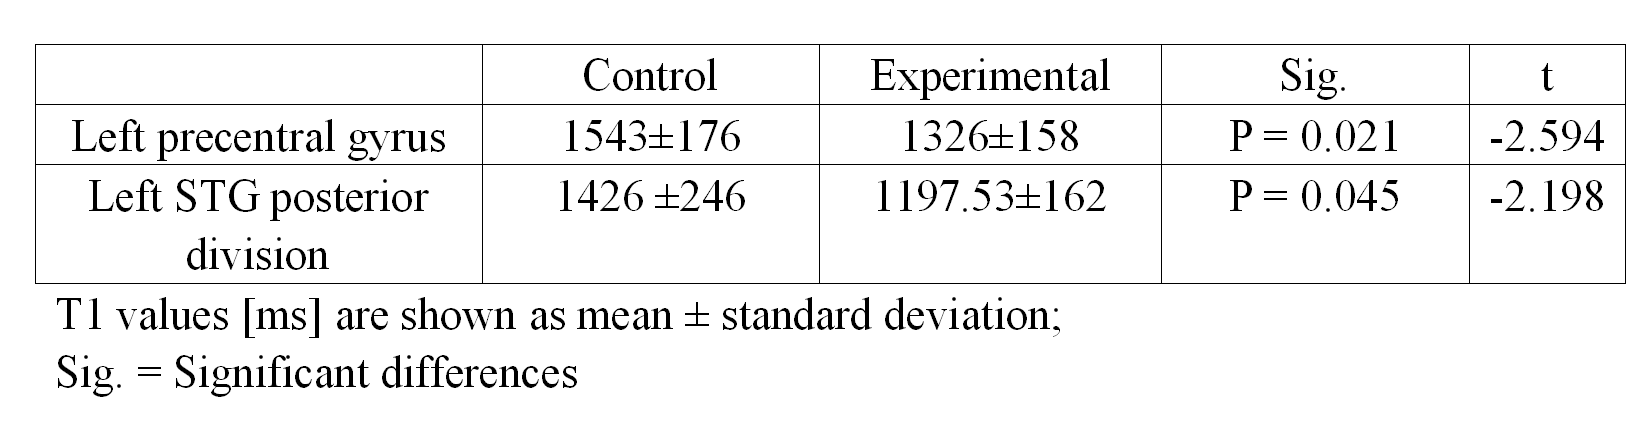
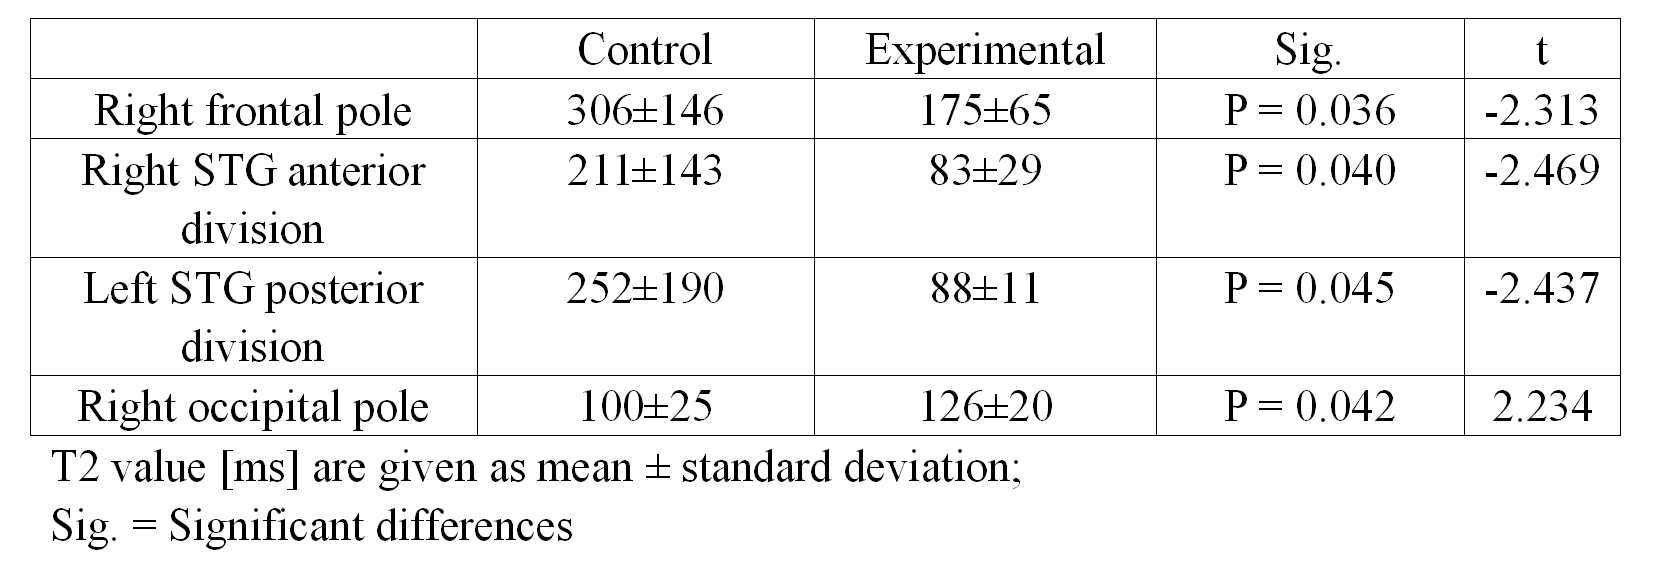
In the MRF T1 map images, COVID-19-recovered patients showed significantly lower T1 values than HC in brain areas such as the left precentral gyrus (1326 ± 159 vs. 1544 ± 176 ms) and the left superior temporal gyrus (STG) posterior division (1197 ± 162 vs. 1426 ± 246 ms), as shown in Table 1. In the MRF T2 map images, COVID-19-recovered patients showed significantly lower T2 values than HC in brain areas such as the right frontal pole (175 ± 65 vs. 306 ± 146 ms), the right STG anterior division (83 ± 29 vs. 211 ± 143 ms), and the left STG posterior division (88 ± 11 vs. 252 ± 190 ms), and significantly higher T2 values than HC in the right occipital pole (126 ± 20 vs. 100 ± 25 ms). The detailed results are shown in Table 2. Both the T1 and T2 maps showed significant differences in the left STG posterior division, and the mean values in COVID-19 patients was significantly lower than in controls (Figure 1).Discussion
SARS-CoV-2 can cause nervous system injury. The severity of neurological symptoms varies, ranging from a temporary loss of smell to more severe symptoms such as dizziness, confusion, seizures, and stroke [6]. Long-term effects, including headaches, fatigue and cognitive impairment, will also be of concern in the future. Imaging observation of patients has unique advantages such as noninvasive and repeatability. There were significant differences between the recovered experimental group and the control group, suggesting that there were brain injuries in the COVID-19 patients. However, the recovery process still needs further study.There were significant differences between the experimental group and the control group in the left STG posterior division. However, there were also some cortical regions with statistically significant differences only in the T1 map or T2 map. This indicates that the T1 and T2 maps can reflect brain structure from different aspects, and both can suggest signs of common problems.Conclusion
The T1 and T2 maps reconstructed from MRF sequences can be used for quantitative analysis of cortical changes. The difference in the mean values of the cortical regions between the experimental group and the control group showed that SARS-CoV-2 may have an effect on brain structure, and the effect still existed more than two months after recovery.Acknowledgements
This paper is supported by the National Key R&D Program of China (2017YFE0103600), National Natural Science Foundation of China (81720108021), Zhongyuan Thousand Talents Plan Project (ZYQR201810117), Zhengzhou Collaborative Innovation Major Project (20XTZX05015).References
[1] Mao, L., Jin, H., Wang, M., Hu, Y., Chen, S., He, Q., Chang, J., Hong, C., Zhou, Y., Wang, D., Miao, X., Li, Y., & Hu, B. (2020). Neurologic Manifestations of Hospitalized Patients with Coronavirus Disease 2019 in Wuhan, China. JAMA Neurology, 77(6), 683–690. https://doi.org/10.1001/jamaneurol.2020.1127
[2] Chen, X., Laurent, S., Onur, O. A., Kleineberg, N. N., Fink, G. R., Schweitzer, F., & Warnke, C. (2020). A systematic review of neurological symptoms and complications of COVID-19. Journal of Neurology, 0123456789. https://doi.org/10.1007/s00415-020-10067-3
[3] Ma, D., Gulani, V., Seiberlich, N., Liu, K., Sunshine, J. L., Duerk, J. L., & Griswold, M. A. (2013). Magnetic resonance fingerprinting. Nature, 495(7440), 187–192. https://doi.org/10.1038/nature11971
[4] Liao, C., Bilgic, B., Manhard, M.K., Zhao, B., Cao, X., Zhong, J., Wald, L.L., Setsompop, K., 3D MR fingerprinting with accelerated stack-of-spirals and hybrid sliding-window and GRAPPA reconstruction, NeuroImage (2017), doi: 10.1016/j.neuroimage.2017.08.030.
[5] Mao, L. , Jin, H. , Wang, M. , Hu, Y. , Chen, S. , & He, Q. , et al. (2020). Neurologic manifestations of hospitalized patients with coronavirus disease 2019 in wuhan, china. JAMA Neurology.
[6] O. Rapalino et al, Brain MR Spectroscopic Findings in 3 Consecutive Patients with COVID-19: Preliminary Observations, American Journal of Neuroradiology (2020). DOI: 10.3174/ajnr.A6877
Figures