1738
Effect of Wearing a Face Mask on fMRI BOLD Contrast1Stanford University, Palo Alto, CA, United States, 2Stanford University, Stanford, CA, United States
Synopsis
The widespread incidence of infection from the novel coronavirus SARS-CoV-2 has prompted many research MRI facilities to require scan subjects to wear masks during scanning in order to diminish the risk of virus transmission. Wearing an efficacious mask will mix some expired air with fresh air, and lead to increased carbon dioxide concentration [CO2] in inspired air. The question we approached is: Since CO2 is a potent vasodilator, does this elevation in [CO2] alter functional MRI (fMRI)?
Introduction
The widespread incidence of infection from the novel coronavirus SARS-CoV-2 has prompted many research MRI facilities to require scan subjects to wear masks during scanning in order to diminish the risk of virus transmission. Wearing an efficacious mask will mix some expired air with fresh air, and lead to increased carbon dioxide concentration [CO2] in inspired air. The question we approached is: Since CO2 is a potent vasodilator, does this elevation in [CO2] alter functional MRI (fMRI)?Methods
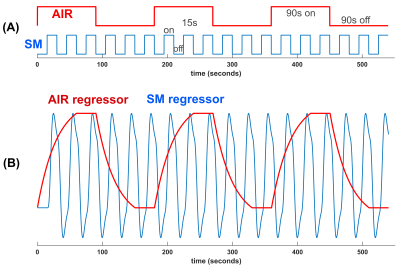
We sought to study whether wearing a mask would induce enough hypercapnia from rebreathing expired air to affect BOLD activation in a task. A robust block design (15s on/off) sensory-sensorimotor (SM) task was used to activate visual, auditory, and sensorimotor regions by tapping fingers, watching flashing checker board, and listening to changing tones. During the scans, medical-grade air (5.8L/min) was supplied to the subject through a nasal cannula, in 90s duration on and off blocks (AIR, Fig.1A). Two scans were collected per subject: one with mask on and one with mask off.Eight healthy subjects were enrolled in the study after giving informed consent for an IRB approved research protocol. A nasal cannula was placed in the subject’s nose under a surgical mask with the metal nose strip removed. During the “mask-off’ scan the mask was slid downward to uncover the nose and mouth. Subjects were able to perform the “mask-off” or “mask-on” maneuver between scans, with minimal head motion. The order of mask-on and mask-off scans was counterbalanced between subjects.
A 3T MRI scanner with 48-channel head coil (GE Premier) was employed. The scanner’s bore fan was turned on at low. Physiological data were acquired along with functional scans using a R2*-weighted spiral-in/out pulse sequence (1): slices/thickness/matrix/TR/TE/volume=32/4mm/64x64/2s/30ms/270.
Postprocessing of timeseries images was performed with homemade and FSL software (2), which included motion correction, detrending, RETROICOR (3) and RVHRCOR (4) corrections, and smoothing=1.5 pixel Gaussian. A GLM with two design regressors (Fig.1B) is used to separately generate activation maps of the sensory-motor (SM) task and hypercapnia (AIR) effect.
To characterize the effect on BOLD contrast due to air manipulation in the timeseries $$$\Delta{S(t)}$$$ a sliding window analysis was performed to test for baseline shift and for task contrast change. Baseline shift $$$\bar{\Delta{S(t)}}$$$ is
$$\bar{\Delta{S(t)}}=\frac{1}{nT}\int_{t-nT/2}^{t+nT/2} \Delta{S(t^{\prime})}dt^{\prime}\qquad\qquad[1]$$
Sliding window task contrast change is approximated by regressing $$$\Delta{S(t)}$$$ with the task design (modeled by a sine wave with frequency 1/T=1/30Hz for SM task):
$$\Delta{C(t)}=\frac{1}{nT}\int_{t-nT/2}^{t+nT/2} \Delta{S(t^{\prime})}sin(\frac{2\pi t^{\prime}}{T})dt^{\prime}\qquad[2]$$
By setting window width to an integer multiple of the task period, $$$\bar{\Delta{S(t)}}$$$ is an estimate of slowly varying task signal amplitude. Changes in $$$\Delta{C(t)}$$$ represent task contrast changes during the scan.
Timeseries, extracted from each scan using an ROI consisting of voxels with SM task activation T-scores>5.0, was submitted to the sliding window analysis in Eq.1,2 for scans with and without mask for each subject.
To quantify the degree to which the time varying task contrast $$$\Delta{C(t)}$$$ and baseline shift $$$\bar{\Delta{S(t)}}$$$ were affected by the airflow modulation, covariation of these signals with the AIR regressor (Fig.1B) were calculated for each subject’s mask-on and mask-off data. The results were expressed as fractional change in task contrast $$$\Delta{C_{f}}$$$and baseline shift $$$\Delta{S_{f}}$$$ (Eq.3,4).
$$\Delta{S_{f}}=\frac{\int \bar{\Delta{S(t)}}\, AIR(t)\, dt}{mean(\Delta{C(t)})\, \int AIR(t)\, dt}\qquad[3]$$
$$\Delta{C_{f}}=\frac{\int {\Delta{C(t)}}\, AIR(t)\, dt}{mean(\Delta{C(t)})\, \int AIR(t)\, dt}\qquad[4]$$
Results
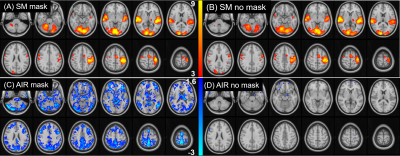
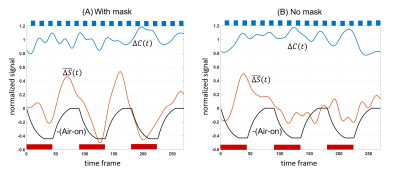
Figure 2 shows group-level SM task and air-on/off responses. SM activation is detected reliably under both mask-on and mask-off conditions (Fig.2A,B) with no significant difference between conditions. Global gray matter deactivation is seen under mask-on and lack of airflow (Fig.2C). Without mask, deactivation is insignificant (Fig.2D).Timeseries for each subject was submitted to the sliding window analysis in Eq.1,2. Figure 3 shows result of averaging these sliding-window timeseries across subjects to obtain the effect of task contrast change $$$\Delta{C}$$$ and baseline signal offset $$$\bar{\Delta{S(t)}}$$$ due to air-flow. Group averaged fractional changes in SM task contrast $$$\Delta{C_{f}}$$$ and fractional changes in baseline shift $$$\Delta{S_{f}}$$$were calculated. With mask on, the average baseline shift was 30.0% (p<0.0141) while the average task contrast change was not significant (2.50%, p=0.43) from covariation with AIR. With mask removed, there was no significant covariation of task contrast (2.0%, p=0.45) or baseline shift (6.5%, p=0.21) with AIR.
Conclusion
A nasal cannula was employed to replace expired air with fresh air in a block design, thereby allowing controlled manipulation of endogenous [CO2] levels during a sensory-motor task in two separate scans (one with mask and one without mask). Introducing air into the mask approximates the no-mask [CO2] condition, but may introduce a potential confound of small cognitive effects of the airflow. Nevertheless, our results confirm that wearing a mask increases the BOLD baseline signal (average=30%) through reduced R2*, but the effect does not substantively alter task activation with and without mask. The effect of increased [CO2] and global gray matter activation changes from wearing a mask is the same phenomenon as in a CO2 gas challenge (5) or breath holding (6). In addition, a separate capnography measurement on our subjects with and with mask shows an average increase in end tidal CO2 of 7.4%, similar to observation made with N95 masks (7).Acknowledgements
NIH R01 NS109450, P41 EB0015891.References
1. Glover GH, Law CS. Spiral-in/out BOLD fMRI for increased SNR and reduced susceptibility artifacts. Magn Reson Med 2001;46:515–522.
2. Woolrich MW, Jbabdi S, Patenaude B, et al. Bayesian analysis of neuroimaging data in FSL. NeuroImage 2009;45:S173-86 doi: 10.1016/j.neuroimage.2008.10.055.
3. Glover GH, Li TQ, Ress D. Image-based method for retrospective correction of physiological motion effects in fMRI: RETROICOR. Magn Reson Med 2000;44:162–167.
4. Chang C, Cunningham JP, Glover GH. Influence of heart rate on the BOLD signal: the cardiac response function. NeuroImage 2009;44:857–69 doi: 10.1016/j.neuroimage.2008.09.029.
5. Wise RG, Pattinson KTS, Bulte DP, et al. Dynamic forcing of end-tidal carbon dioxide and oxygen applied to functional magnetic resonance imaging. J. Cereb. Blood Flow Metab. 2007;27:1521–1532 doi: 10.1038/sj.jcbfm.9600465.
6. Kastrup A, Li TQ, Glover GH, Moseley ME. Cerebral blood flow-related signal changes during breath-holding. AJNR Am J Neuroradiol 1999;20:1233–1238.
7. Bharatendu C, Ong JJY, Goh Y, et al. Powered Air Purifying Respirator (PAPR) restores the N95 face mask induced cerebral hemodynamic alterations among Healthcare Workers during COVID-19 Outbreak. Journal of the Neurological Sciences 2020;417:117078 doi: 10.1016/j.jns.2020.117078.
Figures


