1736
Utilizing hyperpolarised xenon MRI to detect gas transport deficiencies in post-COVID lungs1Physiology, Anatomy, and Genetics, University of Oxford, Oxford, United Kingdom, 2Centre for Magnetic Resonance, University of Oxford, Oxford, United Kingdom, 3Radiology, Oxford NHS Foundation Trust, Oxford, United Kingdom, 4POLARIS, University of Sheffield, Sheffield, United Kingdom, 5Oxford Interstitial Lung Disease Service, Oxford NHS Foundation Trust, Oxford, United Kingdom, 6MRC Human Immunology Unit, University of Oxford, Oxford, United Kingdom
Synopsis
Test
Introduction
SARS-CoV-2 targets ACE2 expressing cells in the respiratory tract. Persistent breathlessness in patients many months post-infection is well recognised. Hyperpolarised 129Xe MRI enables regional investigation of pulmonary ventilation, microstructure and gas transfer across the alveolar epithelium into the blood stream(1). An initial study has demonstrated abnormal gas transfer in acutely unwell patients with COVID-19 infection(2).Methods
The study was approved by our local ethical board (20/NW/0235), and participants enrolled between August and December 2020. Patients were recruited from local respiratory medicine clinics, with the following criteria:Patients have had a positive PCR result for COVID-19, have been hospitalised for COVID, and discharged from hospital for 3 months. Patients must not have been ventilated in hospital. Volunteers were recruited from local staff who had not had a positive PCR result for COVID-19 and no history of cardio or respiratory disease. All patients had unenhanced inspiratory volumetric CT performed at 1 litre inspiration, expiratory CT, hyperpolarised dissolved phase Xenon lung MRI, lung function, and standard biochemistry and haematology test. All volunteers underwent dissolved phase hyperpolarised Xenon MRI.
129Xe gas (86% 129Xe, Spectra Gases Inc.) was polarised as previously described(3). Hyperpolarised 129Xe was given within 10 minutes of production to participants who were lying supine in the MRI scanner(3). Hyperpolarised Xenon imaging was performed on a 1.5T GE system (HDx) with imaging performed on a dedicated 129Xe thorax coil (CMRS) and the 1H body coil (GE Healthcare). Images were acquired with a flyback radial acquisition, acquired image resolution of 2.1cm3, reconstructed resolution of 1.05cm3, repetition time per spoke = 23ms, flip angle per excitation (dissolved/gas phase, 40 and 0.7 degrees, respectively), number of echoes = 4, echo time shift = 0.7ms using the sequence described in (4). Gas, Tissue/Plasma (TP), and Red Blood Cell (RBC) images were reconstructed via direct inversion of the Fourier matrix (5,6).
CT scanning was performed using a Revolution CT GE scanner. Inspiratory volumetric scans were performed following inspiration of room air from a 1-litre Tedlar® bag and reviewed at 0.625 mm section thickness. Expiratory scans were performed with 0.625 mm sections at 30 mm intervals. The CT scans were reviewed on a PACS workstation, and the presence of ground-glass opacification, reticulation, traction bronchial dilatation, honeycombing scored using a 5-point scale of 0 as normal, and 5 as more than 75% of the section scored as involved. CT scans were scored by an observer with more than 5 years of radiological experience, blinded to the hyperpolarised imaging.
Image analysis
The noise level for each image was calculated on a slice-by-slice basis. Voxels in the TP mask that were less than 5 times the median noise level in the slice were discarded. Ratiometric maps (RBC:TP) were calculated.
Statistical analysis
A Wilcoxon rank sum test was used to compare RBC:TP between healthy and patient groups. Hodge’s effect size was calculated. Spearman’s correlation was performed between RBC:TP and spirometry/Hb/D-Dimer results. A p-value of 0.05 was considered significant, analysis performed in R.
Results
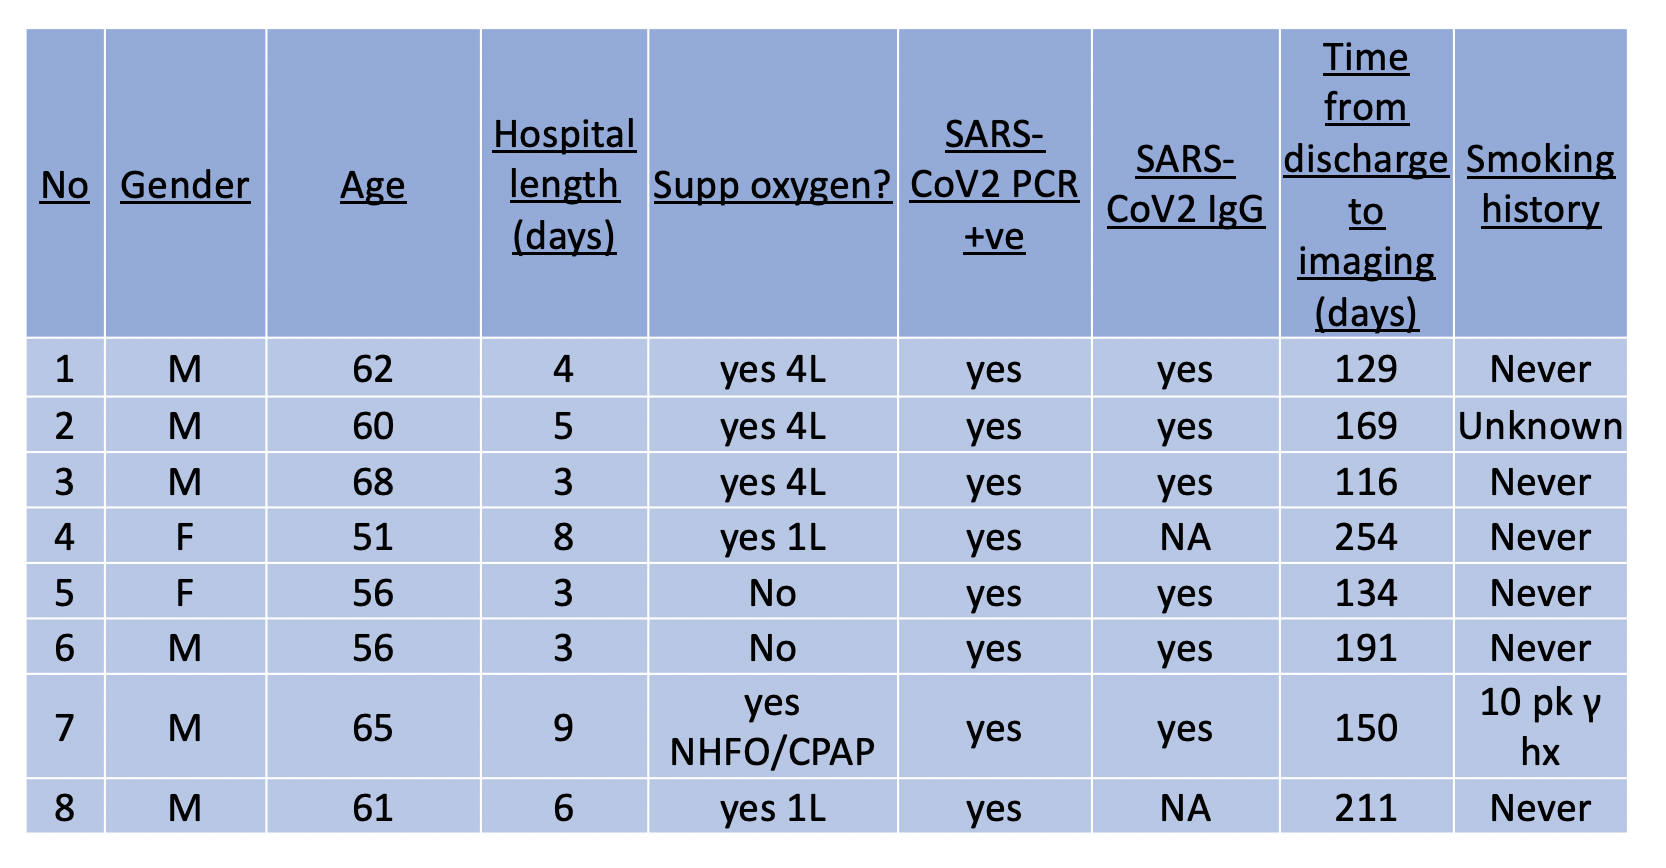
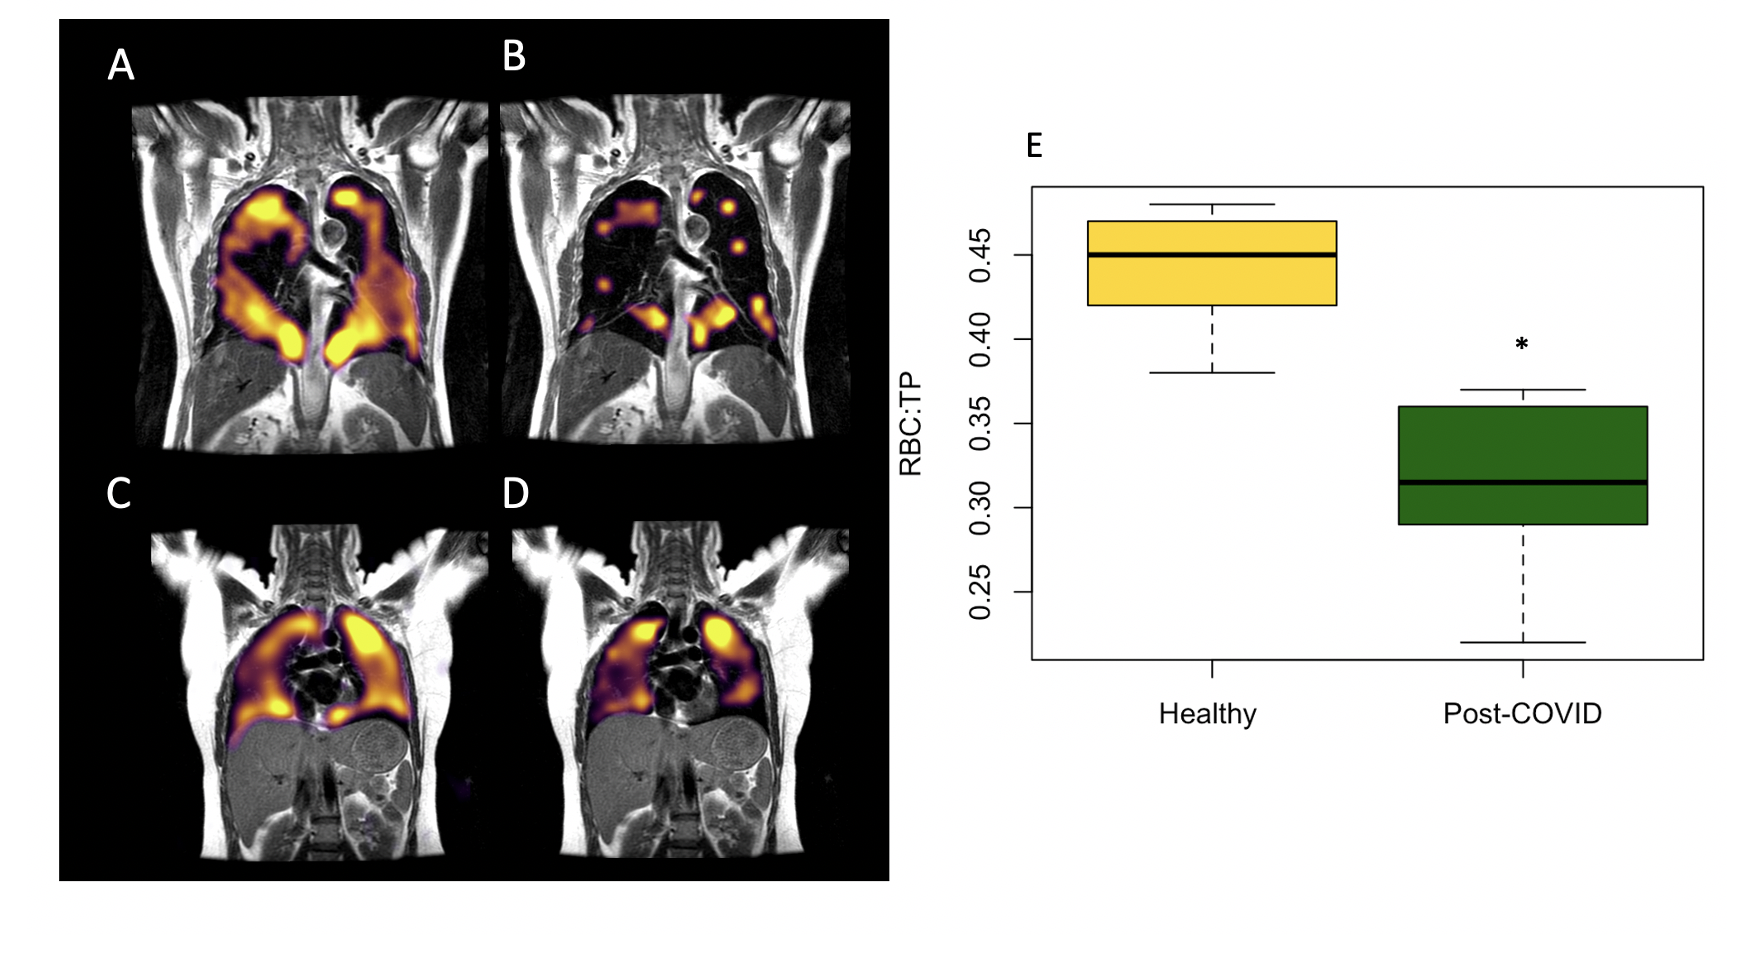
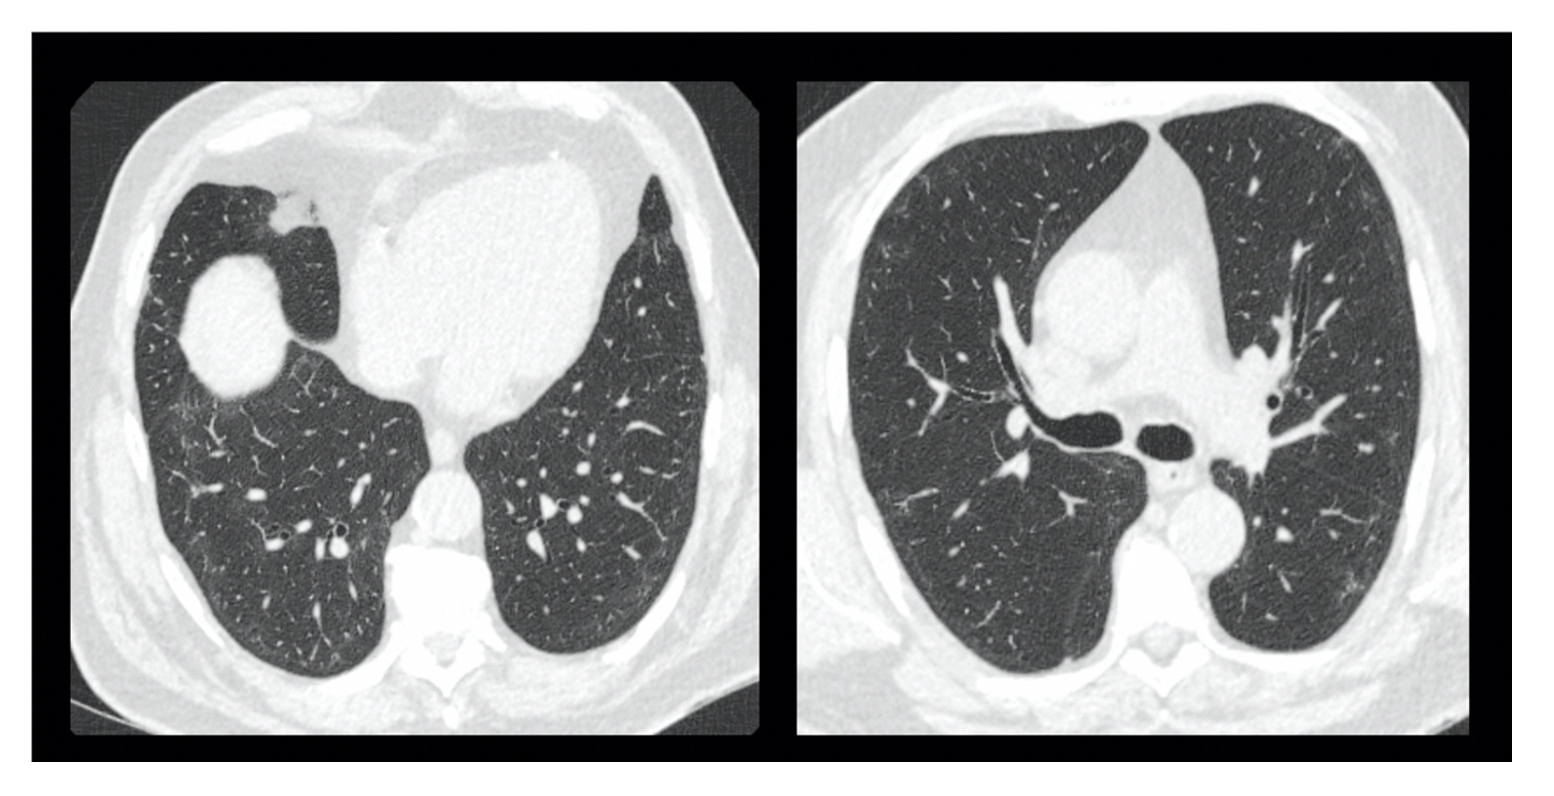
8 patients (61+-5 years, Male =5) and 5 healthy volunteers (29 +- 3 years, Female = 5) were recruited. Patient demographics are found in Table 1. Dissolved phase imaging revealed impairment in the transport of gas from the T/P to the red blood cells in patients, but not in volunteers. In contrast, patients and volunteers exhibited good ventilation of the lungs with 129Xe gas (Figure 2A-D).Analysis of RBC:TP phase imaging revealed a significant difference between healthy and post-COVID lungs (0.45 +- 0.1 vs 0.32 +- 0.1, p<0.05, Hodge’s effect size = 1.36 (Figure 2E). Patients had normal or near normal CT scans, mean CT score = 3/25 +- 2/25 (Figure 3).
There were significant negative correlations between the RBC:TP imaging and carbon monoxide diffusing capacity (r = 0.87, p<0.05) and D-dimer (r = -0.71, p<0.05). There were no significant correlations between RBC:TP and other spirometry or demographic features.
Discussion
These results suggest a hidden burden of disrupted gas transport in the lungs of patients post-COVID-19 pneumonia that were not detectable by conventional CT imaging or lung function tests. This provides a potential explanation for some of the symptoms of residual breathlessness experienced by patients after COVID-19 infection. This study is limited by a small sample size for both patient and volunteer groups.These preliminary results highlight the role of hyperpolarised Xenon as a sensitive regional imaging modality in patients post COVID-19 pneumonia. As it does not pose a radiation burden to the patient and can be completed in a single breathold exam, this is a particularly attractive test for patients. Larger studies, particularly longitudinal work investigating the acute and recovery phase of the infection will provide valuable information on the extent to which gas exchange units in the lungs are affected and the time it takes for regeneration and recovery to occur.
Conclusion
This study has demonstrated that hyperpolarised Xenon MRI can detect gas transport deficiencies in patients post-COVID, potentially explaining the reports of breathlessness many months after acute illness. The results also demonstrate that hyperpolarised Xenon MRI can detect damage to lungs that would be normally considered normal or nearly-normal on CT.Acknowledgements
No acknowledgement found.References
1. Doganay O, Matin TN, Mcintyre A, et al. Fast dynamic ventilation MRI of hyperpolarized 129Xe using spiral imaging. Magn Reson Med. 2018;79(5):2597–2606. doi: 10.1002/mrm.26912.
2. Li H, Adv S, Li H, et al. Damaged lung gas-exchange function of discharged COVID-19 patients detected by hyperpolarized 129 Xe MRI. Sci Adv. 2020;8180(November):1–14. doi: 10.1126/sciadv.abc8180.
3. Chen M, Doganay O, Matin T, et al. Delayed ventilation assessment using fast dynamic hyperpolarised Xenon-129 magnetic resonance imaging. Eur Radiol. European Radiology; 2020;30(2):1145–1155. doi: 10.1007/s00330-019-06415-1.
4. Collier GJ, Eaden JA, Hughes PJC, et al. Dissolved 129Xe lung MRI with four-echo 3D radial spectroscopic imaging: Quantification of regional gas transfer in idiopathic pulmonary fibrosis. Magn Reson Med. 2020;(October):1–12. doi: 10.1002/mrm.28609.
5. Wiesinger F, Weidl E, Menzel MI, et al. IDEAL spiral CSI for dynamic metabolic MR imaging of hyperpolarized [1-13C]pyruvate. Magn Reson Med. 2012;68(1):8–16. doi: 10.1002/mrm.23212.
6. Collier G, Eaden J, Hughes P, et al. Dissolved 129Xe lung MRI with 4-echo 3D radial spectroscopic imaging: quantification of regional gas transfer in idiopathic pulmonary fibrosis. Magn Reson Med. 2020;1(1):1–5.
Figures