1735
Quantitative assessment demonstrates renal changes in COVID-19 recovered patients1The Fifth Affiliated Hospital of Sun Yat-sen University, Zhuhai, China, 2MR Research, GE Healthcare, Beijing, China, 3Stony Brook Medicine, Stony Brook, New York, NY, United States
Synopsis
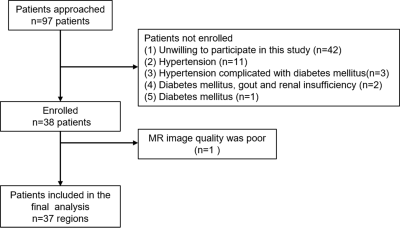
Renal injury has been commonly observed in patients with COVID-19. The effect of the virus on kidneys in COVID-19 recovered patients remains unclear. Thirty-seven COVID-19 recovered patients were Prospectively collected. And 37 sex- and age-matched normal controls (NC) were enrolled. T1 mapping, T2 mapping, BOLD and IVIM for each participant were acquired using 3.0T MRI. The COVID-19 recovered patients demonstrated abnormal renal T1 and T2 and R2* values, which may be associated with subclinical renal injury due to COVID-19.
Introduction
Renal injury has been commonly observed in patients with COVID-191-6. The effect of the virus on kidneys in COVID-19 recovered patients remains unclear. This research was to explore the value of the T1mapping, T2 mapping, Blood oxygenation level-dependent (BOLD) and intravoxel incoherent motion (IVIM) parameters in the detection of subclinical renal injury in COVID-19 recovered patients and provide guidance for clinical diagnosis and treatment7-11.Methods
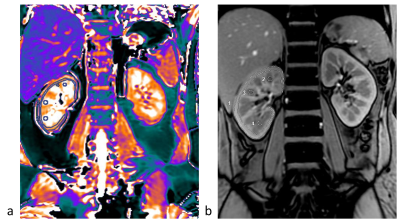
Thirty-seven COVID-19 recovered patients were Prospectively collected from Feb 18, 2020, to Mar 5, 2020. And 37 sex- and age-matched normal controls (NC) were enrolled. All patients underwent an MRI examination. T1 mapping, T2 mapping, BOLD and IVIM for each participant were acquired using 3.0T MRI. T1, T2, R2* values and IVIM measurements of the renal cortex and medulla were measured independently by two radiologists12. The intra-group correlation coefficient (ICC) was used to evaluate interobserver consistency. Two-sample t-test was performed on T1, T2, R2* values and IVIM parameters to identify significant differences among the two groups. Sperman correlation analysis was used to estimate the association between T1, T2, R2* values and IVIM parameters and laboratory test values.Results
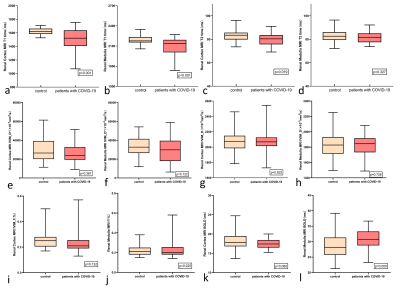
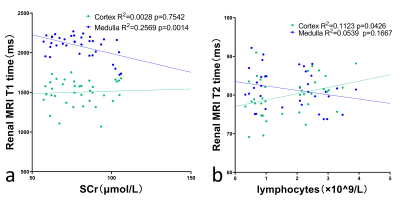
The renal T1, T2, R2* values and IVIM parameters measured by two radiologists showed good agreement. Significant differences were observed in T1 values of the renal cortex and medulla between COVID-19 recovered and NC groups. Both cortical and medullary T1 values were higher in NC group than those in COVID-19 recovered groups.The R2* values of medulla in COVID-19 groups were significantly higher than those in NC groups (P=0.005).The IVIM parameters were not found to be statistically different between the two groups. The R2* values of medulla in COVID-19 groups were significantly higher than those in NC groups (P=0.005). A negative correlation was found between Creatinine and renal medulla of T1 values (R2=0.2569, P=0.0014), and the renal T2 value of cortex was correlated with the lymphocyte (R2=0.058, P=0.0426).Discussion
T1 value decreased in COVID-19 recovered patients compared to NC group. The possible pathological basis is that protein exudation can be seen in the glomerular saccular cavity in COVID-19 as well 1,4, which could shorten the T1 value.T2 value of the renal cortex in COVID-19 recovered patients were lower than that in the NC group. The possible reason was that COVID-19 recovered patients might have renal hypoxia.The R2* of the medulla of COVID-19 recovered patients to be higher than those of the normal control group, the renal medulla is highly sensitive to the injury of ischemia and hypoxia13.There was no significant statistical difference in D value, D * value and f value between the control groups and the COVID-19 groups. This result suggests that renal diffusion and perfusion of COVID-19 recovered patients are not greatly affected.A negative correlation was found between Creatinine and renal medulla T1 values using Pearson correlation analysis, these results reflect the fact that we still do not understand enough about the effects of COVID-19 on the kidney, and further longitudinal study is needed.Conclusion
The COVID-19 recovered patients demonstrated abnormal renal T1 and T2 and R2* values, which may be associated with subclinical renal injury due to COVID-19.Acknowledgements
We thank all of the emergency services, nurses, doctors, and other hospital staff for their efforts in fighting the COVID-19 outbreak. We also thank the nephrologists for collating and analyzing the clinical data.References
[1] National Health Commission of the People’s Republic of China. Guideline for the diagnosis and treatment of COVID-19 infections (version 1–7). 2020. http://www.nhc.gov.cn/yzygj/zcwj2/new_zcwj.shtml (accessed March 9, 2020)
[2] Sun J, Zhu A, Li H, Zheng K, et al. Isolation of infectious SARS-CoV-2 from urine of a COVID-19 patient. Emerging Microbes & Infections. 2020;9(1):991-3.
[3] Hua Su, Ming Yang, Cheng Wan, et al. Renal histopathological analysis of 26 postmortem findings of patients with COVID-19 in China. Kidney International 2020.
[4] Xiu-Wu Bian, the COVID-19 Pathology Team, Autopsy of COVID-19 victims in China, National Science Review, nwaa123.
[5] Mohamed MMB, Lukitsch I, Torres-Ortiz AE, et al. Acute kidney injury associated with coronavirus disease 2019 in Urban New Orleans. Kidney 360. 2020;1(4)
[6] Cheng Y, Luo R, Wang K, et al. Kidney disease is associated with in-hospital death of patients with COVID-19. Kidney International. 2020 doi: 10.1101/2020.02.18.20023242. [10] Li Z, Wu M, Guo J, et al. Caution on Kidney Dysfunctions of 2019-nCoV Patients. medRxiv preprint.
[7] Chandarana H, Lee V S. Renal Functional MRI: Are We Ready for Clinical Application? [J]. American Journal of Roentgenology, 2009, 192(6):1550-1557.
[8] Wolf M, de Boer A, Sharma K, et al. Magnetic resonance imaging T1- and T2-mapping to assess renal structure and function: a systematic review and statement paper. Nephrol Dial Transplant. 2018 Sep 1;33(suppl_2): ii41-ii50.
[9] Shah B, Anderson SW, Scalera J, et al. Quantitative MR imaging: physical principles and sequence design in abdominal imaging. Radiographics. 2011; 31:867Y880.
[10] Thoeny HC, Zumstein D, Simon-Zoula S, et al. Functional evaluation of transplanted kidneys with diffusion-weighted and BOLD MR imaging: initial experience. Radiology 2006;241(3):812–821.
[11] Hueper K, Peperhove M, Rong S, et al. T1-mapping for assessment of ischemia-induced acute kidney injury and prediction of chronic kidney disease in mice. European Radiology, 2014, 24(9).
[12] Zhong-Yuan Cheng, You-Zhen Feng, Jun-Jiao Hu, et al, Intravoxel Incoherent Motion Imaging of the Kidney: The Application in Patients With Hyperuricemia. J Magn Reson Imaging 2020; 51:833-840.
[13] Brezis, Mayer, Rosen, et al. Hypoxia of the Renal Medulla — Its Implications for Disease[J]. New England Journal of Medicine, 1995, 332(10):647-655.
Figures


