1733
Comparing Methods for Ultra-High Resolution Structural Imaging of Human Olfactory Bulb and Tract at 3T
Sichen Ludwig Zhao1,2, Jay A Gottfried2, John A Detre2, and M Dylan Tisdall3
1Bioengineering, School of Engineering and Applied Science, University of Pennsylvania, Philadelphia, PA, United States, 2Neurology, Perelman School of Medicine, University of Pennsylvania, Philadelphia, PA, United States, 3Radiology, Perelman School of Medicine, University of Pennsylvania, Philadelphia, PA, United States
1Bioengineering, School of Engineering and Applied Science, University of Pennsylvania, Philadelphia, PA, United States, 2Neurology, Perelman School of Medicine, University of Pennsylvania, Philadelphia, PA, United States, 3Radiology, Perelman School of Medicine, University of Pennsylvania, Philadelphia, PA, United States
Synopsis
The olfactory bulbs (OBs) and tracts transmit odor information from the nose to the brain and plays a key role in learning, memory, and emotion. In vivo imaging of the human olfactory bulbs (OBs) is inherently challenging due to their limited size and high susceptibility gradients at the basal frontal lobes. We compare three sequences (T2 SPACE, CISS, and T1-weighted PETRA) to produce the highest-resolution (440um) structural images of the human olfactory bulb at 3 T. We demonstrate that these images offer robust visualization of the olfactory bulbs and tracts that projects to the medial temporal lobes.
Introduction
The olfactory bulbs (OBs) and tracts (OTs) transmit odor information from the nose to the brain and play a key role in learning, memory, and emotion1. However, the OBs are extremely challenging to image, due to their small size and location at the air/tissue interface of the ethmoid sinuses2. A few prior studies have reported in vivo MRI of human OBs2-6. Even fewer studies have attempted to resolve the OTs that project from the OBs to the medial temporal lobe (MTL)7. An optimal approach for imaging OBs and tracts would provide sufficient resolution and contrast to resolve and differentiate gray matter, white matter, vessels, and CSF, and sufficient resistance to susceptibility artifacts to visualize the entire OBs and OTs.Toward this goal, we compare new, ultra-high-resolution protocols with three different MR sequences with low sensitivity to susceptibility gradients: T2 SPACE8, CISS9, and T1-weighted inversion-recovery PETRA10.
Methods
Data acquisitionThe parameters of three 3D-encoded sequences were:
- 440um isotropic T2 SPACE; TE 282ms, TR 2000ms, bandwidth 260Hz/px, field of view (FOV) 256mm x 52.48mm x 31.68mm, 4 averages, and turbo factor 80, TA 23:30,
- 440um isotropic CISS; TE 3.5ms, TR 6.99ms, bandwidth 434Hz/px, FOV 256mm x 216.06mm x 42.24mm, FA 60deg, and 2 averages, TA 23:33,
- 500um isotropic T1 PETRA; TR 4.90ms/2250ms, TI 1300ms/900ms, bandwidth 245Hz/px, FA 6deg, FOV 225mm x 225mm x 225mm, and turbo factor 275, TA 34:36.
Two subjects, having given informed consent, were scanned with all three protocols in a 3T scanner (MAGNETOM Prisma, Siemens Healthineers, Erlangen, Germany) using the vendor’s 64-channel head and neck coil.
OT Segmentation
T2 SPACE and T1 PETRA were registered to the CISS volumes. The OBs and OTs were manually segmented and visualized in 3D with ITK-SNAP11.
Results
Figure 1 shows images from all sequences in a single subject. While all sequences resolve the OBs, CISS demonstrates superior contrast for the OBs and OTs. Figure 2 shows the axial view for all three methods. In sinus regions, where susceptibility gradients worsen, CISS presents residual banding artifacts. T2 SPACE shows signal dropout in these regions, although not within the OB itself. Of note, T1 PETRA shows minimal susceptibility artifact, visualizing bone, cartilage, and blood vessels, which are absent from the CISS and T2 SPACE. Figure 3 compares OB SNR and surrounding CSF SNR of the sequences.Figure 4 shows a set of results from a subject with smaller and less-apparent OBs. The conventional T2 SPACE fails to identify the OBs, while CISS presents a strong contrast to the surroundings. Similar to Figure 1, T1 PETRA also shows clear OBs, but with less contrast and resolution.
Lastly, based on co-registration of all three high-resolution images, we traced the olfactory tract from OBs to the MTL, which has previously only been shown in substantially lower-resolution data, and not beyond the level of the olfactory trigone7. Figure 5 shows the rendered 3D structure after segmentation and reconstruction.
Discussion
We have optimized and compared three methods to maximize the resolution and sensitivity of structural olfactory system imaging. Our results show the highest-resolution 3T images to date, and suggest that these ultra-high-resolution scans may help detect olfactory structures in subjects with smaller OBs.CISS is based on bSSFP, combing data acquired with two opposed phase cycles to minimize banding artifacts9. However, due to the increased repetition time necessitated by the high-resolution acquisition, CISS fails to fully cancel out the banding artifacts around the sinuses using just two phase cycles (see Figure 2). Future work will use additional phase cycles to further reduce these artifacts.
Previous studies have shown that the volume of OBs varies significantly between subjects3,4. Moreover, there are several reported cases of subjects with normal olfactory function but no apparent OBs in T2 SPACE images. We speculate these cases may be due to limitations in imaging rather than a true lack of OBs. Ultra-high resolution OB and OT imaging would allow us to explore such cases, and better map the fine details of the human olfactory system in vivo. This will in turn support future functional OB studies12.
Conclusion
We have evaluated MR protocols that achieve the highest-resolution 3T in vivo OB and OT imaging to date, visualizing the OTs between OBs and the MTL. Future studies will focus on reducing artifacts and overall scan time in CISS, as well as exploring the feasibility and utility of even higher-resolution protocols. We will also continue to explore the utility of UTE sequences, focusing on those that more easily support restricted FOVs.Acknowledgements
This work was supported by the National Institutes of Health under award number P41EB015893.References
- Gottfried, J. A. Smell: central nervous processing. Adv Otorhinolaryngol 63, 44-69, doi:10.1159/000093750 (2006).
- Burmeister, H. P. et al. Reproducibility and Repeatability of Volumetric Measurements for Olfactory Bulb Volumetry: Which Method Is Appropriate? An Update Using 3 Tesla MRI. Acad Radiol 18, 842-849, doi:10.1016/j.acra.2011.02.018 (2011).
- Hummel, T. et al. Correlation between olfactory bulb volume and olfactory function in children and adolescents. Exp Brain Res 214, 285-291, doi:10.1007/s00221-011-2832-7 (2011).
- Nguyen, A. D. et al. Olfactory sulcal depth and olfactory bulb volume in patients with schizophrenia: an MRI study. Brain Imaging Behav 5, 252-261, doi:10.1007/s11682-011-9129-0 (2011).
- Fournel, A. et al. A methodological investigation of a flexible surface MRI coil to obtain functional signals from the human olfactory bulb. J Neurosci Methods 335, 108624, doi:10.1016/j.jneumeth.2020.108624 (2020).
- Weiss, T. et al. Human Olfaction without Apparent Olfactory Bulbs. Neuron 104, 1023, doi:10.1016/j.neuron.2019.11.017 (2019).
- Tsutsumi, S., Ono, H. & Yasumoto, Y. Visualization of the olfactory nerve using constructive interference in steady state magnetic resonance imaging. Surg Radiol Anat 39, 315-321, doi:10.1007/s00276-016-1731-9 (2017).
- Mugler, J. P. et al. Optimized single-slab three-dimensional spin-echo MR imaging of the brain. Radiology 216, 891-899, doi:DOI 10.1148/radiology.216.3.r00au46891 (2000).
- Elliott, A. M., Bernstein, M. A., Ward, H. A., Lane, J. & Witte, R. J. Nonlinear averaging reconstruction method for phase-cycle SSFP. Magn Reson Imaging 25, 359-364, doi:10.1016/j.mri.2006.09.013 (2007).
- Grodzki, D. M., Jakob, P. M. & Heismann, B. Ultrashort echo time imaging using pointwise encoding time reduction with radial acquisition (PETRA). Magn Reson Med 67, 510-518, doi:10.1002/mrm.23017 (2012).
- Yushkevich, P. A. et al. User-guided 3D active contour segmentation of anatomical structures: significantly improved efficiency and reliability. Neuroimage 31, 1116-1128, doi:10.1016/j.neuroimage.2006.01.015 (2006).
- Parrish, T., Chen, Y., Li, W., Howard, J. & Gottfried, J. in Proceedings of International Society of Magnetic Resonance in Medicine. 3567.
Figures

Figure 1: A Comparison Among Three Different Sequences in a Single Subject. T2 SPACE, CISS, and T1 PETRA all show clear OBs and their surrounding regions but with different contrast. a, d, g: axial view. b, e, h: coronal view. c, f, i: sagittal view. OBs are marked with arrows.

Figure 2: A Comparison Among T2 SPACE, CISS, and T1 PETRA in Regions of High Susceptibility. Eight axial slices are shown here for 3 different sequences at the same position near the air interface. CISS shows worse banding artifacts and T2 SPACE shows signal dropout, while T1 PETRA does not have a significant effect. a) Eight axial slices for all three sequences (artifacts marked by arrow). b) A sagittal view of the subject to demonstrate the position of the slices.

Figure 3: Performance Comparison of Three Sequences. All three sequences provide a clear contrast between OBs and the surroundings. T2 SPACE and T1 PETRA can visualize the blood vessels while CISS has the highest grey matter/white matter (GM/WM) contrast and OB/CSF contrast. T2 SPACE and CISS also present different minor artifacts in high susceptibility regions.
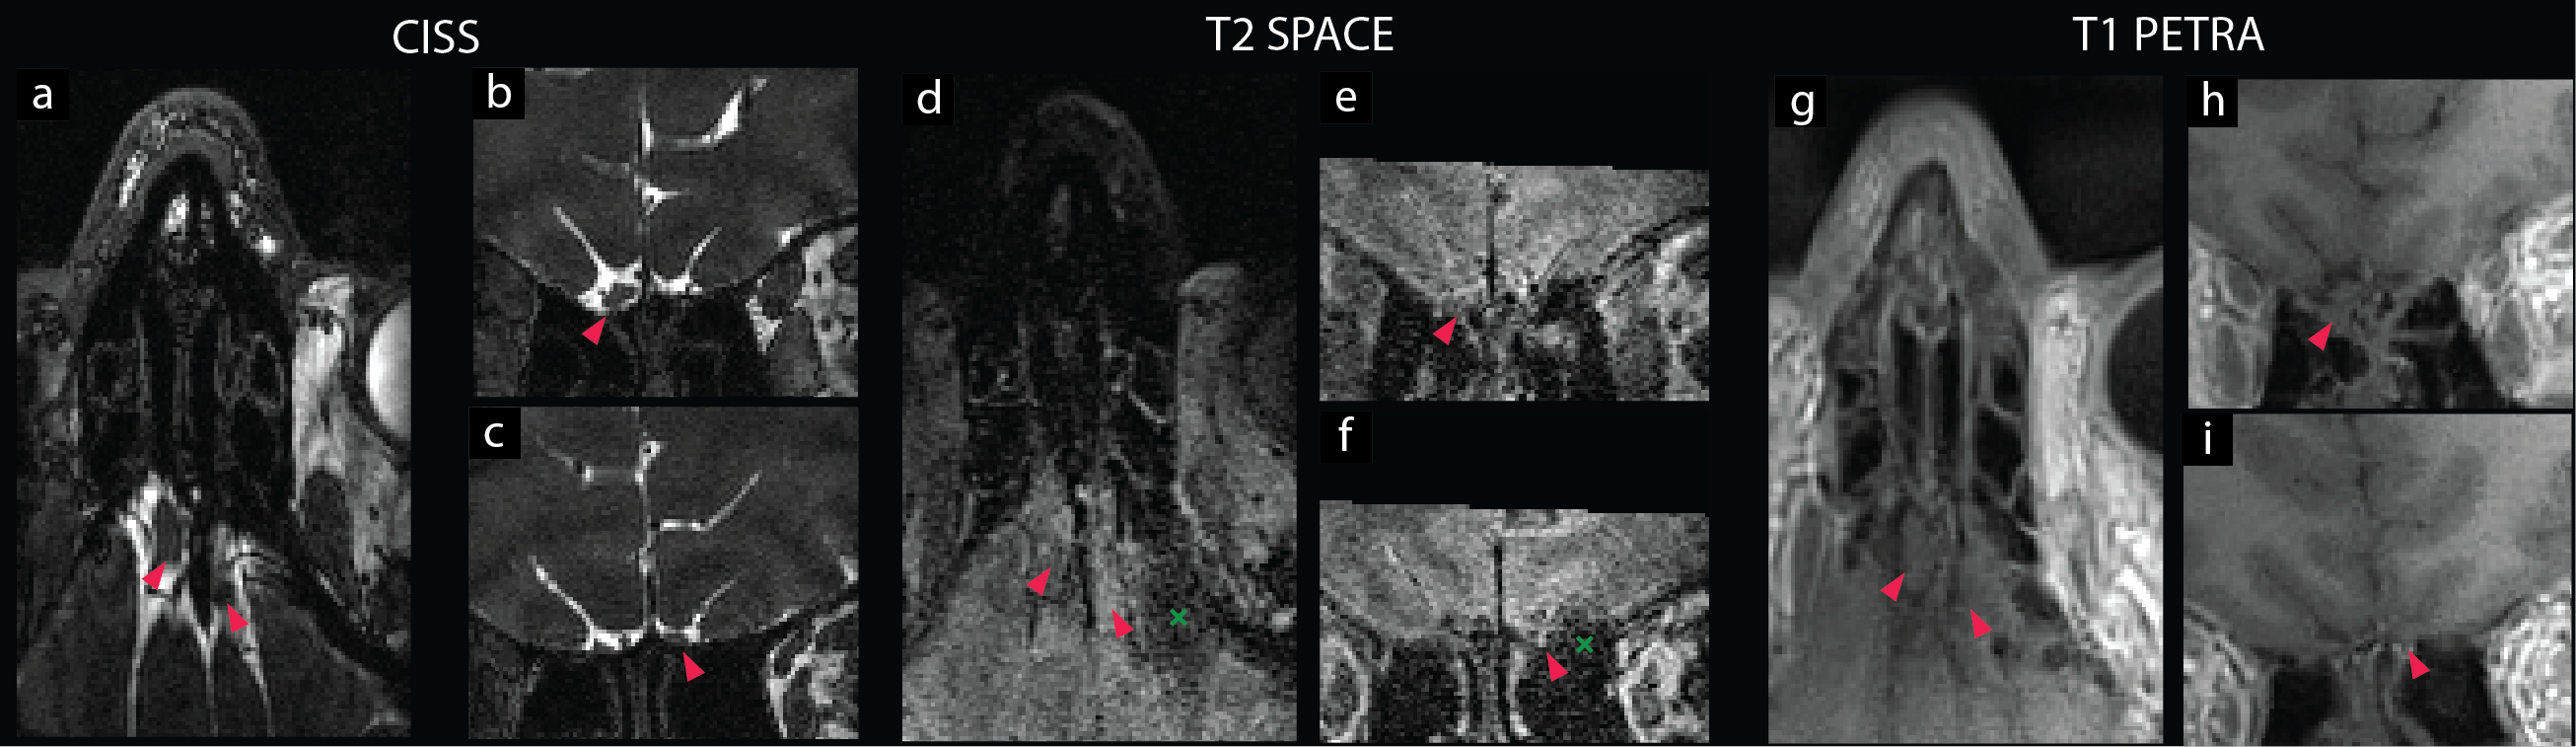
Figure 4: Comparison of Three Methods in a Subject with Poorly Visualized OBs. All slices are imaged at the same position. CISS and T1 PETRA are able to identify both OBs, while T2 SPACE failed to identify the left OB. a, d, f: axial view. b, e, h: coronal view of right OB. c, f, i: coronal view of left OB. OBs are marked by arrows. Signal dropout is marked by the cross.

Figure 5: Rendered 3D Structure for Olfactory Tracts. The OBs and OTs were manually segmented based on all three high-resolution methods. The olfactory trigon can be identified on the right (marked by the arrow) but was not on the left. Green: left OB. Blue: right OB. Red: OTs. A: anterior. L: left. I: inferior.