1732
Quantitative characterization of liver tissue in COVID-19 recovered patients using T1 mapping, R2* mapping and MRI-PDFF1Radiology, The Fifth Affiliated Hospital of Sun Yat-sen University, Zhuhai, China, 2The First Affiliated Hospital of Sun Yat-sen University, Guangzhou, China, 3Radiology, The First Affiliated Hospital of Sun Yat-sen University, Zhuhai, China, 4MR Research, GE Healthcare, Beijing, Beijing, China, 5The Fifth Affiliated Hospital of Sun Yat-sen University, Zhuhai, China, 6Radiology, Stony Brook Medicine, Stony Brook, New York, NY, United States
Synopsis
Liver injuries have been reported with strong evidence in COVID-19 patients. Whether these disturbances are presented in patients recovered from COVID-19 is still unknown. Totally 31 COVID-19 recovered patients were collected. And 37 sex- and age-matched normal controls (NC) were were further recruited. MR imaging was performed using a 3.0T scanner with T1mapping, R2* mapping and proton density fat fraction (PDFF) for all the patients. Abnormal liver T1 and PDFF values, which may be associated with subclinical renal injury due to COVID-19.
Introduction
Liver injuries have been reported with strong evidence in COVID-19 patients. 1,2However, for patients recovered from COVID-19, it is still unknown whether there is liver damage or the extent of damage. This research was to explore the value of T1 mapping, R2* mapping and proton density fat fraction (PDFF) in the detection of subclinical liver injury in COVID-19 recovered patients and provide guidance for clinical diagnosis and treatment.METHODS
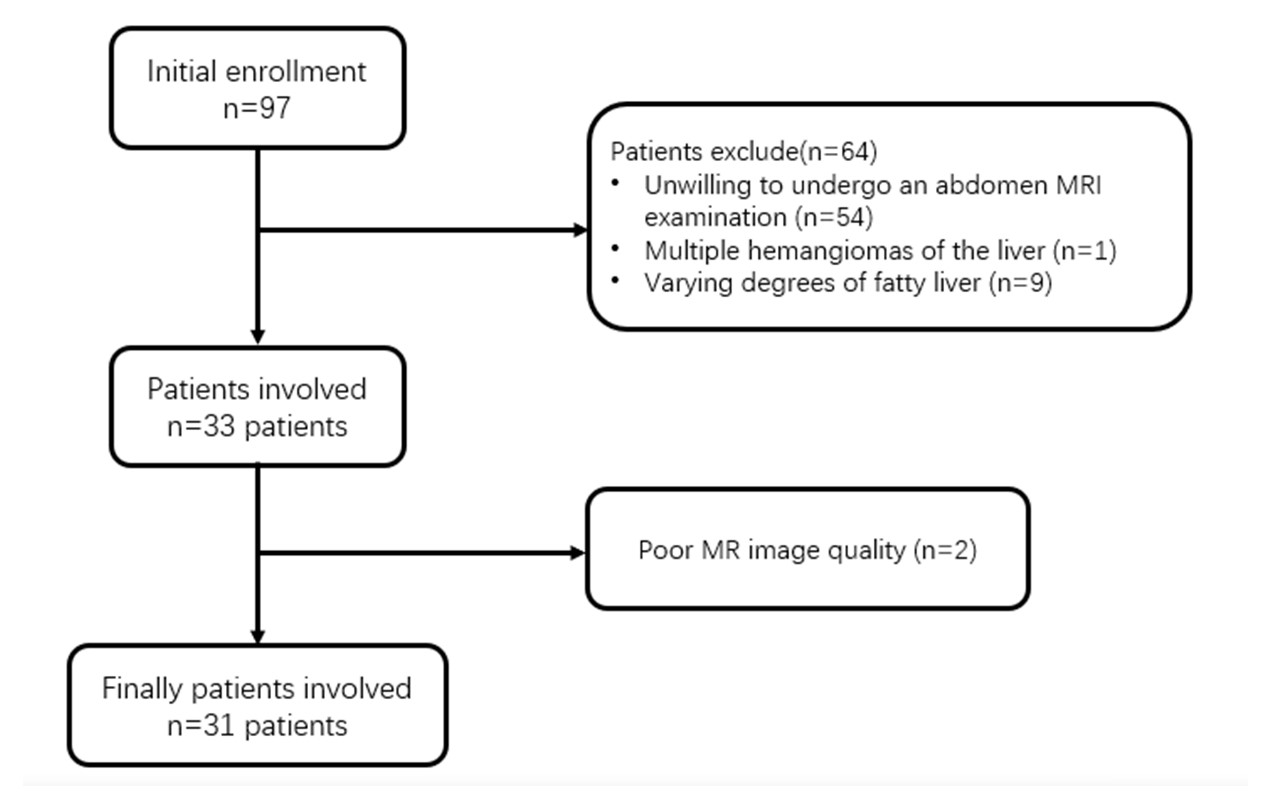
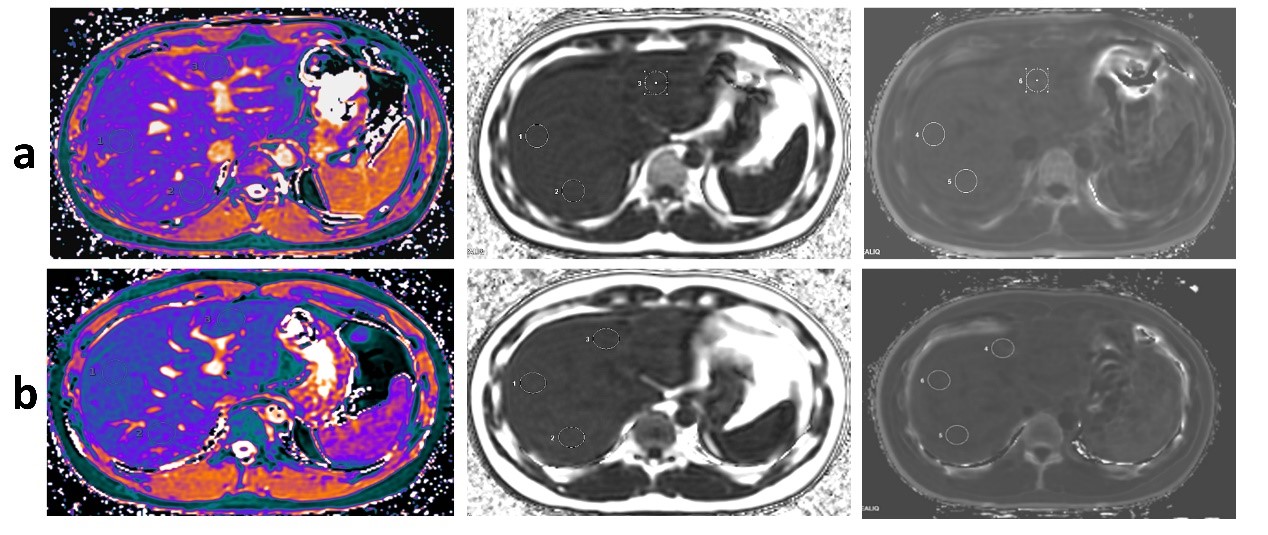
From Feb 18, 2020 to Mar 5, 2020, totally 31 COVID-19 recovered patients were collected. And 37 sex- and age-matched normal controls (NC) were were further recruited. MR imaging was performed using a 3.0T scanner with T1mapping, R2* mapping and proton density fat fraction (PDFF) for all the patients. T1, R2*, PDFF values were measured independently by two radiologists. Intra-class correlation coefficient (ICC) was used to evaluate the consistency between the two observers for each subject. The comparisons of MRI indices between the NC (N = 31) and COVID-19 (N = 31) groups were performed using independent two sample t-test or Mann-Whitney U test, depending on the data distribution.. Partial correlation analysis was applied to estimate the association between T1 and MRI-PDFF values in both normal and COVID-19 groups with age and R2* as covariates.Results
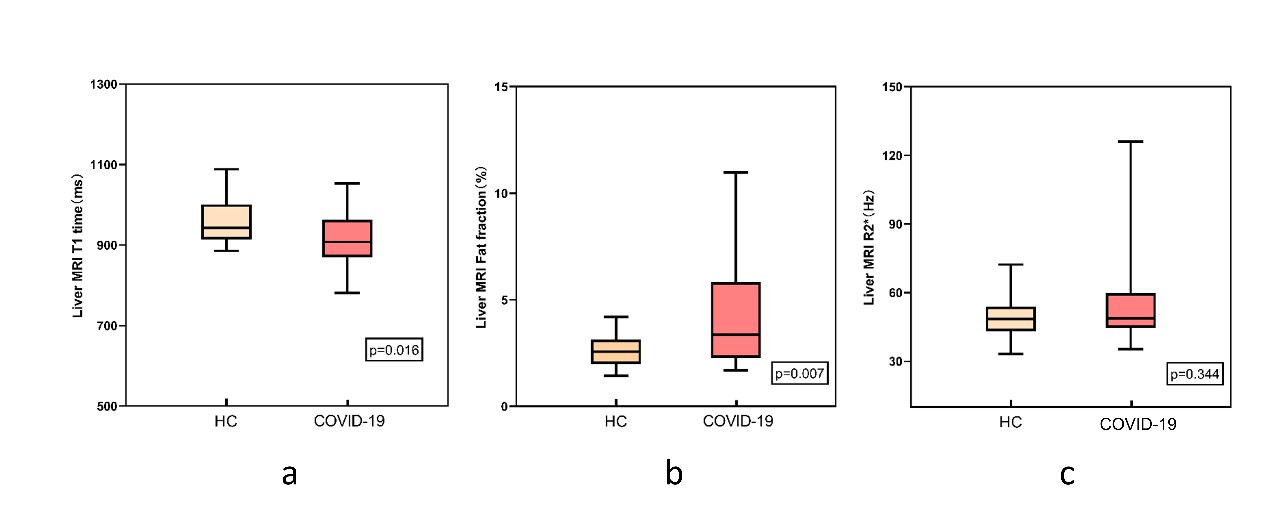
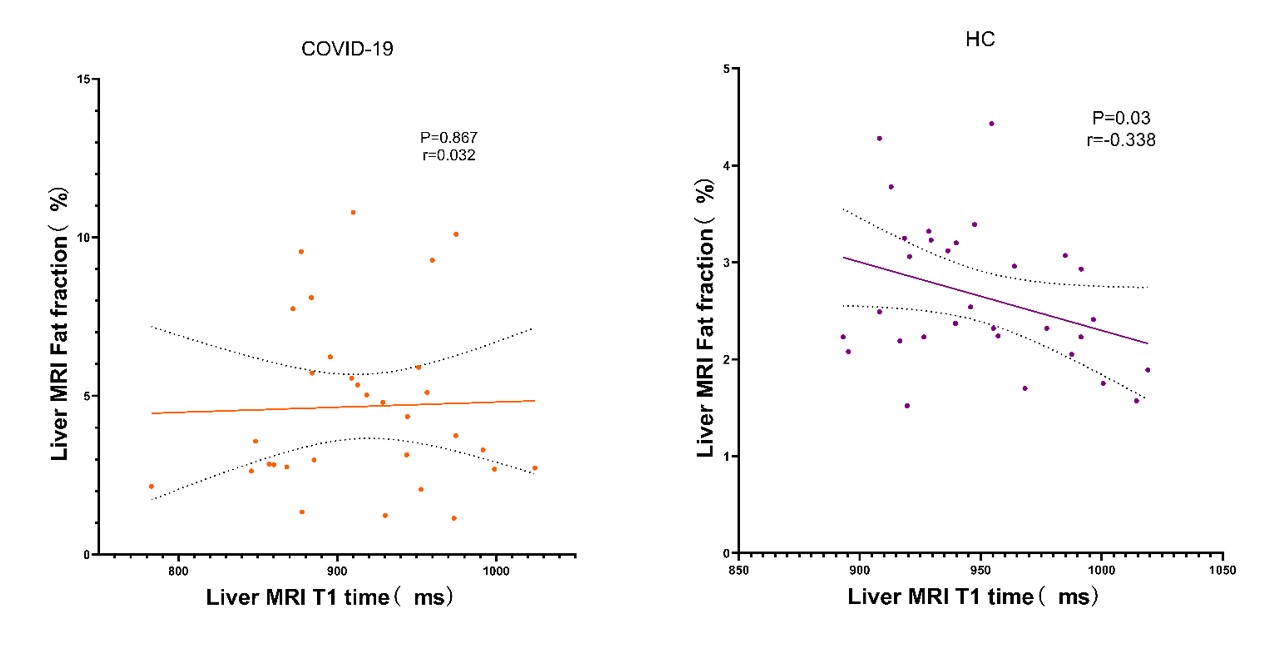
The ICC analysis of liver-lobe-based T1, PDFF and R2* measurements were shown excellent repeatability. The T1 value of the COVID-19 patient group was lower than that of the HC group, and the PDFF value was higher than that of the HC group. Significant differences were identified in T1 and PDFF between COVID-19 group and the HC group (P < 0.05). No significant difference was found in R2* between COVID-19 group and the HC group (P > 0.05).Although liver T1 time is a maker of fibrosis, it can be affected by other factors such as fat or iron. To verify whether the alteration of T1 values might be affected by possibly existed liver inflammation or fibrosis, the partial correlation between T1 and MRI-PDFF measures were performed with age and R2* as covariates. The results of partial correlation analysis of liver T1 and PDFF value in COVID-19 group was r=0.032, P = 0.8632 and HC group r = -0.338, P = 0.0631DISCUSSION
Compared with healthy volunteers, the T1 of convalescent patients with COVID-19 decreased and the value of PDFF increased. Through the analysis of the correlation between liver T1 value and PDFF, we found that there might be inflammation or fibrosis in the liver of COVID-19 recovered patients. PDFF can accurately reflects the concentration of triglycerides within the liver.3 IDEAL technology can provide PDFF without contamination due to field inhomogeneity and has been widely used in the quantitative diagnosis of hepatic steatosis.4Our PDFF result shows that there is a hepatic fat deposition in COVID-19 recovered patients. The result of PDFF is consistent with the previous pathological results. 5T1 mapping can reflect small changes in the T1 value within the tissue. 6Both the fat and iron have the opposing effects on T1 time compared to fibrosis,7,8 hence it is challenging to speculate whether the inflammation and fibrosis would be existed in liver. In our study, the T1 value of COVID-19 group is lower than that of the HC group, which could be accounted by hepatic steatosis. Also, the R2* values indicated that there was no iron deposition in the liver. The partial correlation analysis indicated that the negative association trend between the T1 and PDFF values in HC was changed in COVID-19 group. This phenomenon might be associated with the slightly invisible increased T1 value due to liver inflammation or fibrosis and significantly observed decreased T1 value due to fat content.
conclusion
In conclusion, COVID-19-related liver injury appears to manifest as steatosis of hepatocytes and possibly existed liver inflammation or fibrosis. MRI-PDFF technique can not only detect early COVID-19-related liver damage, but also provide a non-invasive method for COVID-19 convalescent patients liver management.Acknowledgements
We thank all of the emergency services, nurses, doctors, and other hospital staff for their efforts in fighting the COVID-19 outbreak. We also thank the nephrologists for collating and analyzing the clinical data.References
1. Xu L, Liu J, Lu M, Yang D, Zheng X. Liver injury during highly pathogenic human coronavirus infections. Liver Int 2020. https://doi.org/10.1 1 1 1/liv.14435 [Epub ahead of print].
2. Zhang C, Shi L, Wang F-S. Liver injury in COVID-19: management and challenges. The Lancet Gastroenterology & Hepatology. 2020;5(5):428-30.
3. Idilman IS, Keskin O, Elhan AH, Idilman R, Karcaaltincaba M. Impact of sequential proton density fat fraction for quantification of hepatic steatosis in nonalcoholic fatty liver disease. Scand J Gastroenterol 2014;49(5): 617–624.
4. Johnson BL, Schroeder ME, Wolfson T, Gamst AC, Hamilton G, Shiehmorteza M, et al. Effect of flip angle on the accuracy and repeatability of hepatic proton density fat fraction estimation by complex data-based, T1-independent, T2*-corrected, spectrum-modeled MRI. J Magn Reson Imaging. 2014;39(2):440-447.
5. Xu Z, Shi L, Wang Y, Zhang J, Huang L, Zhang C, et al. Pathological findings of COVID-19 associated with acute respiratory distress syndrome. The Lancet Respiratory Medicine. 2020;8(4):420-2.
6. Harrison SA, Dennis A, Fiore MM, Kelly MD, Kelly CJ, Paredes AH, et al. Utility and variability of three non-invasive liver fibrosis imaging modalities to evaluate efficacy of GR-MD-02 in subjects with NASH and bridging fibrosis during a phase-2 randomized clinical trial. PLoS One. 2018;13(9):e0203054.
7. Mozes FE, Tunnicliffe EM, Pavlides M, Robson MD. Influence of fat on liver T1 measurements using modified Look–Locker inversion recovery (MOLLI) methods at 3T. Journal of Magnetic Resonance Imaging. 2016; 44:105–111.
8. Henninger B, Kremser C, Rauch S, Eder R, Zoller H, Finkenstedt A, Michaely HJ, Schocke M. Evaluation of MR imaging with T1and T2* mapping for the determination of hepatic iron overload. Eur. Radiol. 2012; 22(11): 2478–2486.
Figures