1731
A preliminary study of Diffusion tensor imaging in recovered COVID-19 patients1Department of Radiology, the Fifth Affiliated Hospital of Sun Yat-sen University, Zhuhai,Guangdong, China, 2MR Research, GE Healthcare, Beijing, China
Synopsis
SARS‐CoV2 has been shown to cause central nervous system (CNS) damages. However, there have been few studies on neurological changes in recovered COVID-19 patients. In current study, we used DTI to assess the potential delayed damages in the CNS of the recovered COVID-19 patients caused by SARS-CoV2. Our results suggested that the microstructural integrity of white matter fibers is disrupted in recovered COVID-19 patients, which provided the evidence of CNS damages.
Introduction
A novel coronavirus SARS‐CoV2 broke out in Wuhan, China in December 2019 and rapidly spread around the world, and it was named COVID-19. Because of its high rate of morbidity and mortality, nowadays it has caused severe social, economic and ecological problems. SARS‐CoV2 could cause multiple system damages. In addition, increased evidences demonstrated that SARS‐CoV2 can cause acute or late central nervous system (CNS) damages, especially the patients with severe respiratory symptoms. 1 In order to detect the white matter integrities of the recovered COVID-19 patients, we applied the diffusion tensor imaging (DTI) to investigate the delayed neurological damages resulted from COVID-19.Methods
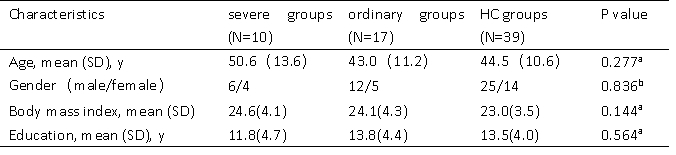
Twenty-seven recovered COVID-19 patients, including severe groups (N = 10) and ordinary groups (N = 17), and thirty-nine healthy control groups were enrolled from the Fifth Affiliated Hospital of Sun Yat-sen University. Demographic characteristics were summarized in Table 1. For each subject, the 3D-T1WI and DTI images were acquired using the FSPGR and single-shot EPI sequence, respectively, from a 3.0 T MRI with a 14-channel phased array head coil. The data preprocessing was using PANDA software, thereafter, the white matter diffusion metrics (FA, MD, AD, RD) of the 50 core white matter regions defined in ICBM template were extracted. Statistical analysis was applied to compare the differences of clinical characteristics and MRI indices among the three groups. The significance threshold was set at a P value less than 0.05. Importantly, in order to control the error of each DTI parameter, we performed a false-discovery rate (FDR).Results and discussion
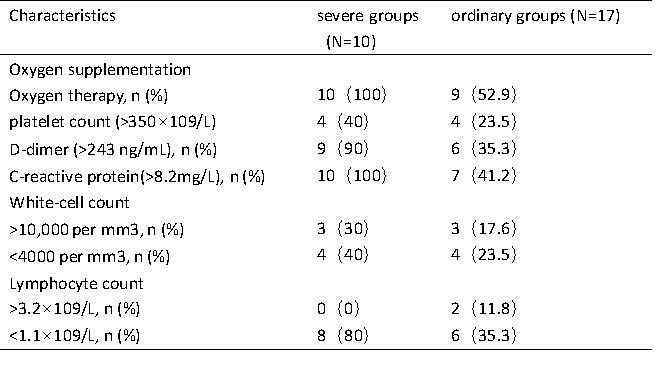
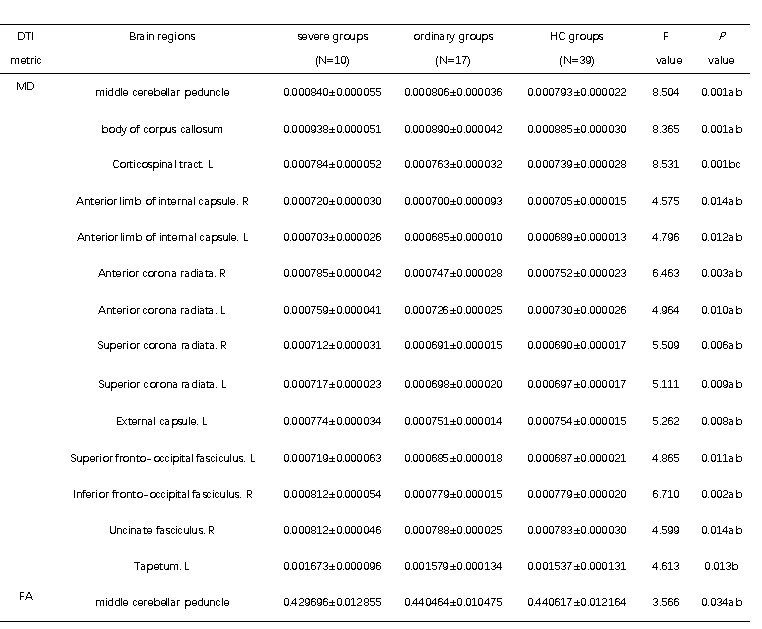
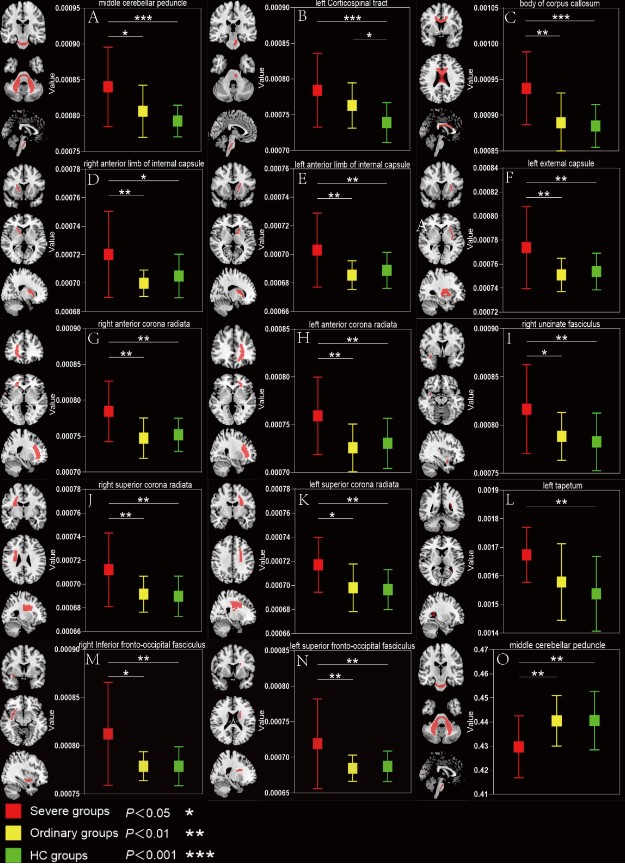
Patients in severe groups had a higher proportion with increased inflammatory response and obvious coagulation abnormalities (Table 2). The DTI results found that patients in severe groups showed a wide-range of microstructural damage, compared to HC and ordinary groups, mainly represented as the increase of MD values in multiple nerve bundles, and the decrease of FA values in some nerve bundles(p<0.05, FDR correction)(Table 3,Figure 1). MD is especially sensitive to cell number, edema and necrosis.2 When the myelin sheath of white matter tracts is damaged, the water molecule diffusivity would be increased, which led to abnormal anisotropic structure, such as axonal loss and demyelination.3 Moreover, we found that the lesions were mainly concentrated in the white matter fiber bundles around the lateral ventricles, limbic system and cerebellum, which was consistent with previous studies about CNS damages of the SARS‐CoV2 .4-7Similar findings have been found in other neurotropic viruses.8-10Conclusion
The microstructural integrities of white matter fibers were disrupted in recovered COVID-19 patients, which further demonstrated that the sustained or delayed damages of the SARS‐CoV2 to the CNS.Acknowledgements
No acknowledgement found.References
1.Mao L, Jin H, Wang M, et al. Neurologic Manifestations of Hospitalized Patients with Coronavirus Disease 2019 in Wuhan, China. JAMA neurology. 2020;77(6):1-9.
2.Alexander AL, Hurley SA, Samsonov AA, et al. Characterization of cerebral white matter properties using quantitative magnetic resonance imaging stains. Brain connectivity. 2011;1(6):423-446
3.Madden DJ, Bennett IJ, Song AW. Cerebral white matter integrity and cognitive aging: contributions from diffusion tensor imaging. Neuropsychology review. 2009;19(4):415-435.
4.Moriguchi T, Harii N, Goto J, et al. A first case of meningitis/encephalitis associated with SARS-Coronavirus-2. International journal of infectious diseases: IJID: official publication of the International Society for Infectious Diseases. 2020; 94:55-58.
5.Parsons T, Banks S, Bae C, Gelber J, Alahmadi H, Tichauer M. COVID-19-associated acute disseminated encephalomyelitis (ADEM). Journal of neurology. 2020:1-4.
6.Zoghi A, Ramezani M, Roozbeh M, Darazam I, Sahraian MJMs, disorders r. A case of possible atypical demyelinating event of the central nervous system following COVID-19. 2020; 44:102324.
7.Baig A, Khaleeq A, Ali U, Syeda HJAcn. Evidence of the COVID-19 Virus Targeting the CNS: Tissue Distribution, Host-Virus Interaction, and Proposed Neurotropic Mechanisms. 2020;11(7):995-998.
8.Li K, Wohlford-Lenane C, Perlman S, et al. Middle East Respiratory Syndrome Coronavirus Causes Multiple Organ Damage and Lethal Disease in Mice Transgenic for Human Dipeptidyl Peptidase 4. The Journal of infectious diseases. 2016;213(5):712-722.
9.Glass WG, Subbarao K, Murphy B, Murphy PM. Mechanisms of host defense following severe acute respiratory syndrome-coronavirus (SARS-CoV) pulmonary infection of mice. Journal of immunology (Baltimore, Md: 1950). 2004;173(6):4030-4039.
10.Fong C, Khine M, Peter A, Lim W, Rozalli F, Rahmat KJJocnojotNSoA. Mild encephalitis/encephalopathy with reversible splenial lesion (MERS) due to dengue virus. 2017; 36:73-75.
Figures