1730
Two-site 7T 1H-MRS study in brainstem of "long COVID" patients1Wolfson Brain Imaging Centre, Department of Clinical Neurosciences, University of Cambridge, Cambridge, United Kingdom, 2Wellcome Centre for Integrative Neuroimaging, FMRIB, Nuffield Department of Clinical Neurosciences, University of Oxford, Oxford, United Kingdom, 3Divison of Anaesthesia, Department of Medicine, University of Cambridge, Cambridge, United Kingdom, 4Neurology Unit, Department of Clinical Neurosciences, University of Cambridge, Cambridge, United Kingdom, 5Behavioural and Clinical Neuroscience Institute, Department of Psychiatry, University of Cambridge, Cambridge, United Kingdom, 6Nuffield Department of Clinical Neurosciences, University of Oxford, Oxford, United Kingdom, 7Cambridge Centre for Frontotemporal Dementia, Department of Clinical Neurosciences, University of Cambridge, Cambridge, United Kingdom, 8MRC Cognition and Brain Sciences Unit, University of Cambridge, Cambridge, United Kingdom, 9on behalf of the Cambridge NeuroCOVID group and the CITIID-NIHR COVID-19 BioResource Collaboration (www.wbic.cam.ac.uk/neuro-covid/), Cambridge, United Kingdom
Synopsis
SARS-CoV-2 attacks the central nervous system. A particularly nasty symptom of COVID-19 is a feeling of breathlessness that can persist for months after acute infection has subsided (“long COVID”). Based on early MRI observations in hospitalised patients, we hypothesised that COVID-19 may cause inflammation or degeneration of the brainstem where the respiratory control centres are located, leading to these symptoms. In this study we develop a protocol for 1H-MRS in the brainstem on two models of ultra-high field 7T MRI scanner. We show feasibility to profile brainstem neurochemistry in anticipation of a multi-site clinical study across the UK’s 7T centres.
Introduction
To date, more than 70 million people have been infected with SARS-CoV-2. In adults, up to 64% of patients experience dyspnoea1. Some patients perceive difficulties in breathing long after other acute symptoms have subsided2. It has been hypothesised that these symptoms may be caused by the neuro-invasive nature of SARS-CoV-2 that may cause inflammation and other pathology in the brainstem3,4.MR spectroscopy is a powerful, non-invasive method to probe the biochemistry of the central nervous system by measuring the concentrations of key neurometabolites. In this study, we are particularly keen to assess levels of myo-inositol (Ins, marker of neuroinflammation) as well as the neurotransmitters GABA and glutamate (Glu) and markers of neurodegeneration e.g. creatine (Cr)5. We know that these can be measured reproducibly in the cerebrum with single-voxel semi-LASER 1H-MRS at 7T in multi-centre settings6. However, very few studies to date have performed 1H-MRS assessments in the brainstem - the region containing the respiratory control centres particularly implicated in our hypothesis regarding perceived breathlessness.
Our goal in this study is therefore to investigate the feasibility of semi-LASER single voxel 1H-MRS at 7T to assess neurochemistry in the brainstem of COVID-19 recoverees (hospitalised and non-hospitalised). Additionally, we will scan subjects on both models of Siemens 7T MRI scanner in preparation for a multi-site 7T MRS/MRI study in participants recovered from COVID-19.
Methods
A total of 24 participants, 3-6 months following a diagnosis of COVID19, were recruited to this study and gave written, informed consent (Table 1). Data was acquired at two sites using Magnetom 7T (VB17) and 7T Terra (VE12U) MRI scanners (Siemens) equipped with the same 1Tx/32Rx head coil (Nova Medical). Subjects were scanned with a 1hr protocol containing localisers, structural scan (0.7mm3 isotropic MP2RAGE matching UK7T Network protocols7), 1H-MRS (using the CMRR semi-LASER MRS C2P package with a 12x12x20mm³ voxel positioned at the ponto-medullary junction as shown in Figure 1), and QSM and rs-fMRI contrasts described elsewhere.For spectroscopy, we followed the CMRR MRS C2P recommended procedure as optimised previously at our site8. B0 shimming used FASTMAP9, B1+ and water suppression voltage were adjusted with a parameter sweep in short non-water suppressed acquisitions. The main acquisition used semi-LASER with 120 signal averages, 26ms TE and 5000ms TR10. Non-water suppressed spectra were acquired for water scaling and eddy-current correction. We used GOIA-WURST pulses for semi-LASER.
Spectra from both sites were pre-processed, analysed and quantified with Osprey11. Metabolite concentrations were scaled relative to water and corrected for water relaxation losses12,13. Non-parametric statistical analysis was performed in MATLAB R2019b with α=0.05.
Results
Spectral quality for both sites was high in all participants with all but one spectrum exhibiting ‘acceptable’ (per recent expert consensus paper14) or better water linewidths of ≤19Hz and a median SNR(tNAA) of 84 (range: 58-107) (Table 1). Mean spectra averaged across all participants at each site are shown in Figure 2. This demonstrates the consistently high-quality spectra achievable at each site, and the consistency between sites. Comparing sites statistically, there were no significant differences between the means and variances of SNR (for tNAA) and water linewidths between Oxford and Cambridge (p>0.11).Metabolite concentrations of Cr, GABA, Gln, Glu, Ins, NAA and PCh (normalised to tissue water) are shown in Figure 3. Significant differences were observed between metabolite concentrations at both sites for Gln, Ins and NAA (p(Gln) = 0.024, p(Ins)=0.021, p(NAA)=0.018). However, no significant differences were found for the variances of all metabolites at both sites (p(Cr,GABA,Gln,Glu,Ins,NAA,PCh)>0.104).
A preliminary investigation of Ins showed a trend for increasing Ins with COVID-19 disease severity (WHO scale15), but this did not reach statistical significance in our small cohort for Ins (water referenced) or Ins/tCr (p(Ins) = 0.081, p(Ins/tCr)=0.081) between cases of mild and severe COVID-19 (Figure 4).
Discussion and Conclusions
The small differences in metabolite concentrations may be explained by differences in the patient cohorts between the sites which were not matched across sites for this study. The absence of significant differences in the variances confirms that high-quality 1H-MRS data can be acquired in the brainstem of patients recovered from COVID-19 at either site. This brainstem MRS protocol is therefore ready for use in multi-centre studies.The possible trending increase in Ins or Ins/tCr with severe vs mild COVID-19 would be consistent with neuroinflammation in the brainstem, although we emphasise that this is not yet a statistically significant finding from our small cohort.
We are now recruiting a set of age and sex-matched healthy controls at our two sites. We hope soon to be able to confirm whether there are alterations in neurochemistry in patients recovering from COVID-19 (i.e. with “long COVID”). Finally, we have recently submitted a funding bid to perform a larger scale investigation of brainstem effects in COVID-19 across the UK’s 7T MRI sites.
Acknowledgements
We thank the patients for their participation and the radiographers and research coordinators for their efforts at this difficult time. We thank Dinesh Deelchand for promptly back-porting GOIA pulses to the VB17 semi-LASER package to improve brainstem performance on the Magnetom 7T system at Oxford. The Wellcome Centre for Integrative Neuroimaging is supported by core funding from the Wellcome Trust (203139/Z/16/Z). The Wolfson Brain Imaging Centre is supported by the NIHR Cambridge Biomedical Research Centre and an MRC Clinical Research Infrastructure Award for 7T research. CG is supported by a Cambridge European Scholarship awarded by the Cambridge Trust and from the European Union’s H2020 research and innovation program under grant agreement [801075]. CTR is funded by the Wellcome Trust and the Royal Society [098436/Z/12/B].References
- Pascarella, G. et al. COVID‐19 diagnosis and management: a comprehensive review. Journal of Internal Medicine 288, 192-206, doi:10.1111/joim.13091 (2020).
- Shaw, B., Daskareh, M. & Gholamrezanezhad, A. The lingering manifestations of COVID-19 during and after convalescence: update on long-term pulmonary consequences of coronavirus disease 2019 (COVID-19). Radiol Med, doi:10.1007/s11547-020-01295-8 (2020).
- Mao, L. et al. Neurologic Manifestations of Hospitalized Patients With Coronavirus Disease 2019 in Wuhan, China. JAMA Neurol 77, 683-690, doi:10.1001/jamaneurol.2020.1127 (2020).
- Li, Y. C., Bai, W. Z. & Hashikawa, T. The neuroinvasive potential of SARS‐CoV2 may play a role in the respiratory failure of COVID‐19 patients. Journal of Medical Virology 92, 552-555, doi:10.1002/jmv.25728 (2020).
- Oz, G. et al. Clinical proton MR spectroscopy in central nervous system disorders. Radiology 270, 658-679, doi:10.1148/radiol.13130531 (2014).
- van de Bank, B. L. et al. Multi-center reproducibility of neurochemical profiles in the human brain at 7 T. NMR Biomed 28, 306-316, doi:10.1002/nbm.3252 (2015).
- Clarke, W. T. et al. Multi-site harmonization of 7 tesla MRI neuroimaging protocols. NeuroImage 206, 116335, doi:10.1016/j.neuroimage.2019.116335 (2020).
- Murley, A. G. et al. GABA and glutamate deficits from frontotemporal lobar degeneration are associated with disinhibition. Brain 143, 3449-3462, doi:10.1093/brain/awaa305 (2020).
- Gruetter, R. Automatic, localized in vivo adjustment of all first- and second-order shim coils. Magn Reson Med 29, 804-811, doi:10.1002/mrm.1910290613 (1993).
- Deelchand, D. K. et al. Across‐vendor standardization of semi‐LASER for single‐voxel MRS at 3T. NMR in Biomedicine, doi:10.1002/nbm.4218 (2019).
- Oeltzschner, G. et al. Osprey: Open-source processing, reconstruction & estimation of magnetic resonance spectroscopy data. Journal of Neuroscience Methods 343, 108827, doi:10.1016/j.jneumeth.2020.108827 (2020).
- Wright, P. J. et al. Water proton T 1 measurements in brain tissue at 7, 3, and 1.5T using IR-EPI, IR-TSE, and MPRAGE: results and optimization. Magnetic Resonance Materials in Physics, Biology and Medicine 21, 121-130, doi:10.1007/s10334-008-0104-8 (2008).
- Wiggermann, V., Mackay, A. L., Rauscher, A. & Helms, G. In vivo investigation of the multi‐exponential T2 decay in human white matter at 7T: Implications for myelin water imaging at UHF. NMR in Biomedicine, doi:10.1002/nbm.4429 (2020).
- Juchem, C. et al. B0 shimming for in vivo magnetic resonance spectroscopy: Experts' consensus recommendations. NMR in Biomedicine, e4350, doi:10.1002/nbm.4350 (2020).
- World Health Organization. COVID-19 Therapeutic Trial Synopsis. (2020).
Figures
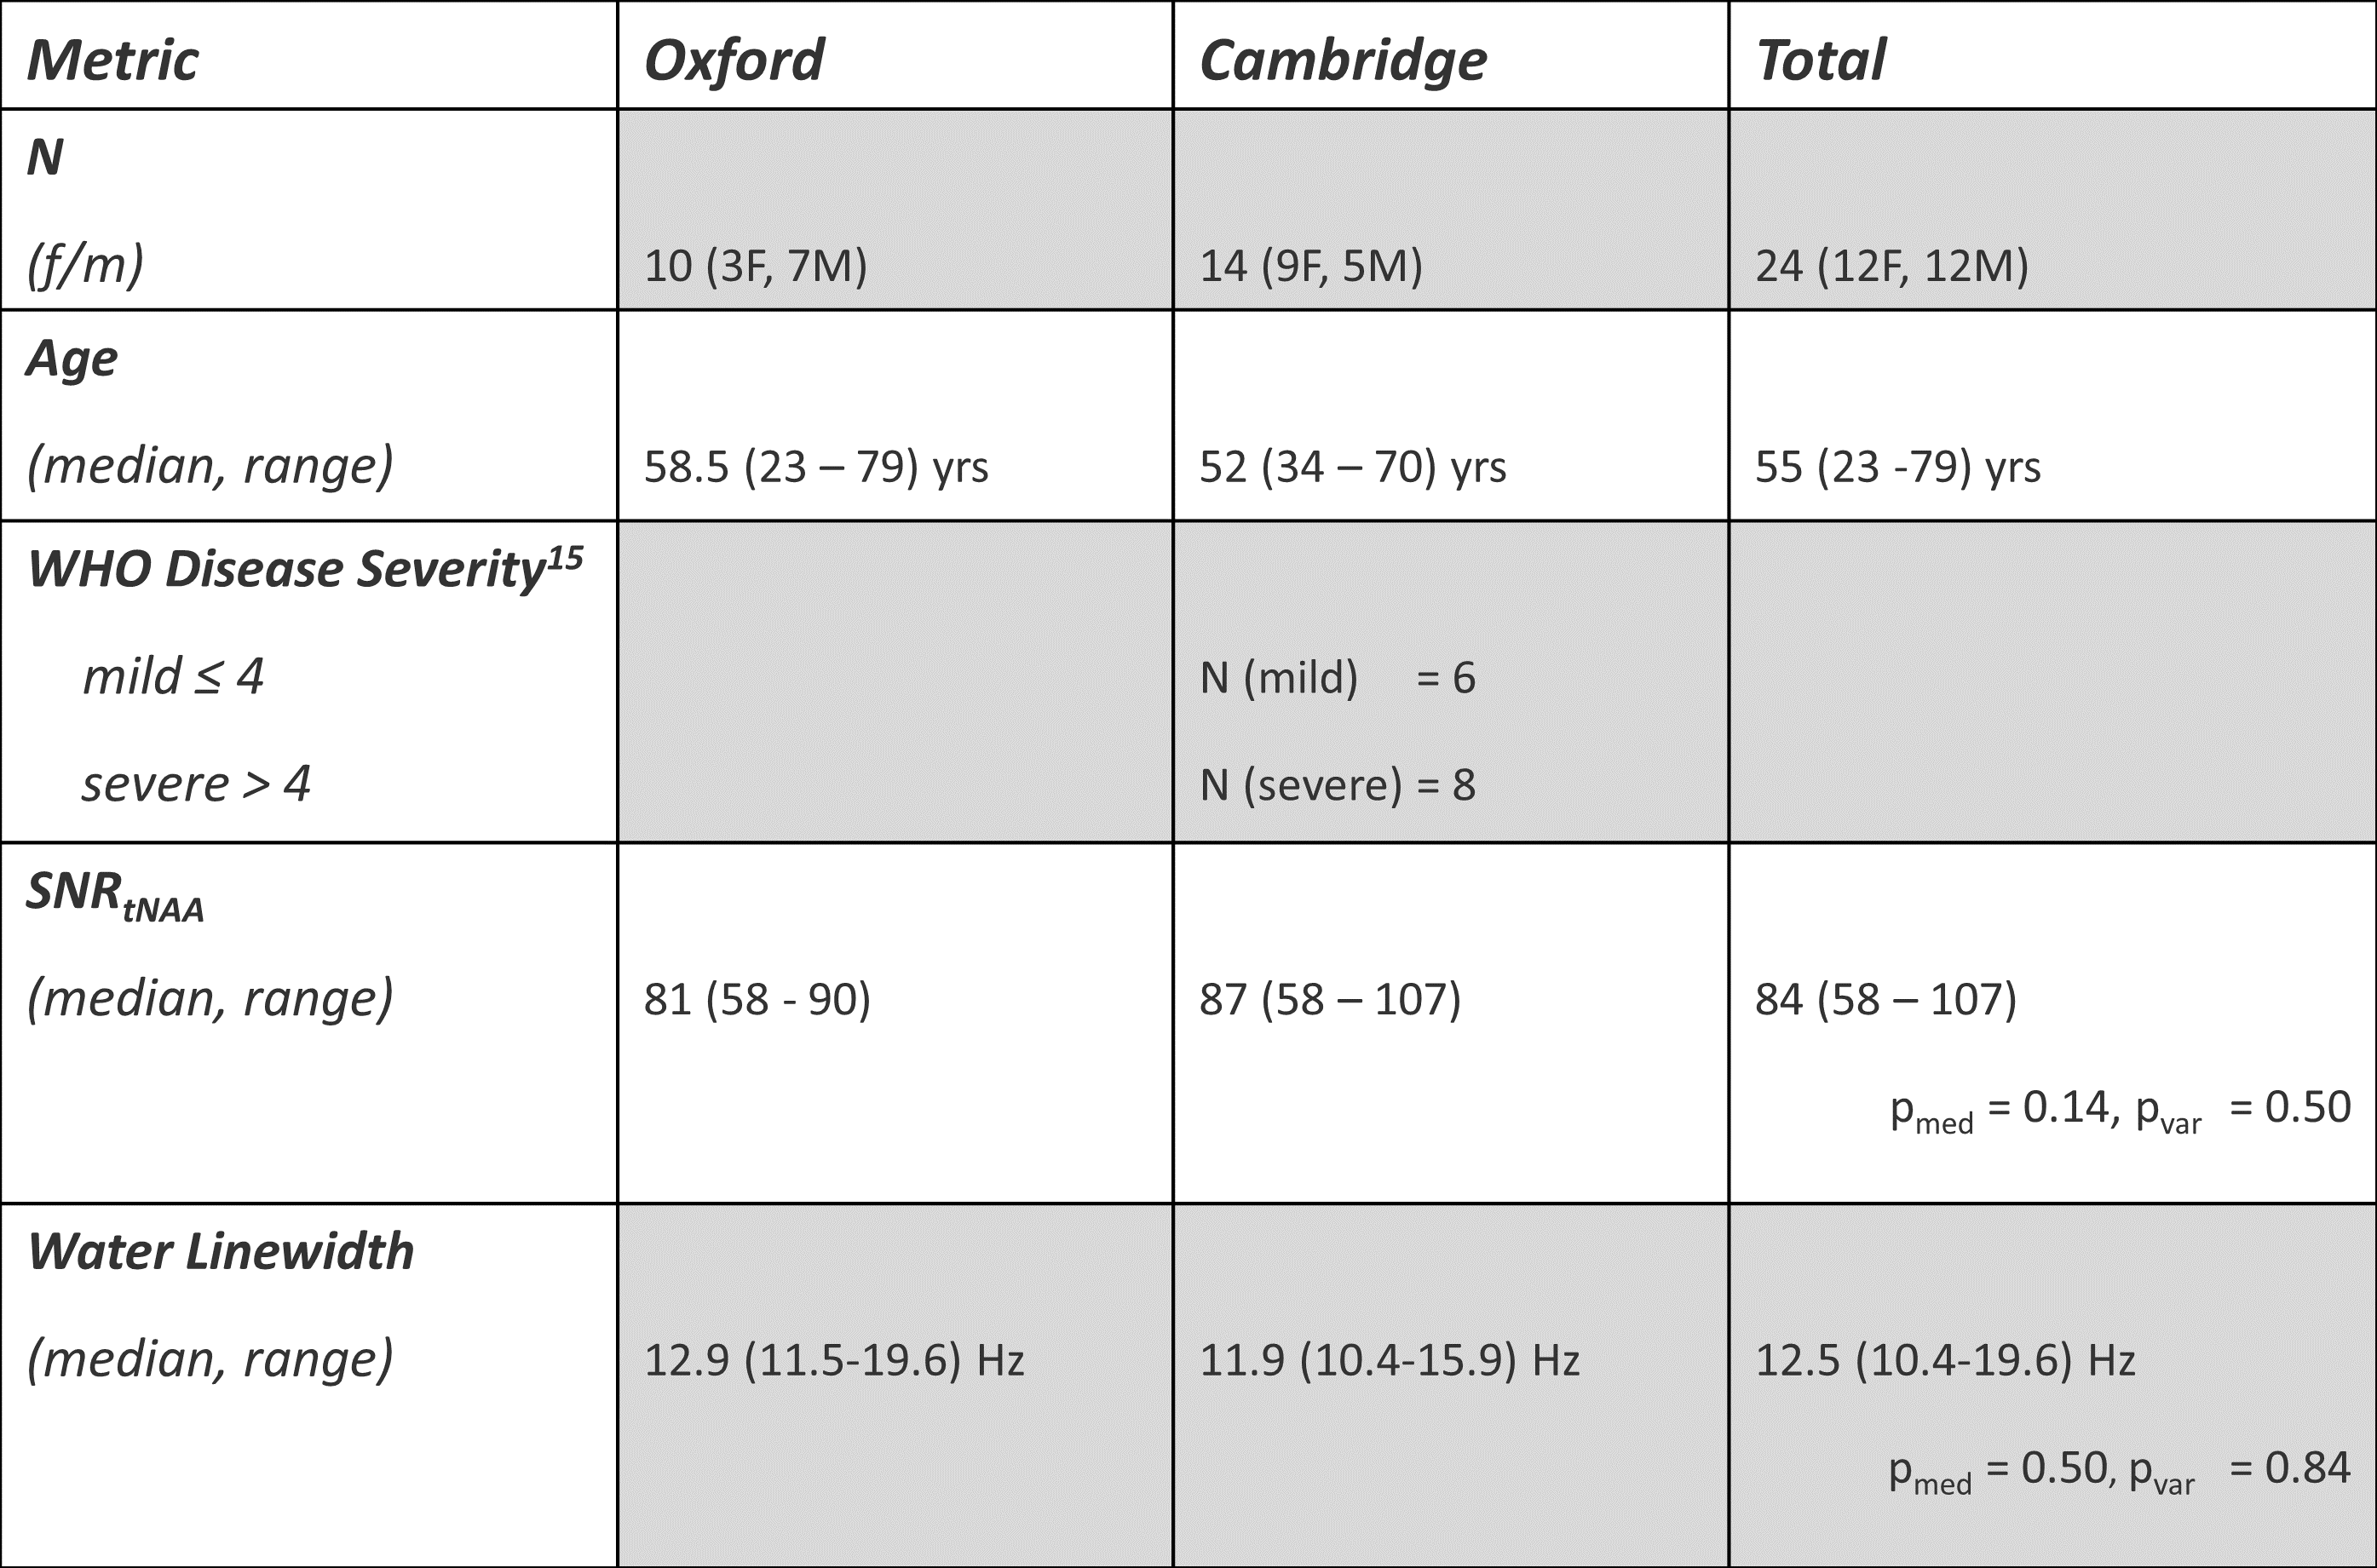
Table 1: Patient population and spectral quality metrics.
Uncorrected p-values for the Wilcoxon ranksum test (pmed) and Brown-Forsythe-Test (pvar) for equality of variances are reported.
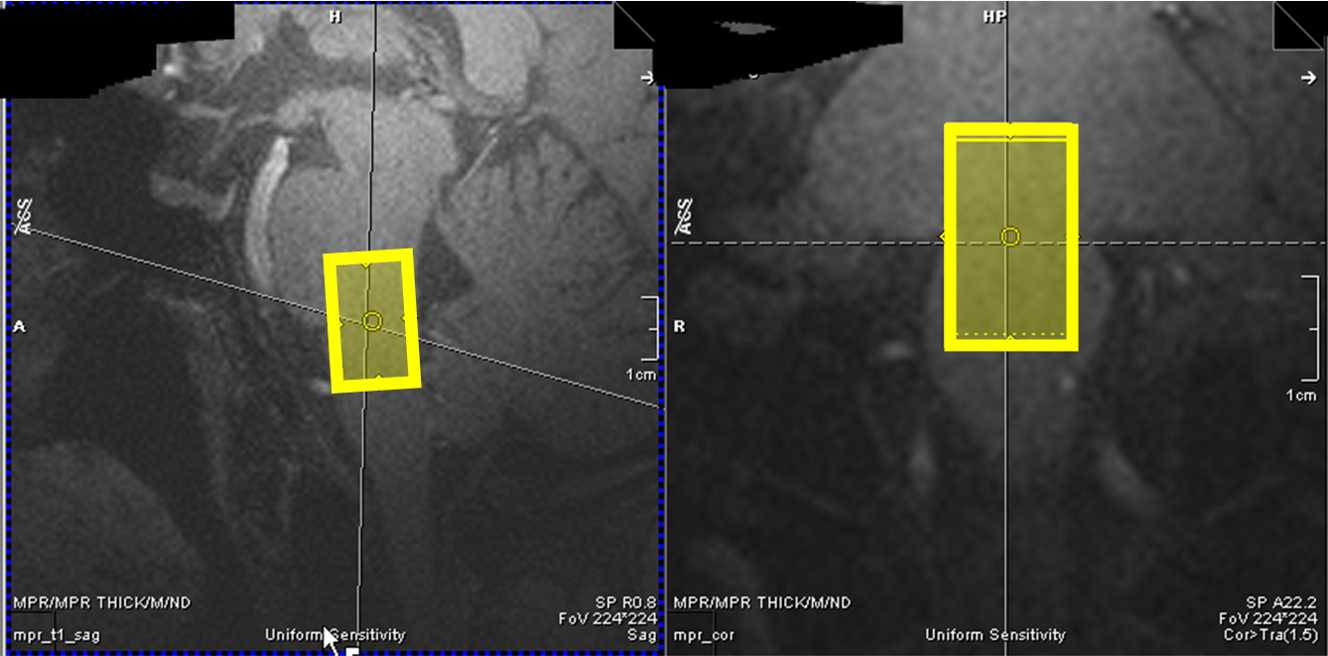
Figure 1: Sample Voxel Placement:
Exemplary voxel placement of the 12 x12 x 20 mm³ =2.9 mL voxel in the pontomedullary junction as identified on the MP2RAGE image (0.7mm³ isotropic, TE/TI1/TI2/TR=2.64/725/2150/3500ms, acquisition time=7:51). Spectra were acquired with an sLASER sequence (TE/TR/NSA=27ms/5000-6170ms/120).
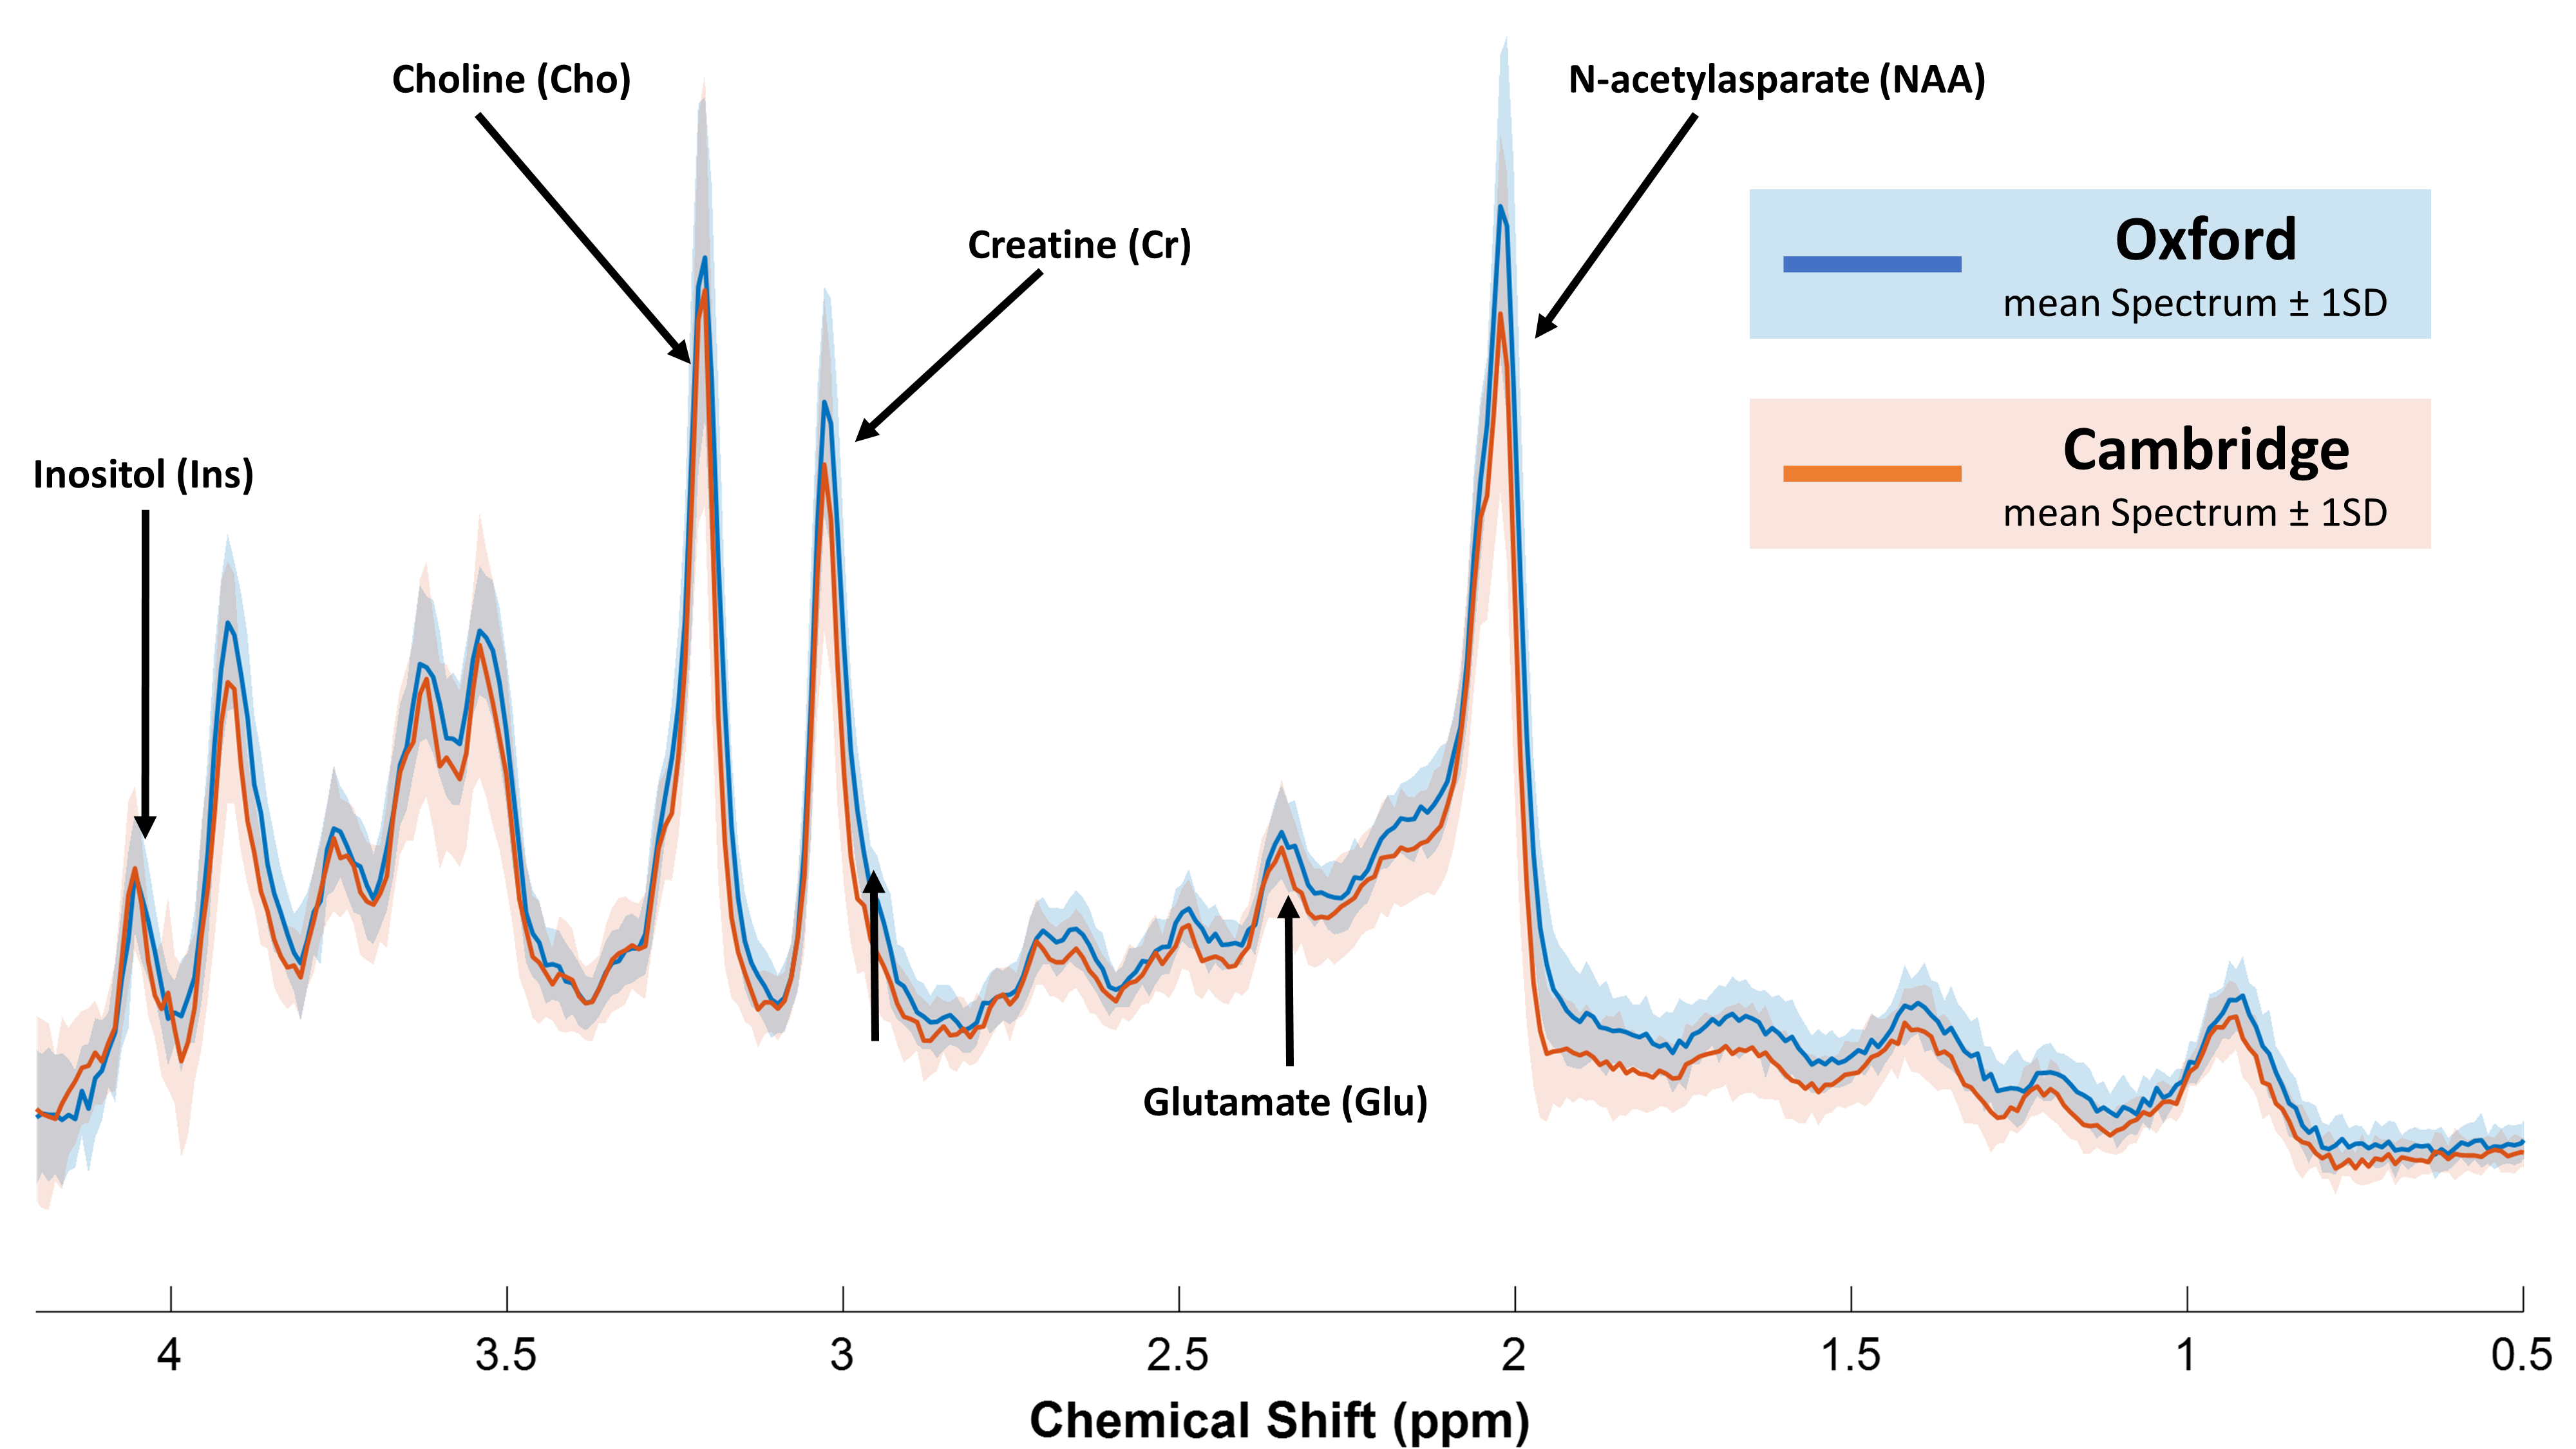
Figure 2: Mean Processed Spectra from Oxford (blue) and Cambridge (orange).
Pooled spectral quality was overall high with an estimated SNR(tNAA) (median (range) = 84 (58 – 107) and water linewidths 12.5 (10.4 - 19.6) Hz. No statistically significant differences for the means or variances of SNR or water linewidths were observed (Table 1).
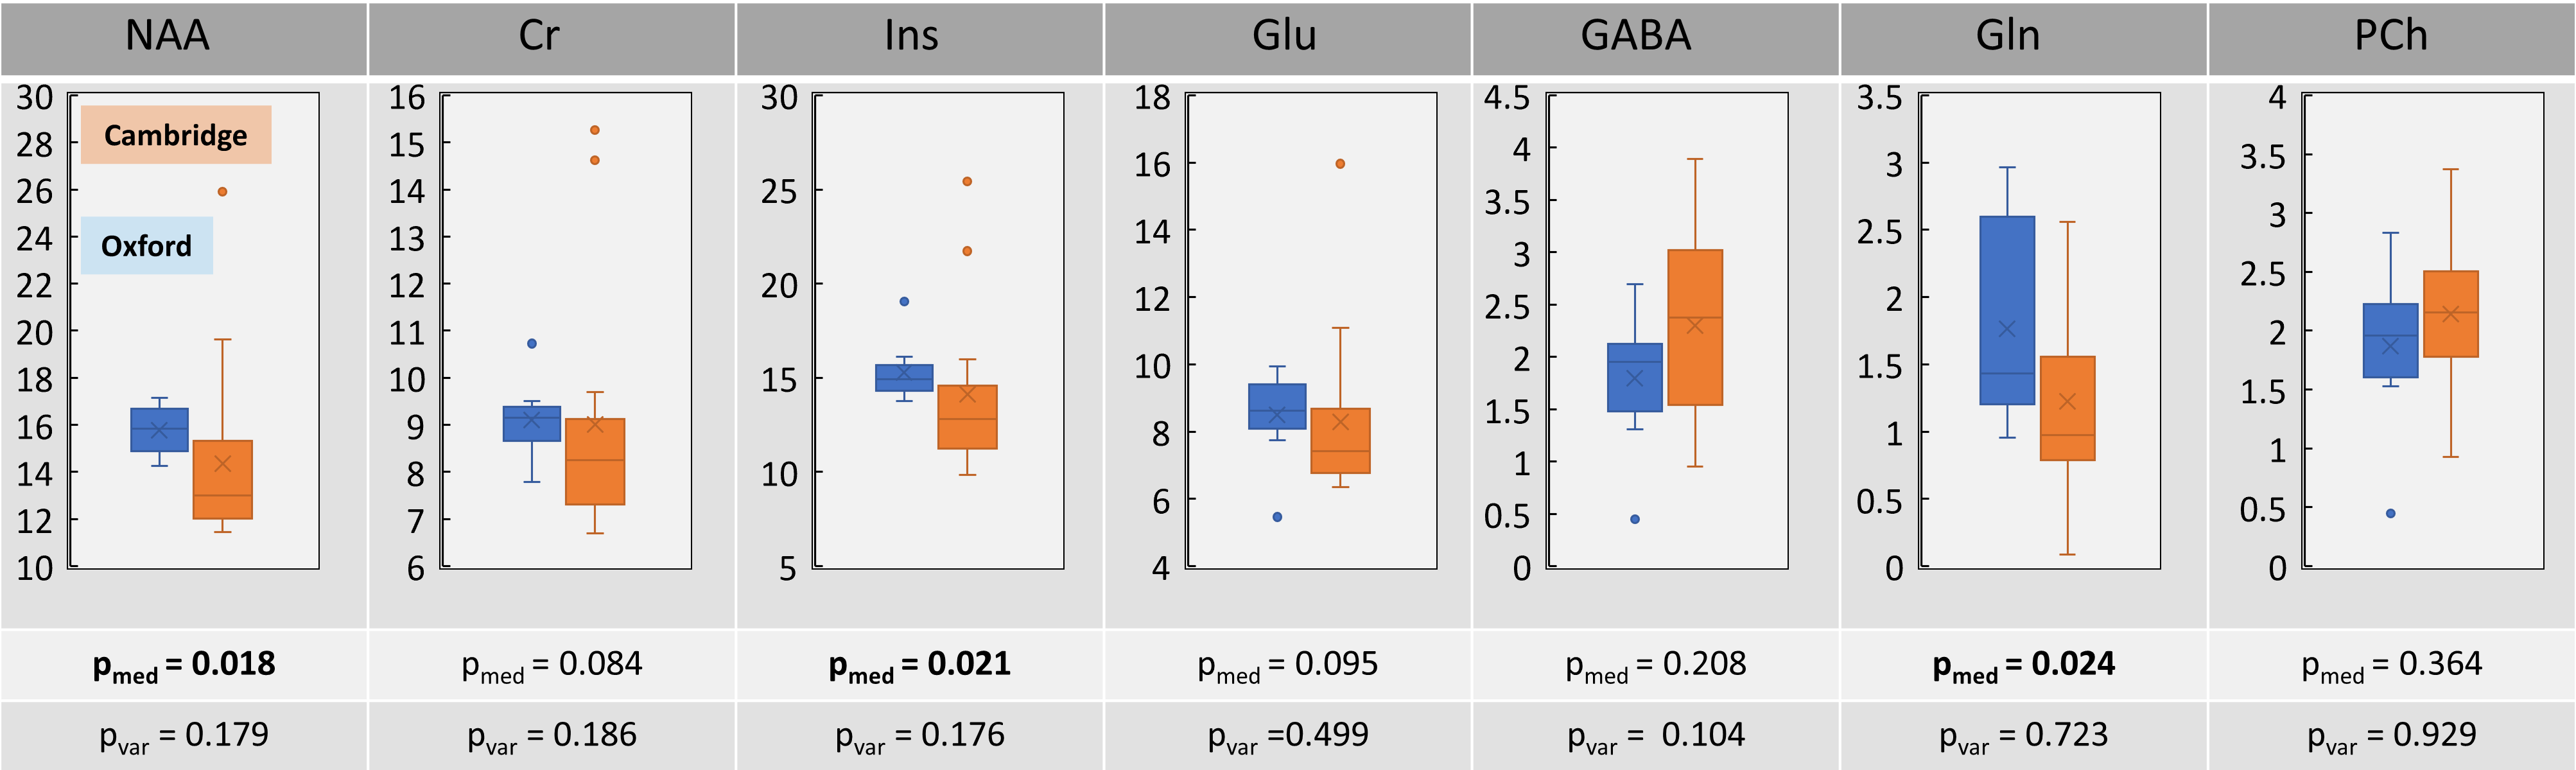
Figure 3: Box plots of metabolite concentrations at two sites.
Metabolite concentrations were referenced to water and corrected for water T1 and T2 relaxation losses as well as CSF volume fraction. While NAA, Ins and Gln were significantly different between two sites (p<0.024); no significant differences in variances were observed (p>0.0175), suggesting high reproducibility between the two sites.
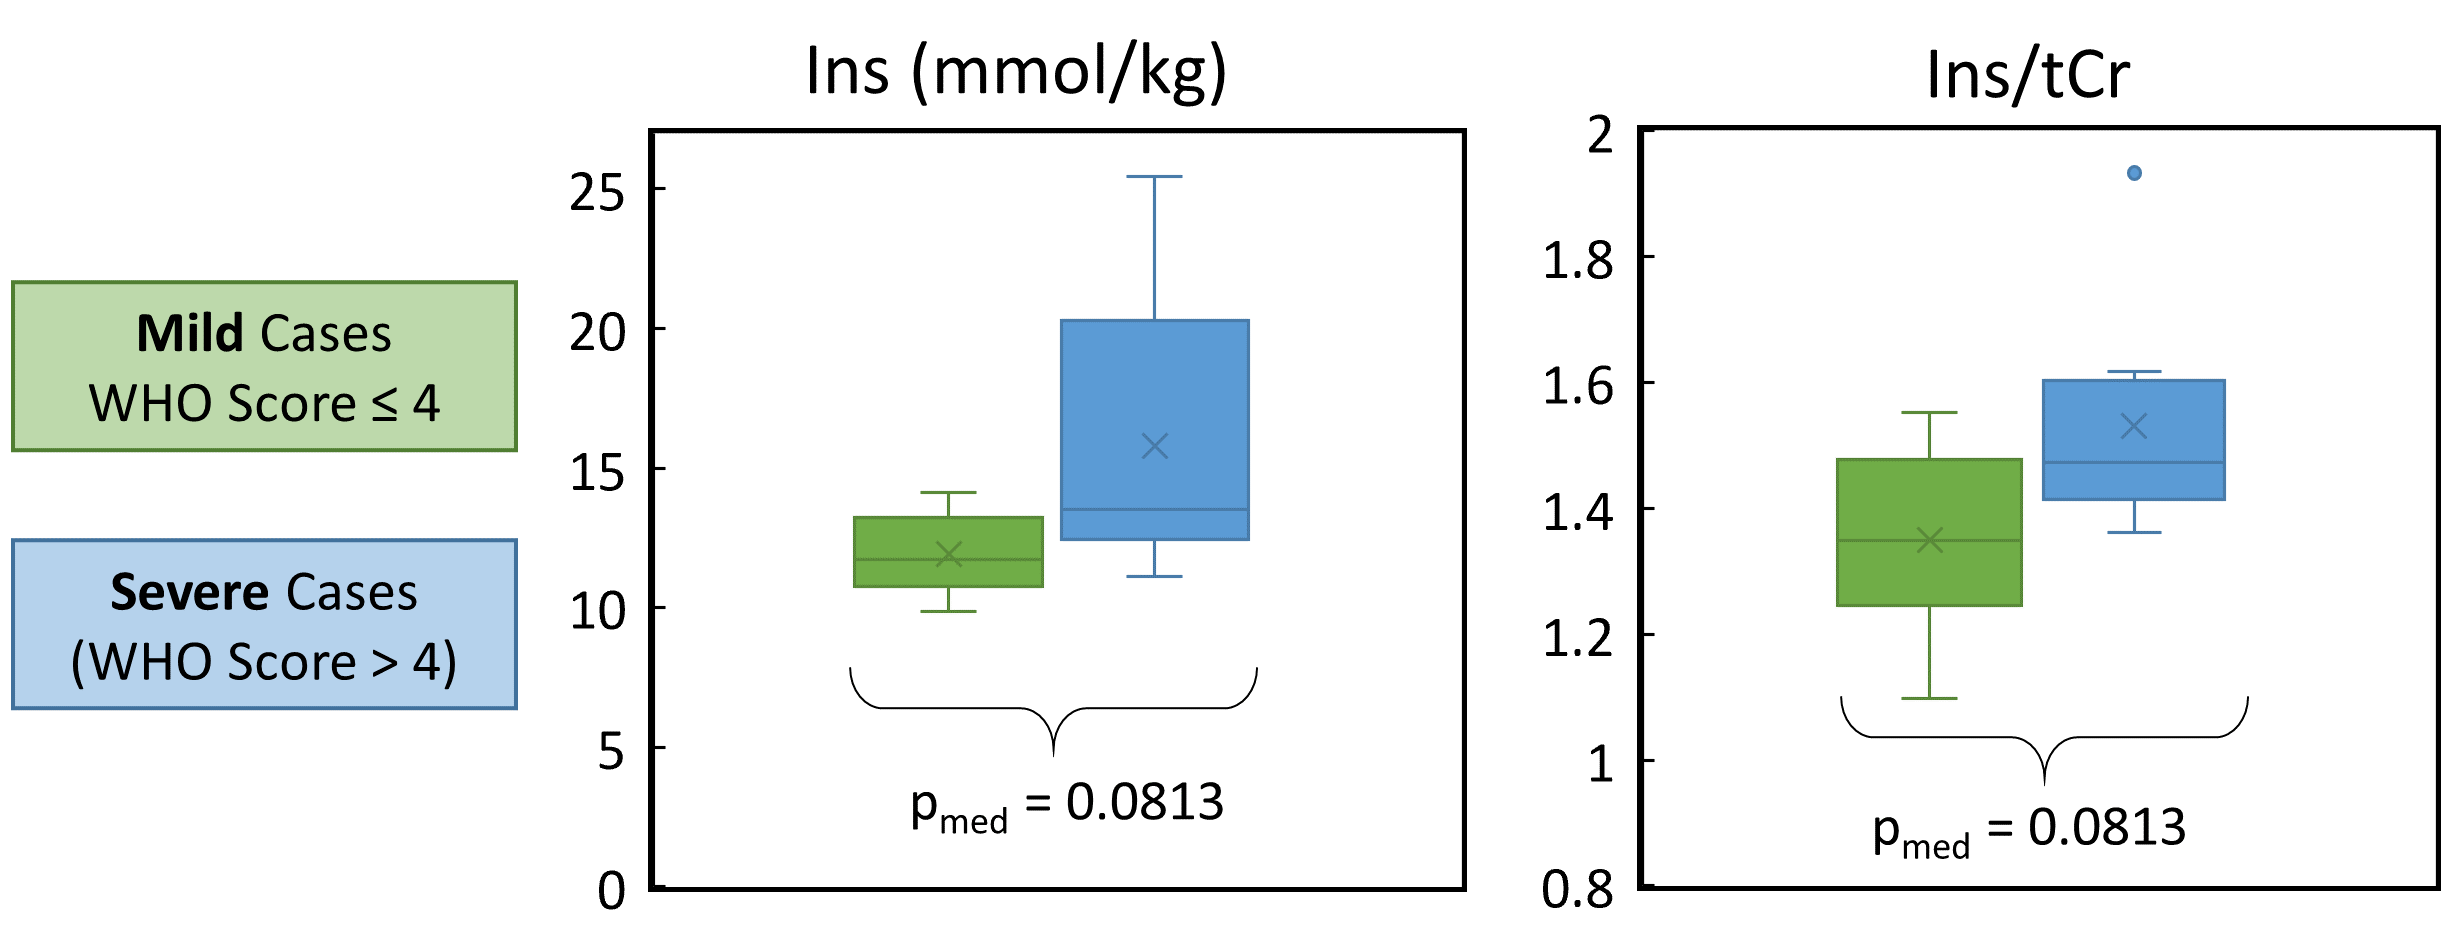
Figure 1: Impact of Disease Severity on metabolic marker of Inflammation:
Ins (water references) and Ins/tCr both showed a trend to increasing with COVID disease severity. However, note that neither difference was statistically significant for our cohort. This observation is biologically plausible since Ins reflects neuroinflammation, but it needs to be tested in a larger cohort and/or against matched controls to understand whether it is a real effect or not.