1727
Evaluation of noise/signal leaking in PCA-based DWI denoising methods1Indiana University, Bloomington, IN, United States
Synopsis
We propose a novel but simple method to evaluate noise/signal leaking in PCA-based denoising for diffusion MRI. This method was applied on MP-PCA and LPCA on a human dataset acquired with the ABCD protocol. The results show that MP-PCA is more conservative in removing the noise than LPCA and therefore has little signal leaking. On the other hand, LPCA has less noise leaking as it removed more noise than MP-PCA. Our proposed method can be an effective tool in assessing denoising performance in practice.
Introduction
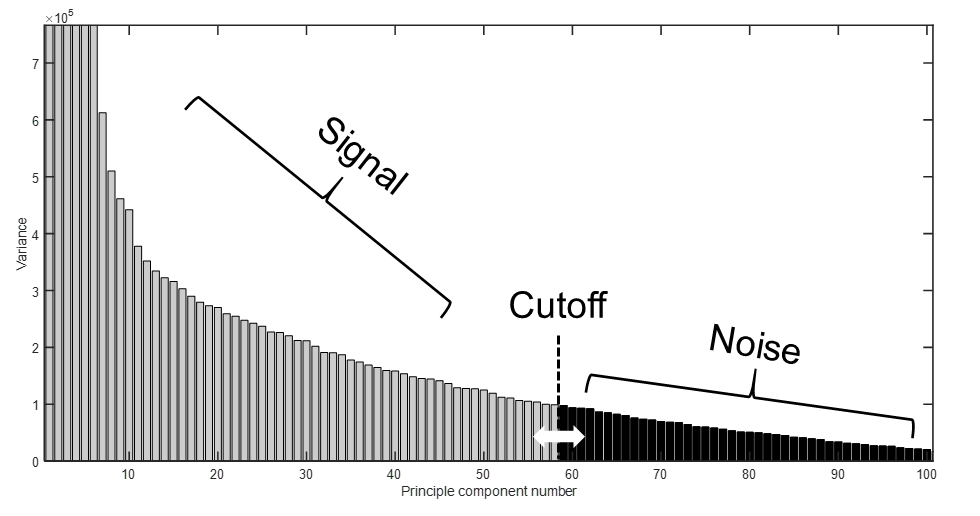
Denoising of diffusion MRI images is appealing because the low signal-to-noise ratio (SNR) of diffusion weighted images at high b-values. Recent studies show that denoising can effectively reduce the noise and improve the quality of derived diffusion metrics and tractography, facilitating more accurate analysis of tissue diffusion properties. Currently the principle component analysis (PCA) based diffusion algorithms are widely used, such as LPCA1 and MP-PCA2. The key to PCA-based denoising is to find the appropriate threshold to remove the “noisy” component while retaining the “signal” component (Fig. 1). If the threshold is too small, i.e., too many components are retained, there is little denoising effect; if the threshold is too large, some signals are removed as noise. Even an optimal threshold is chosen, the PCA cannot separate signal and noise perfectly and there are still leaking of signal to the noise components and noise to the signal components. The level of noise/signal leaking depends on the specific imaging data. Here we propose a simple approach to evaluate the noise/signal leaking for PCA-based diffusion MRI deonising algorithms. We applied this method on MP-PCA and LPCA as an example.Methods
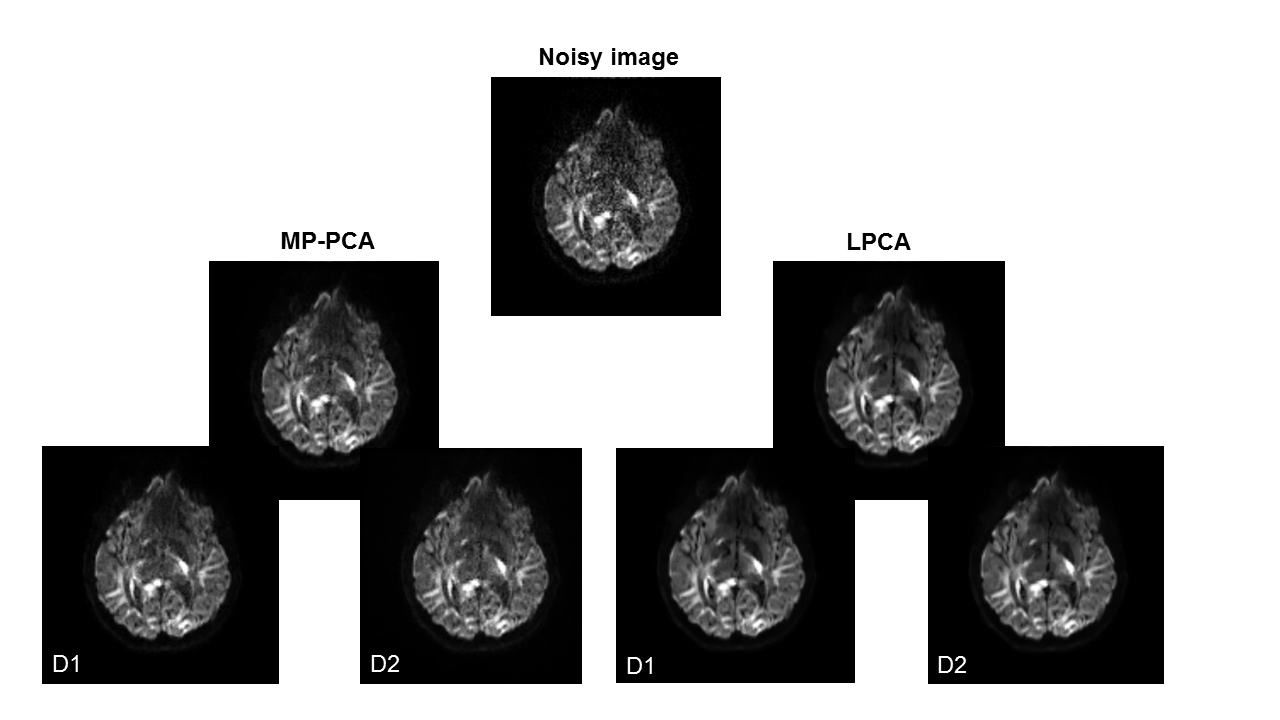
1. Evaluation of leaked noise The denoised image may still have some leaked noise. One can split the dataset into two halves D1 and D2 but share one volume of interest (say, Vi) and then perform the denoising on both subsets, as illustrated in Fig. 2. Hence, Vi is denoised twice along with different volumes. By subtracting the two denoised Vi, a noisy image is obtained, the standard deviation of the difference image should be no more than$$\sigma_d=\frac{\sqrt{2}}{\sqrt{N/2}}\sigma_0=\frac{2}{\sqrt{N}}\sigma_0$$,
where N is the number of volumes and σ0 is the original noise magnitude before denoising, which can be estimated from the DWI b0 images1. If the actual standard deviation is greater than σd, it is an indicator of noise leaking.
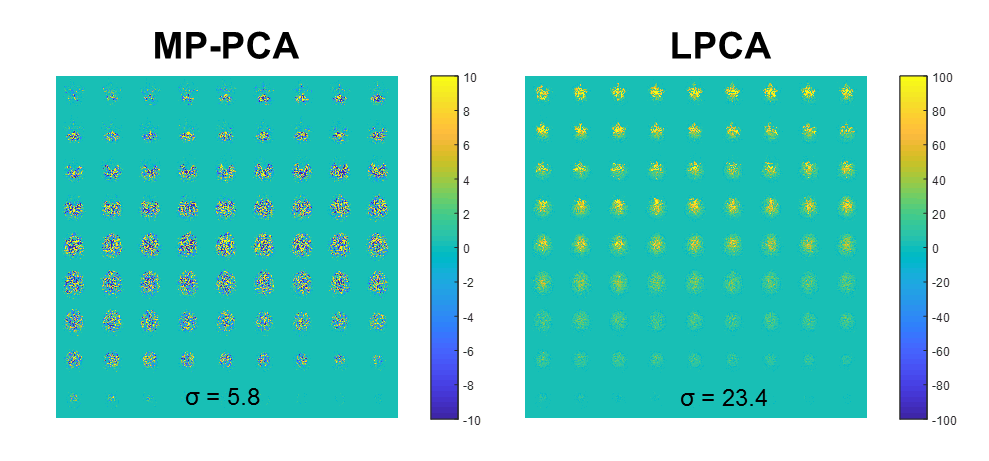
2. Evaluation of leaked signal To evaluate leaked signal, we propose to average all the DWI volumes to form a new volume with very low noise. This new volume Vn is appended to the DWI data and then the denoising is performed on the new dataset. If there is no signal leaking, the noise extracted from Vn should be similar to the noise extracted from the normal volumes but with much smaller magnitude.
We applied our methods to evaluate two denoising algorithms MP-PCA and LPCA on a human dataset. The DWI images were acquired using the ABCD DWI protocol3 on a 64-channel head coil on a Siemens 3T Prisma scanner. The data was denoised using MP-PCA and LPCA. We only focused on the denoising performance at high b-values and therefore an image with b-value = 3000 s/mm2 was randomly selected for demonstration.
Results
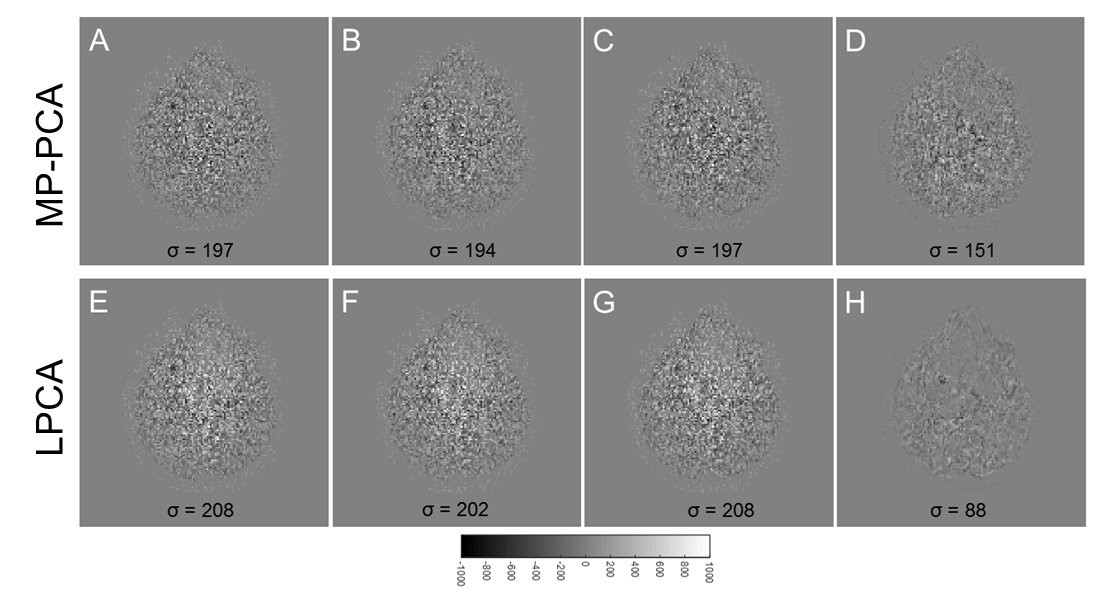
The denoising results using MP-PCA and LPCA are shown in Fig. 2 on a representative slice. The top panel of Fig. 3 shows the removed noises from MP-PCA denoising of the full dataset (3A), the removed noises from denoising of D1 and D2 (3B and 3C), and the difference between Fig. 3B and Fig. 3C is shown in Fig. 3D. The bottom panel shows the results of LPCA in the same way. The standard deviations of the noise of the whole volume are listed in the representative slice. The noise amplitude of the original image was calculated to be σ0 = 339. Therefore, we have σd = 66.8. This number is smaller than the standard deviation of the difference image for both MP-PCA and LPCA, indicating a noise leaking for both and more severe for MP-PCA.The extracted noise for the extra volume Vn is shown in Fig. 4 for MP-PCA and LPCA. The noise amplitude is very small for MP-PCA and evenly distributed around zero. For LPCA, however, the extract noise is all positive with larger amplitudes than those of MP-PCA, indicating contaminations of the DWI signal.
Discussion
We have proposed a novel but simple method to evaluate the performance of PCA-based denoising techniques for diffusion MRI with a focus on the noise/signal leaking. A comparison between MP-PCA and LPCA on a DWI image using the ABCD protocol suggests that MP-PCA was more conservative in removing the noise so that it did not cause signal contamination in the denoised image. LPCA, on the other hand, removed more noise but potentially introduced a trace of signal into the denoised images. While this observation holds for this specific dataset, it cannot be generalized to any dataset. However, the proposed method can be applied readily to most DWI datasets to assess the noise/signal leaking in practice.Acknowledgements
No acknowledgement found.References
1. Manjon, J.V., P. Coupe, L. Concha, A. Buades, D.L. Collins, and M. Robles, Diffusion weighted image denoising using overcomplete local PCA. PLoS One, 2013. 8(9): p. e73021.
2. Veraart, J., D.S. Novikov, D. Christiaens, B. Ades-Aron, J. Sijbers, and E. Fieremans, Denoising of diffusion MRI using random matrix theory. Neuroimage, 2016. 142:394-406.
3. Casey, B.J., et al., The Adolescent Brain Cognitive Development (ABCD) study: Imaging acquisition across 21 sites. Dev Cogn Neurosci. 2018. 32:43-54.
Figures