1724
Harmonization of diffusion kurtosis imaging metrics with rotational invariant spherical harmonics (RISH) to remove cross-site biases1Department of Neurology, University Medical Center Utrecht, Utrecht, Netherlands, 2PROVIDI Lab, Image Sciences Institute, University Medical Center Utrecht, Utrecht, Netherlands, 3Brigham and Women's Hospital, Harvard Medical School, Boston, MA, United States, 4Movement Control and Neuroplasticity Research Group, KU Leuven, Leuven, Belgium, 5Brain Institute, KU Leuven, Leuven, Belgium, 6Oslo Sports Trauma Research Center, Norwegian School of Sport Sciences, Oslo, Norway, 7Department of Applied Mathematics, Tel Aviv University, Tel Aviv, Israel, 8Sagol School of Neuroscience, Tel Aviv University, Tel Aviv, Israel, 9Department of Radiology, Charite University Hospital, Berlin, Germany, 10Department of Radiology, LMU Munich, Munich, Germany, 11cBRAIN, Department of Child and Adolescent Psychiatry, LMU Munich, Munich, Germany
Synopsis
Diffusion Kurtosis Imaging (DKI) metrics computed from diffusion MRI (dMRI) are affected by different acquisition protocols and scanner properties which limits their implementation in multicentric studies. We investigated whether harmonizing multi-shell dMRI with the rotation invariant spherical harmonics (RISH) method allows to remove cross-site differences in DKI metrics while retaining longitudinal effects. 46 subjects underwent a longitudinal two-shell dMRI protocol in 3 imaging sites. Our results show that the RISH method removes inter-site differences both at whole-brain and voxel-level while maintaining the effect-size of longitudinal changes, and is thus promising for the implementation of multi-site DKI studies.
Introduction
The quantification of diffusion kurtosis imaging1,2 (DKI) metrics with diffusion MRI (dMRI) data allows to probe the in-vivo organization of the human brain non-invasively. However, similar to other dMRI metrics, DKI metrics are sensitive to cross-scanner differences3, limiting their implementation in multicentric studies, which are useful to increase sample size for robust analyses.In this work, we investigate the generalization of the RISH-based single-shell harmonization method4 to multi-shell dMRI, to allow multi-site pooling of DKI metrics.
Methods
MRI acquisitionsThe dMRI data used in this study were acquired in three sites equipped with 3T scanners (Achieva, Ingenia, Ingenia CX, Philips Healthcare) and a 32-channels head coil running on software R5.3. The dMRI data was acquired at 2x2x2mm3 voxel resolution.
In Site1 and Site3, the sequence was accelerated with multi-band 2 and SENSE 1.5, resulting in echo time 113ms and repetition time 7.2s. In Site2, the repetition time was changed to 12s and SENSE to 2 due to the lack of multi-band functionality. The dMRI gradient scheme was as follows: 7 x b=0s/mm2, 20 x b=1000s/mm2, 30 x b=2500s/mm2. Additionally, 4 reversed phase encoded b=0 s/mm2 volumes were for EPI-related geometrical correction.
Participants were healthy controls scanned over multiple timepoints (TP) as part of the Repetitive Subconcussive Head Impacts (Repimpact) study. Demographics are shown in Table 1.
Data processing and harmonization
The dMRI data was corrected using FSL 5.116,7 and ExploreDTI5,8v4.8.6. The two dMRI shells were harmonized independently using the RISH method with orders 4 (L4) and 6 (L6), respectively. Site1 was used as reference.
The harmonization was trained with a subset of the available data, which was then applied on all data. Subsequently, the DKI model was fit using a linear-least squares fit to derive maps of fractional anisotropy9 (FA), mean diffusivity (MD) and mean kurtosis2 (MK).
Statistical analysis
A study specific template was created using FSL10. Voxel-wise ratios between the average RISH features (L0,L2,L4,L6) of the harmonized and reference sites were computed for the two shells individually. Cross-sectional differences in FA, MD, MK between the reference site and Site2/Site3 were investigated at voxel level11 (FSL “randomise”, 5000 iterations with TFCE12). Subsequently, the average longitudinal values of the DKI metrics were determined after non-linear registration13 in regions of the ICBM-DTI-81 atlas14. A post-hoc statistics harmonization method (ComBat15) was applied for comparison purposes. The longitudinal changes before and after harmonization were compared by means of the Cohen’s d and paired t-tests.
Results
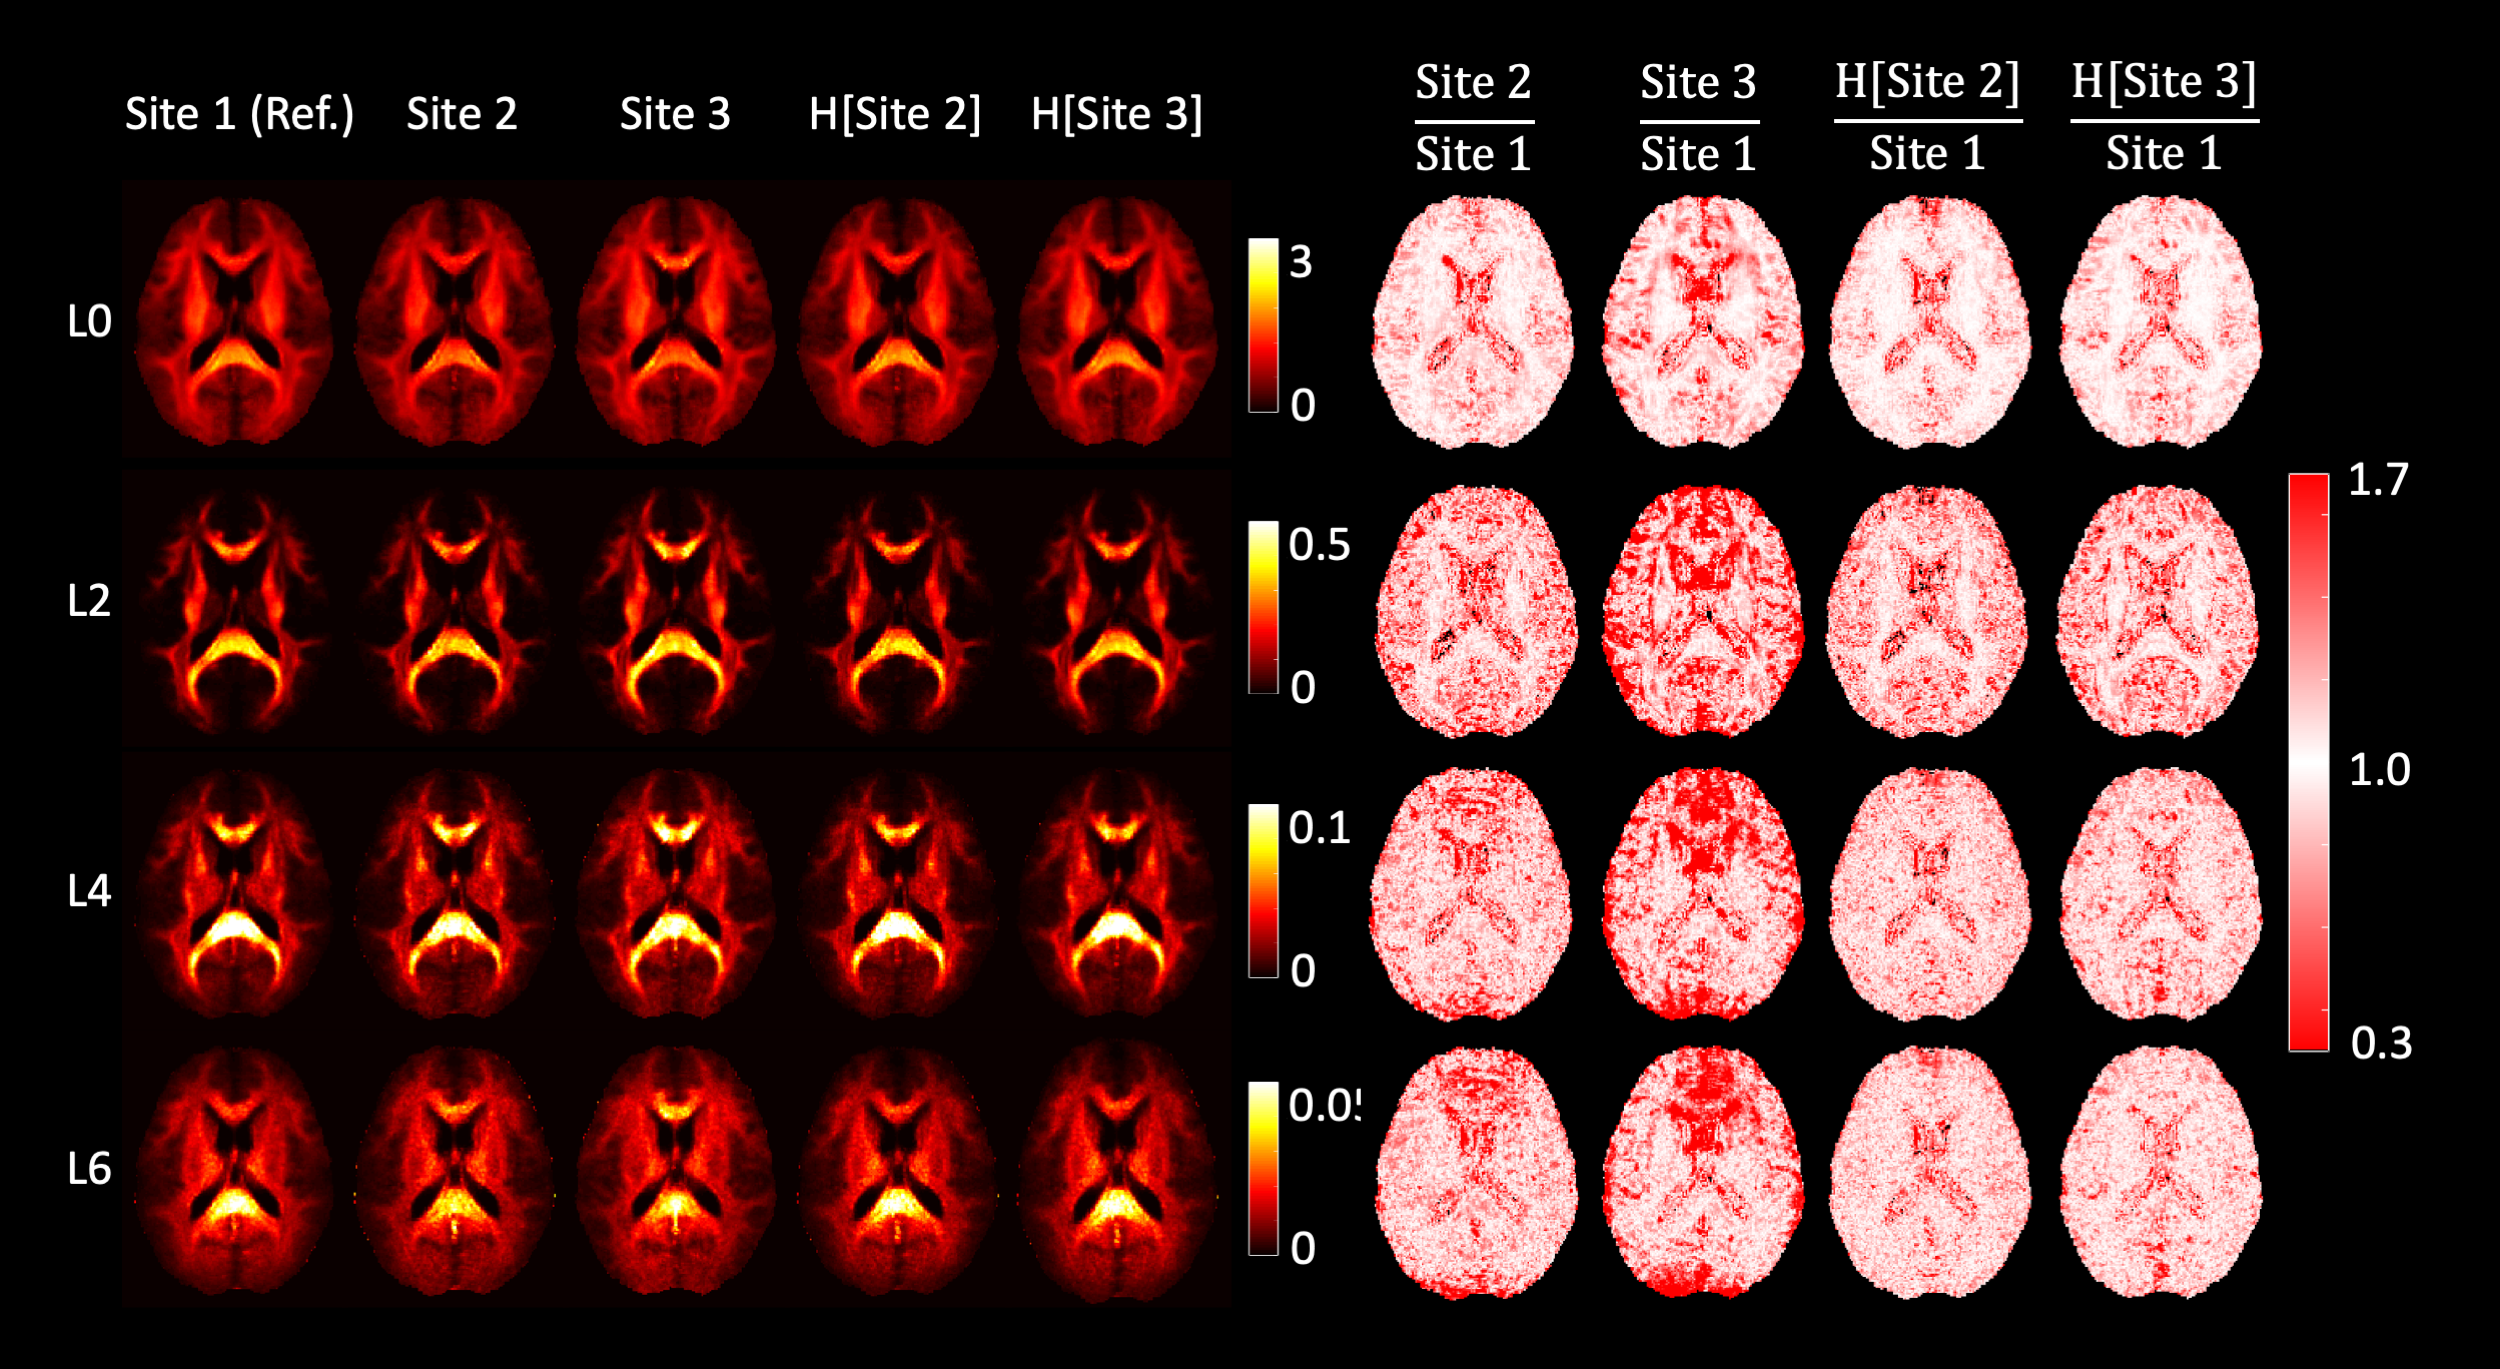
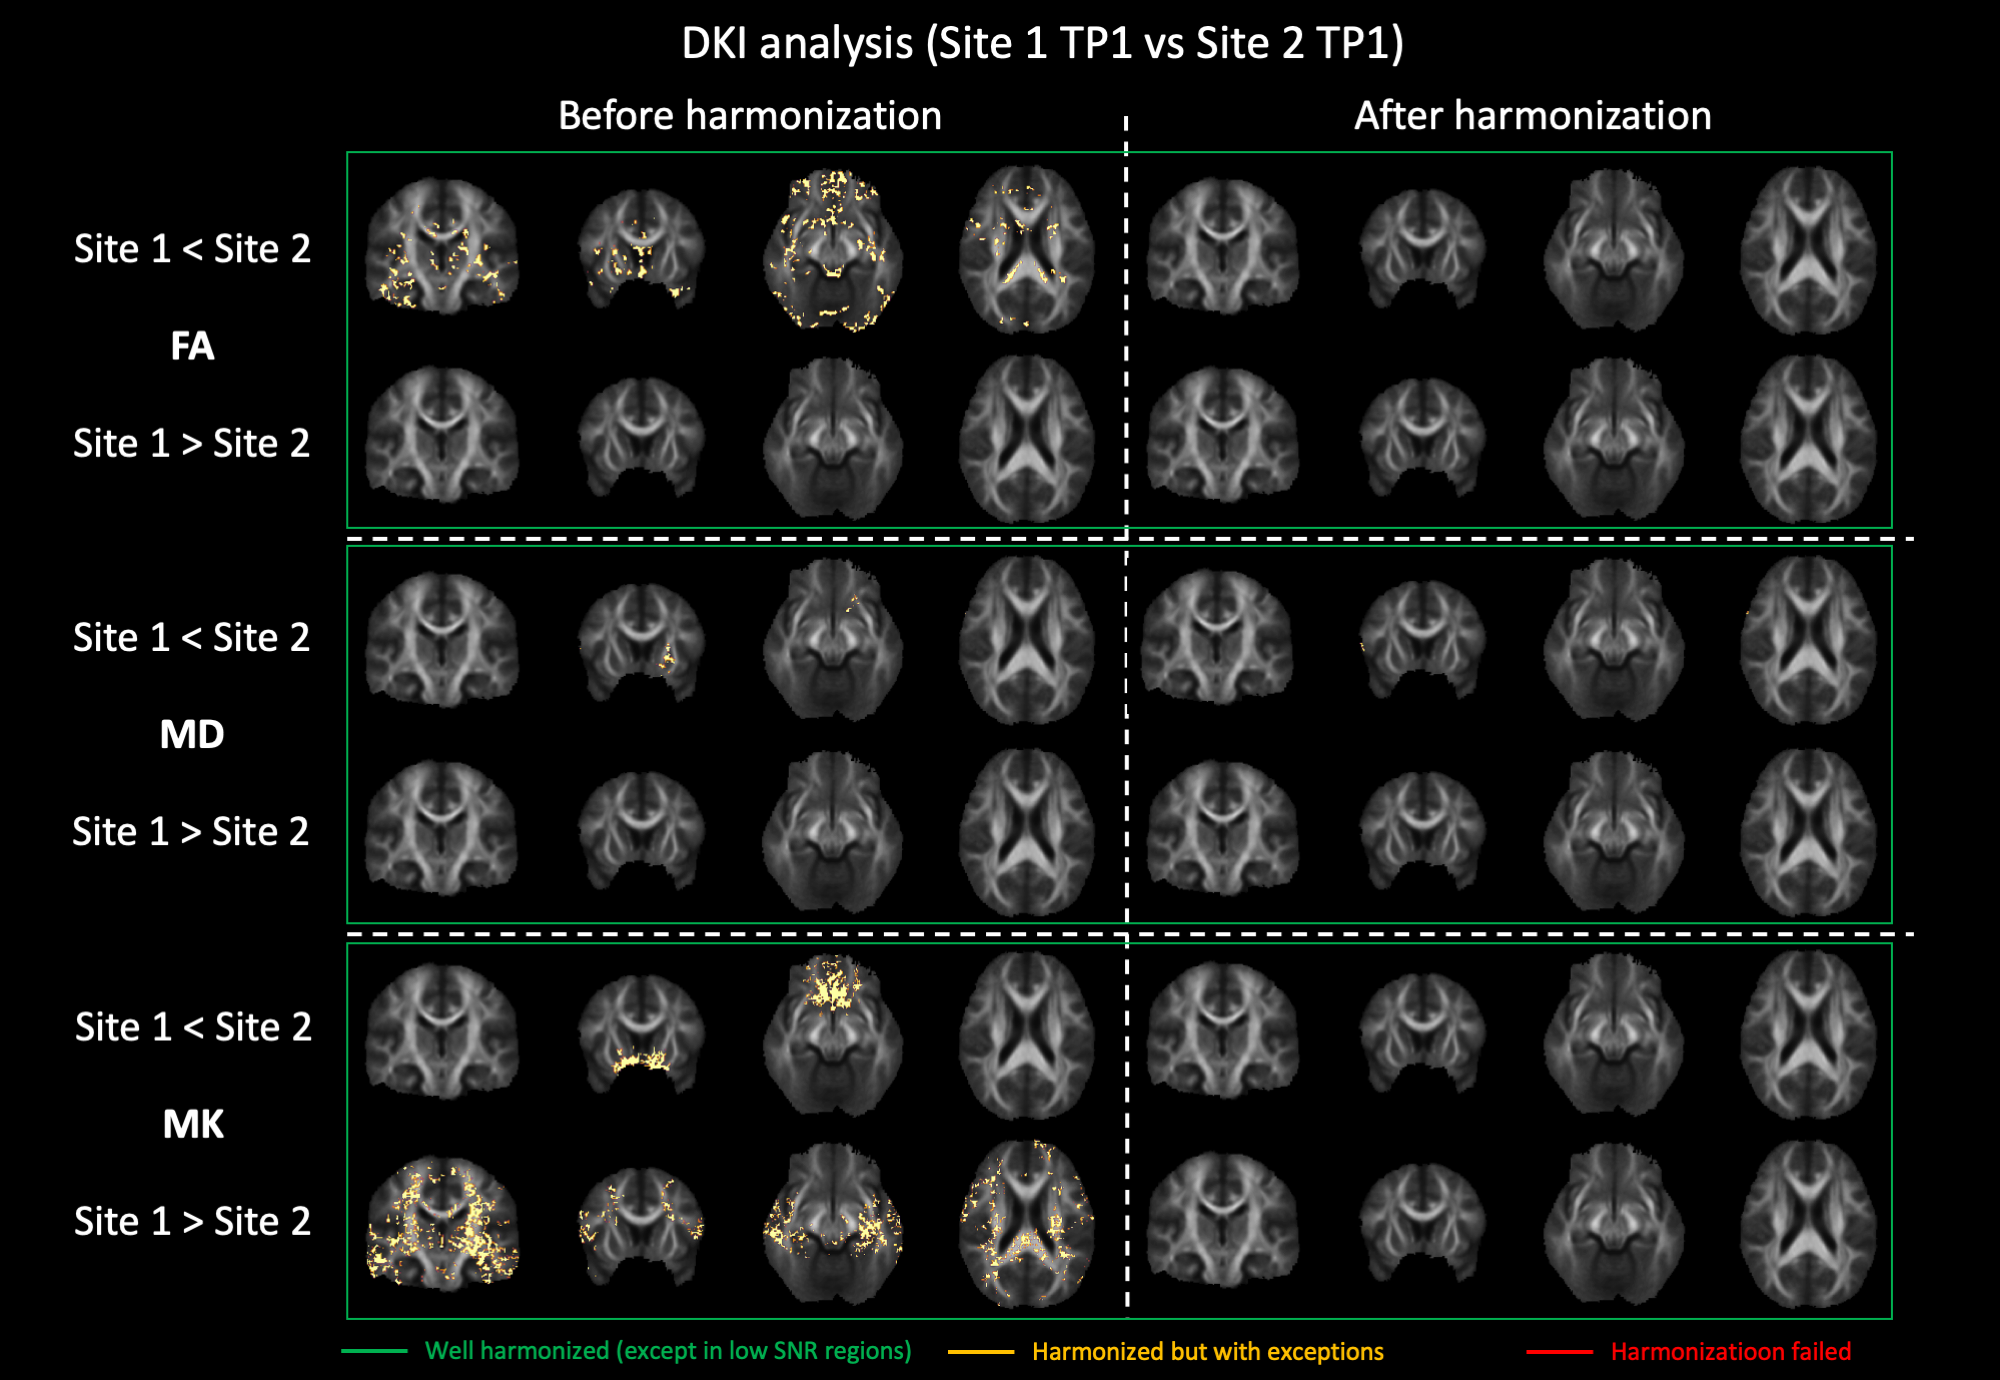
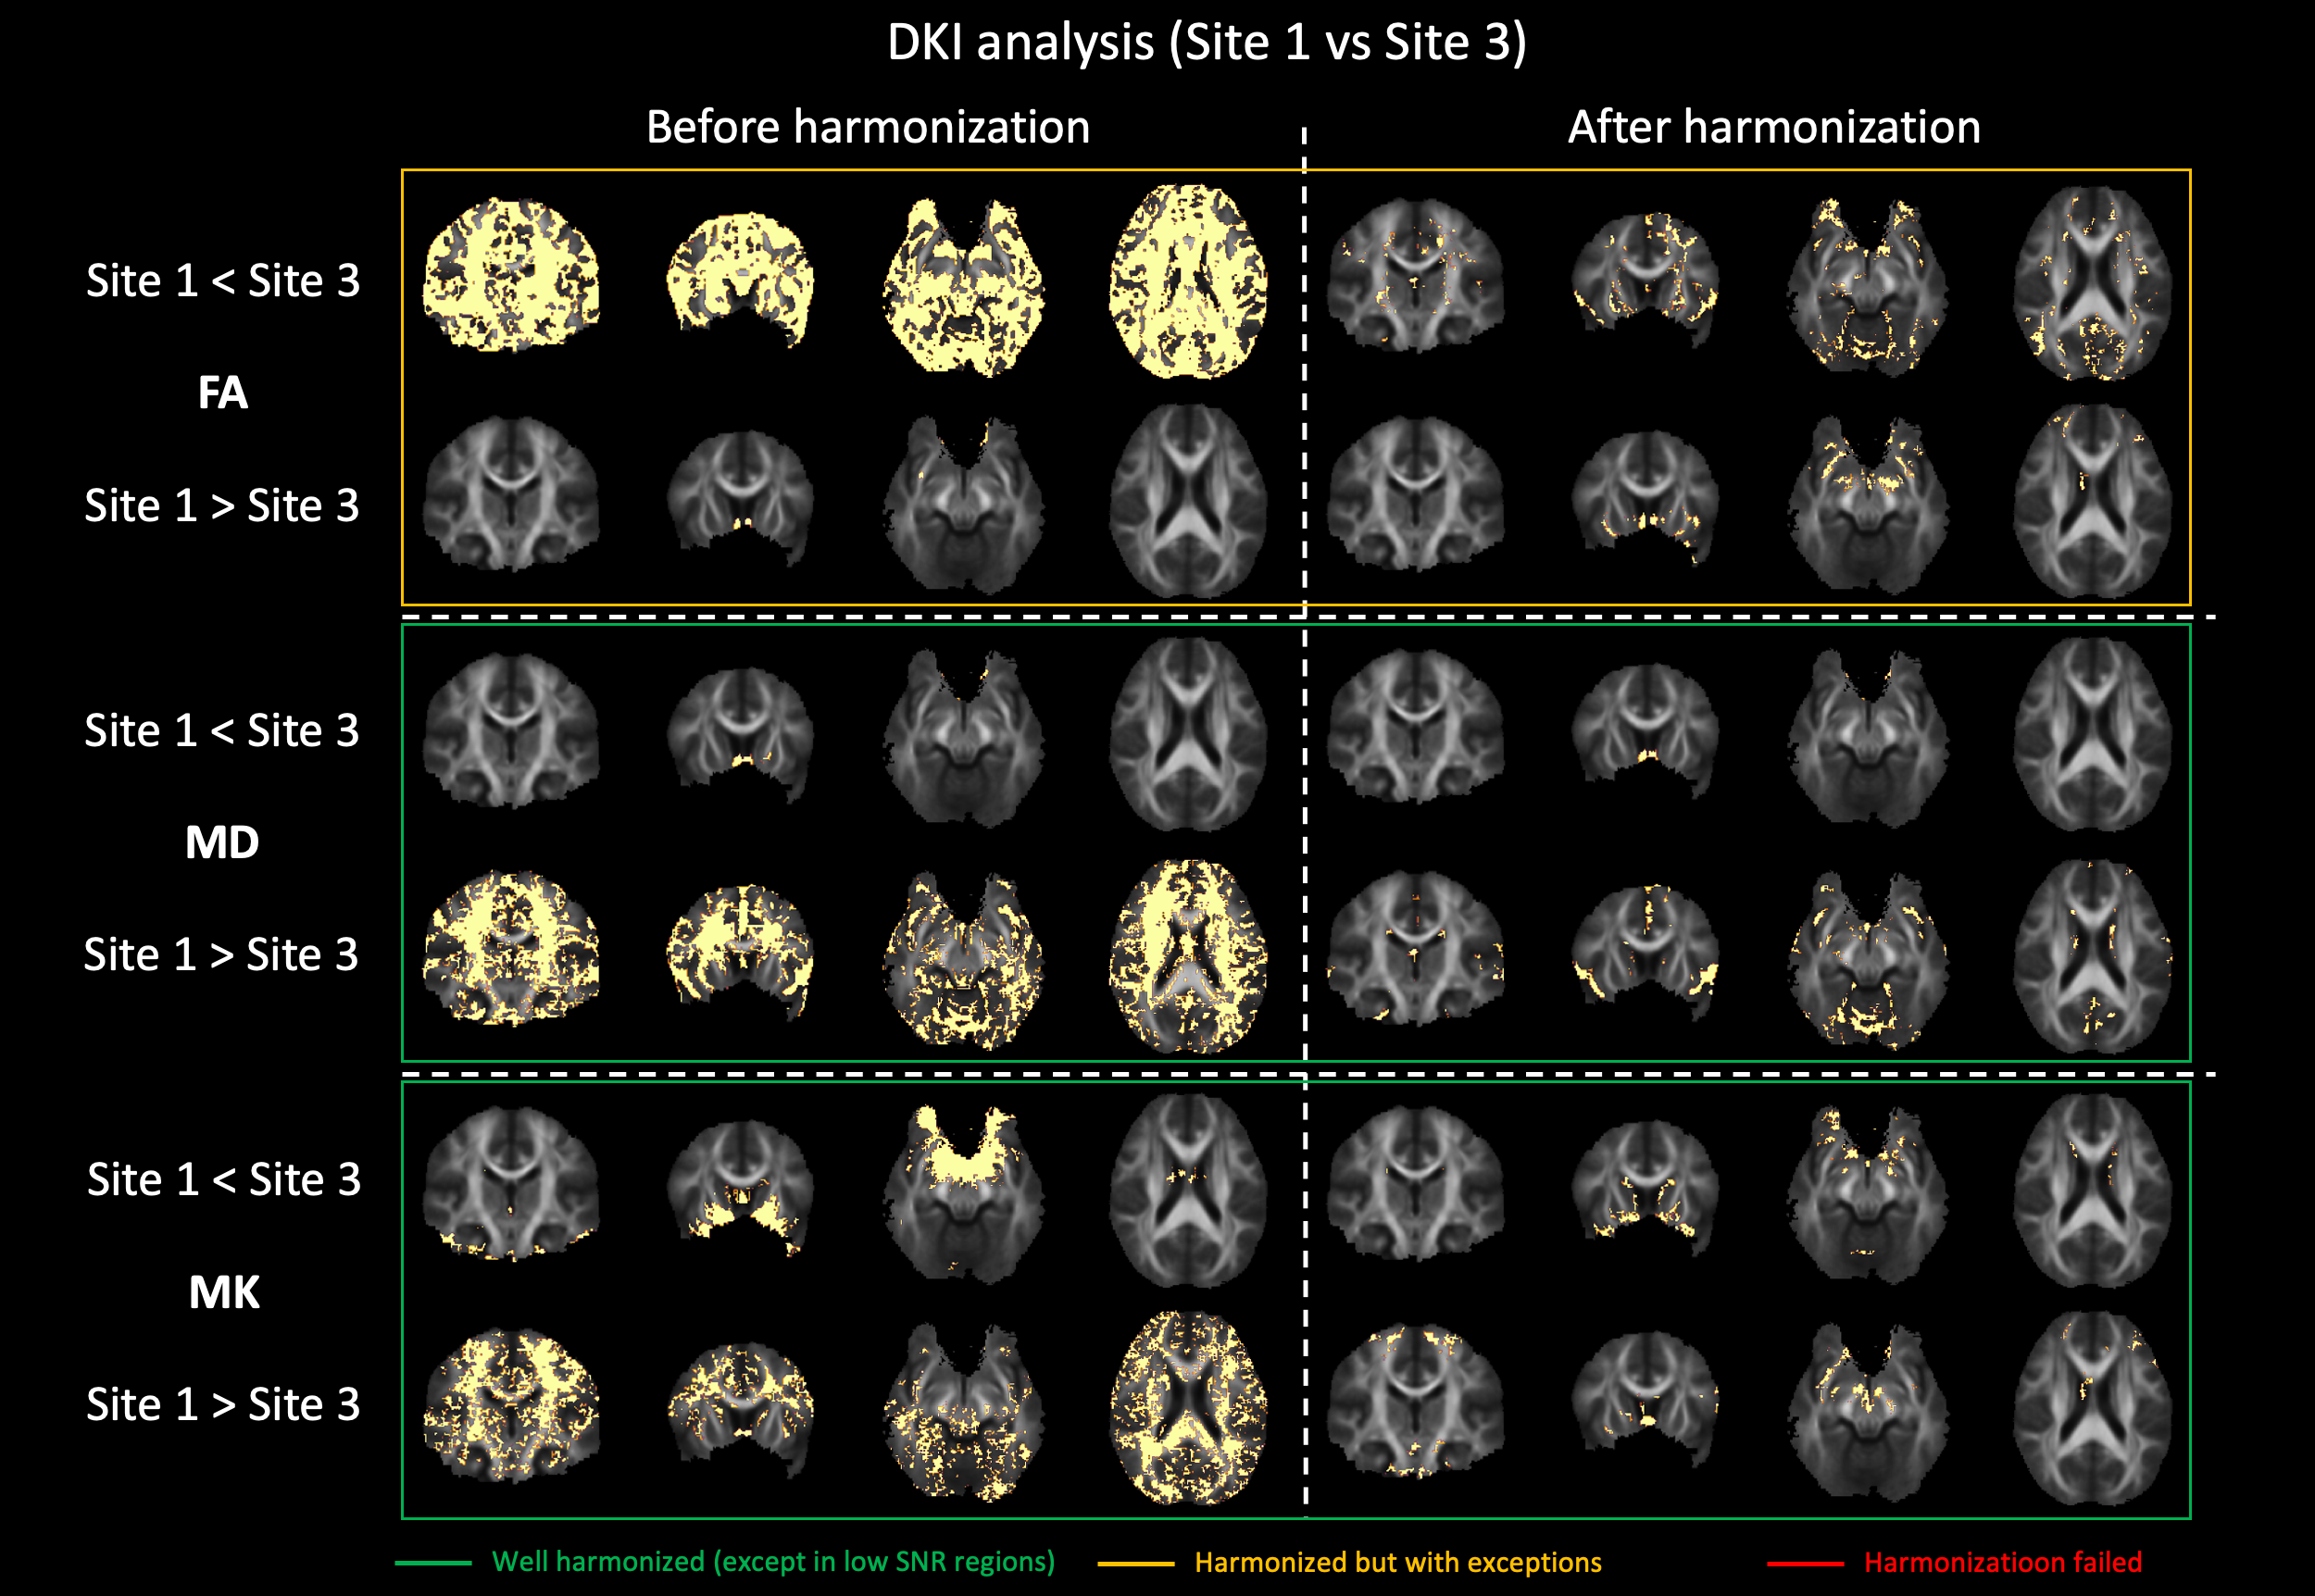
Fig. 1 shows the average RISH features of the data acquired in each site with b = 2500 s/mm2 before and after harmonization and their relative scaling. Before harmonization, a scaling up to 70% can be observed for Site2 in L0 in the ventricles and the medial temporal area, in L2 at the grey matter (GM)/cerebrospinal-fluid (CSF) interface, and in L4/L6 in the frontal and posterior part of the brain. Similar patterns were observed also between Site3 and Site1 but with larger magnitude. After harmonization, most scaling differences in RISH features were removed, especially for L0, L4 and L6. Residual differences above 30% can be spotted in the average L2 ratio maps, but mostly in GM and CSF areas. Similar differences were observed for b = 1000 s/mm2 (not shown).The voxel-wise comparison of FA, MD and MK metrics at TP1 between Site1 and Site2 is shown in Fig. 2. Before harmonization, clusters of significantly different FA, MD and MK values could be observed, but not after. Fig. 3 reports the results of the same voxel-wise analysis between all TPs of Site1 and Site3. Before harmonization, statistically lower FA values, higher MD and MK values in Site1 were observed in 69.4%, 41.2% and 29.5% of the brain voxels, respectively. After harmonization, these differences were reduced to 8.9%, 5.1% and 4.2%, respectively.
The results of the longitudinal analysis are shown in Table 2. In Site2, significant longitudinal changes were observed in FA and MK between TP2 and TP1, and neither the RISH-based method nor ComBat significantly altered their effect-size.
Discussion and conclusion
We demonstrated that DKI metrics exhibit cross-site statistical differences even when the data is acquired with scanners from the same vendor and almost identical acquisition protocols. We further show that the RISH method applied to multi-shell dMRI effectively removes cross-site differences in DKI metrics, extending previous findings with travelling heads16. Residual differences in DKI metrics after harmonization in Site3 highlight a suboptimal harmonization result and might be due to the low sample size of that site.An important result is that the application of harmonization does not alter longitudinal changes, and allows to detect changes in FA and MK as expected in an adolescent population17. Importantly, once the RISH method is applied, any analysis method of choice – including voxel-wise analysis – can be applied. This is not the case for ComBat that requires separate harmonization for each outcome measure. However, the RISH method only applies to dMRI data collected in shells with sufficient gradient orientations in each shell.
In conclusion, RISH harmonization appears suitable to pool multi-center dMRI data to perform DKI analyses, which is important to perform robust inference and investigate hypotheses with small effect size.
Acknowledgements
No acknowledgement found.References
1. Jensen, J. H., Helpern, J. a, Ramani, A., Lu, H. & Kaczynski, K. Diffusional kurtosis imaging: the quantification of non-gaussian water diffusion by means of magnetic resonance imaging. Magn. Reson. Med. 53, 1432–40 (2005).
2. Jensen, J. H. & Helpern, J. a. MRI quantification of non-Gaussian water diffusion by kurtosis analysis. NMR Biomed. 23, 698–710 (2010).
3. Tax, C. M. et al. Cross-scanner and cross-protocol diffusion MRI data harmonisation: A benchmark database and evaluation of algorithms. Neuroimage 195, 285–299 (2019).
4. Cetin Karayumak, S. et al. Retrospective harmonization of multi-site diffusion MRI data acquired with different acquisition parameters. Neuroimage 184, 180–200 (2019).
5. Vos, S. B. et al. The importance of correcting for signal drift in diffusion MRI. Magn. Reson. Med. 22, 4460 (2016).
6. Andersson, J. L. R., Skare, S. & Ashburner, J. How to correct susceptibility distortions in spin-echo echo-planar images: application to diffusion tensor imaging. Neuroimage 20, 870–88 (2003).
7. Andersson, J. L. R. & Sotiropoulos, S. N. An integrated approach to correction for off-resonance effects and subject movement in diffusion MR imaging. Neuroimage 125, 1063–78 (2016).
8. Leemans, A., Jeurissen, B., Sijbers, J. & Jones, D. K. ExploreDTI: a graphical toolbox for processing, analyzing, and visualizing diffusion MR data. in 17th annual meeting of the International Society for Magnetic Resonance in Medicine, Honolulu, Hawaii, USA 3537 (2009).
9. Pierpaoli, C. & Basser, P. J. Toward a quantitative assessment of diffusion anisotropy. Magn. Reson. Med. (1996).
10. Jenkinson, M., Beckmann, C. F., Behrens, T. E. J., Woolrich, M. W. & Smith, S. M. FSL. Neuroimage 62, 782–90 (2012).
11. Winkler, A. M., Ridgway, G. R., Webster, M. A., Smith, S. M. & Nichols, T. E. Permutation inference for the general linear model. Neuroimage 92, 381–97 (2014).
12. Smith, S. M. & Nichols, T. E. Threshold-free cluster enhancement: addressing problems of smoothing, threshold dependence and localisation in cluster inference. Neuroimage 44, 83–98 (2009).
13. Klein, S., Staring, M., Murphy, K., Viergever, M. A. & Pluim, J. P. W. elastix: a toolbox for intensity-based medical image registration. IEEE Trans. Med. Imaging 29, 196–205 (2010).
14. Mori, S., Wakana, S., van Zijl, P. C. M. & Nagae-Poetscher, L. M. MRI Atlas of Human White Matter. (Elsevier Science, 2005).
15. Fortin, J. P. et al. Harmonization of cortical thickness measurements across scanners and sites. Neuroimage 167, 104–120 (2018).
16. Ning, L. et al. Cross-scanner and cross-protocol multi-shell diffusion MRI data harmonization: Algorithms and results. Neuroimage 221, (2020).
17. Falangola, M. F. et al. Age-related non-Gaussian diffusion patterns in the prefrontal brain. J. Magn. Reson. Imaging 28, 1345–1350 (2008).
Figures