1721
Multimodal Apparent Diffusion (MAD) Magnetic Resonance Imaging with comprehensive quantification of diffusion in the brain1Radiology, University of Illinois at Chicago, Chicago, IL, United States, 2Biomedical Engineering, Purdue University, West Lafayette, IN, United States, 3Pathology, University Of Illinois at Chicago, Chicago, IL, United States
Synopsis
In physiological and pathological conditions in which multiple underlying tissue properties are expected to vary the diffusion weighted signal, the diagnostic value of conventional apparent diffusion coefficient (ADC) notably decreases. The proposed method extracts four separate distributions, i.e., modes, of diffusion weighted signal, which includes flow and unimpeded, hindered, and restricted diffusion, thereby increasing the precision of quantification of the hindered diffusion in grey and white matters.
Purpose
In physiological and pathological conditions in which multiple underlying tissue properties are expected to vary the diffusion weighted image (DWI) signal, the diagnostic value of conventional apparent diffusion coefficient (ADC) notably decreases. We developed a multimodal apparent diffusion model with four stretch exponential modes to comprehensively describe four separate apparent diffusivity distributions, including flow with D >> 3 µm2/ms, and, unimpeded diffusion with D ≈ 3 µm2/ms, hindered diffusion with 0.1 µm2/ms < D < 3 µm2/ms, and restricted diffusion with D << 0.1 µm2/ms. In this preliminary study, we demonstrate the refined precision of the hindered diffusion mode within gray and white matter.Methods and Materials
Under an approved IRB protocol, full spectrum of diffusion weighted images were acquired from healthy subjects (n=4) using 22 b‑values from 0 to 5000 s/mm2 in 7 minutes, on a 3T MRI scanner (GE MR750). In this study, DWI data was modeled voxel-wise as a sum of four stretch exponential[1-3] modes: flow (fF, DF, αF=1), unimpeded (fUI, DUI=3 µm2/ms, αUI=1), hindered (fH, DH, αH), and restricted (fR, DR = 0.0001 µm2/ms, αR=1), where fx is the fraction of voxel attenuation explained by mode x, Dx is the diffusivity, and αx is the distribution shape narrowness (from 0.5 – uniform distribution, to 1 – delta function, i.e., monoexponential). Parameters that could not be determined empirically were fixed as specified. Regression of diffusion weighted MRI voxel signal was performed using successive linearized fitting using a Theil-Sen linear regressor (which is resilient up to 29.3% outliers)[4-5] , thusly, the stretch exponential,$${S_b}/{S_0}=e^{-(b \cdot {D_x})^{\alpha_x}}$$
was be linearized to,
$$\ln(-ln({S_b}/{S_0}))={\alpha_x}ln{b}+{\alpha_x}ln{D_x} $$
and given these two postulates ( $$$\mu_N$$$ – noise floor),
$$ln({f_1}e^{-(b \cdot {D_1})^{\alpha_1}} + {f_2}e^{-(b \cdot {D_2})^{\alpha_2}} ) \simeq{\alpha_3}ln{b} + {\alpha_3}ln{D_3} \;:\;{D_2} \ll {D_1} \;and\; {f_1}e^{-(b \cdot {D_1})^{\alpha_1}}, {f_2}e^{-(b \cdot {D_2})^{\alpha_2}} \gg {\mu_N}$$
and,
$$ln({f_1}e^{-(b \cdot {D_1})^{\alpha_1}} + {f_2}e^{-(b \cdot {D_2})^{\alpha_2}} ) \simeq ln {f_2} - b \cdot {D_2} \;:\;{D_2} \ll {D_1} \;and\; {f_1}e^{-b \cdot {D_1}} \ll {\mu_N}\;and\;{f_2}e^{-b \cdot {D_2}} \gg {\mu_N}$$
each voxel’s linearized diffusion signal can be examined for the deviations from linearity and thus ranges of b-values selected for each apparent diffusion mode. Note that there were no recognized means during regression to correct and/or compensate for corruption due to pulsatile flow, especially at b = 0+ s/mm2. These voxels are identified using a Pearson correlation coefficient rxy, within the range 0+ to 150 s/mm2, where -1 is perfectly valid and +1 is perfectly invalid, and herein referred to as low b bad.
Results
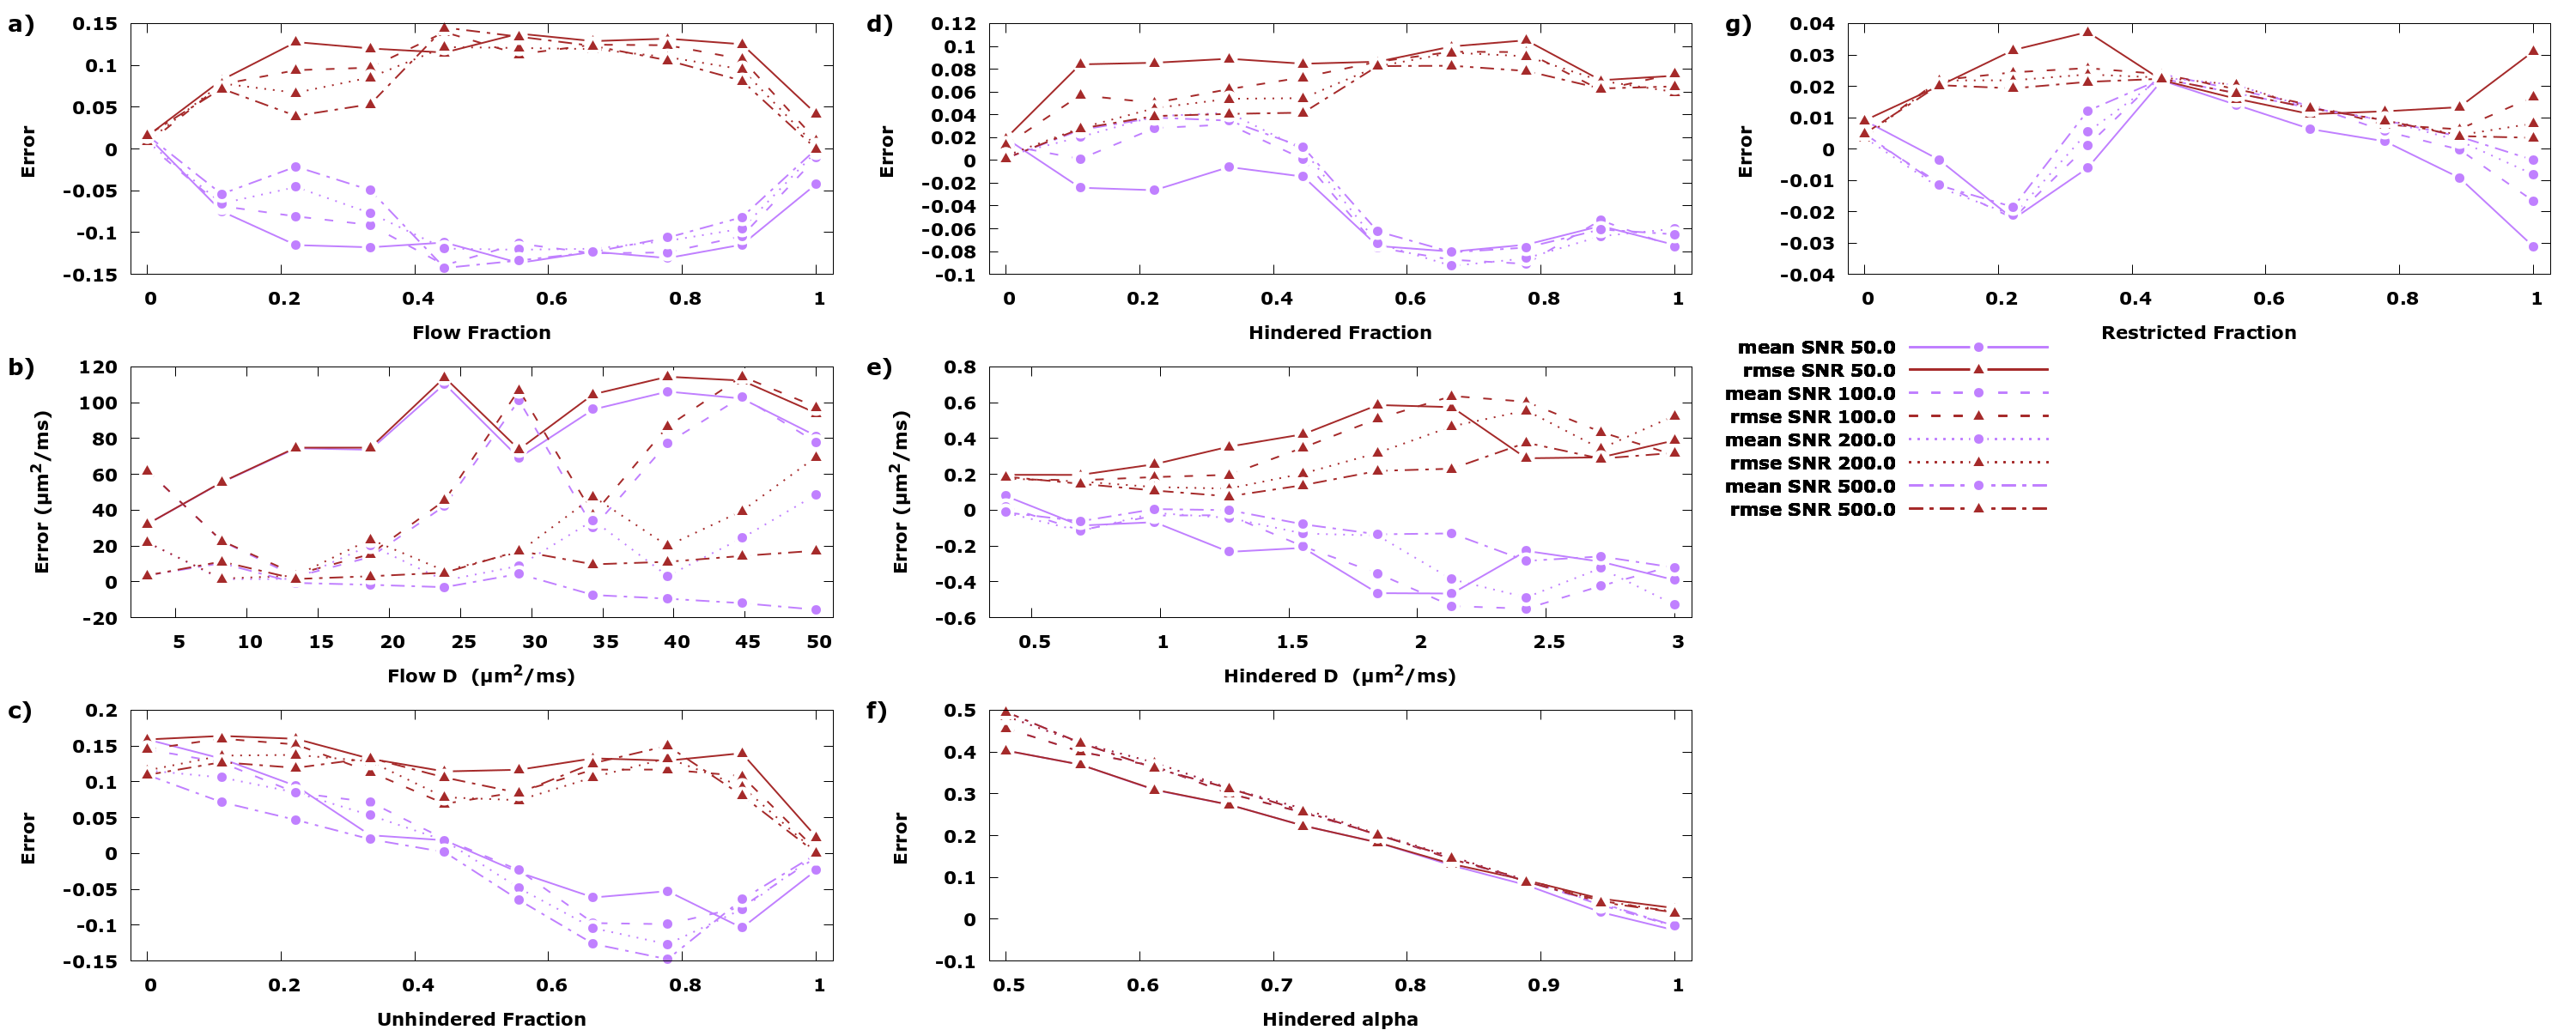
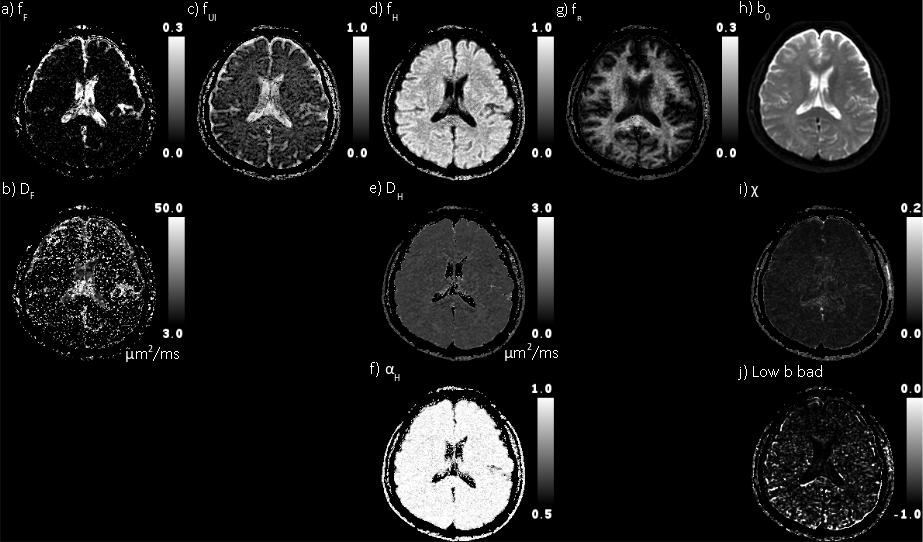
A Monte Carlo simulation was performed to evaluate the fitting accuracy of the quad modal model’s parameters, as demonstrated in Figure 1, and it depicted some trade offs in the fitting accuracy of the parameters. First, the inaccuracy of the modes’ fraction follows the successive order of fitting, i.e., R, H, UI, F; see Figure 1. Even though closest to the noise floor, the restricted fraction is regressed with relatively high accuracy. Second, there is a trade off between large DH and a large fUI. And third, the accuracy of the hindered shape parameter is proportional to αH. As expected, increasing the images’ SNR increases the regression’s accuracy.For evaluation of the proposed quad-modal model in a healthy adult brain, see Figure 2. Appreciate the correspondences to fundamental physiological properties, fF to communicating CSF, fUI to CSF, fH>0.8 to cortical GM, and fR>0.1 to WM. The χ map lacks an apparent correspondence to anatomy, except for fluid-tissue boundaries. The undulation at luminal surfaces may explain elevated residuals at these locations. There appears to be an inverse correlation in the A/P direction between the low b bad map and the subarachnoid CSF.
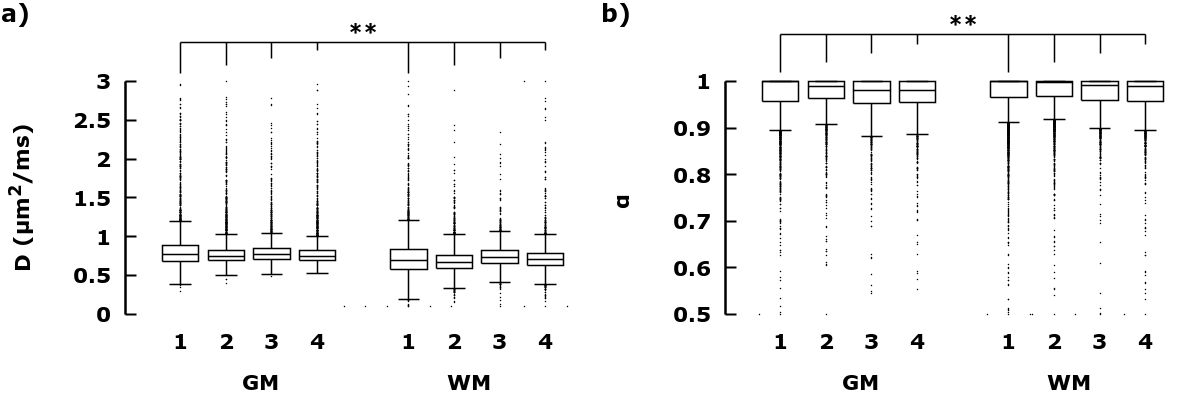
With the elimination of the flow, unrestricted, and highly restricted diffusion components, the distribution of hindered diffusitivities, across the presented healthy brain slice, have been centered (DH at 0.735±0.25 μm2/ms) and narrowed (αH at 0.96±0.06) (μ±σ). The distributions of DH and αH within cortical GM (fH > 0.8) were observed at 0.757±0.091 μm2/ms and 0.972±0.033, respectively; and within WM (fR > 0.1) at 0.706±0.124 μm2/ms and 0.978±0.0326, respectively. Both DH and αH between GM and WM differ significantly (p<0.01 , Student t-test). See figure 3 for comparison across four healthy subjects.
Conclusion
With accurate and comprehensive fitting of the distributions of apparent diffusion for GM and WM, MAD MRI may be utilized for comprehensively study microstructural changes of brain under healthy and pathological conditions.Acknowledgements
The work is partly supported by University of Illinois at Chicago Radiology departmental research funds and the National Institutes of Health [R21EB023516, R21AG053876, and R01AG061114].References
1 Köpf M, Corinth C, Haferkamp O, Nonnenmacher TF. Anomalous diffusion of water in biological tissues. Biophys. J. 1996;70:2950–2958 doi: 10.1016/S0006-3495(96)79865-X.
2 Köpf M, Corinth C, Haferkamp O, Nonnenmacher TF. Anomalous diffusion of water in biological tissues. Biophys. J. 1996;70:2950–2958 doi: 10.1016/S0006-3495(96)79865-X.
3 Bennett KM, Schmainda KM, Bennett R, Rowe DB, Lu H, Hyde JS. Characterization of Continuously Distributed Cortical Water Diffusion Rates With a Stretched-Exponential Model. Magn. Reson. Med. 2003;50:727–734 doi: 10.1002/mrm.10581.
4 Theil H. A rank-invariant method of linear and polynomial regression analysis. I, II, III. Nederl. Akad. Wetensch., Proc 53:386–392.
5 Sen PK. Estimates of the regression coefficient based on Kendall’s Tau. J. Am. Stat. Assoc. 1968;63:1379–1389 doi: 10.2307/2285891.
Figures