1719
A Deep Learning Method for Connectome Reconstruction Using Clinical MRI Protocols1School of Biomedical Engineering, The University of Sydney, Sydney, Australia, 2The University of Sydney, Sydney, Australia, 3Fudan University, Shanghai, China
Synopsis
In this study, a deep learning model called FODSRM was developed for fiber orientation distribution (FOD) super-resolution, which enhances single-shell low-angular-resolution FOD computed from clinic-quality dMRI data (e.g., 32 directions b=1000) to obtain the super-resolved high-angular resolution quality that would have been produced from advanced research scanners (e.g., multi-shell HARDI data). The results demonstrate that the super-resolved FOD data generated by the proposed method can generate high-definition structural connectome from clinical acquisition protocols, even when applied to data from a protocol not included in the trained dataset.
Introduction
Mapping the human connectome permits the study of brain connectivity and yields new insights into neuroscience1. However, reliable connectome reconstruction using diffusion MRI (dMRI) data acquired by widely available low-angular resolution clinical protocols remains a challenge, which further limits connectome applications at larger clinical scale.Purpose
We developed a deep-learning-based framework for fiber orientation distribution (FOD) super-resolution (FODSR). Our method enhances single-shell low-angular-resolution (LAR) FOD computed from clinic-quality dMRI data to obtain the super-resolved high-angular resolution quality that would have been produced from advanced research scanners. The super-solved FODs can be used for reliable connectome reconstruction, which has close quality to that obtained from multi-shell high-angular-resolution state-of-the-art research dMRI protocols.Method
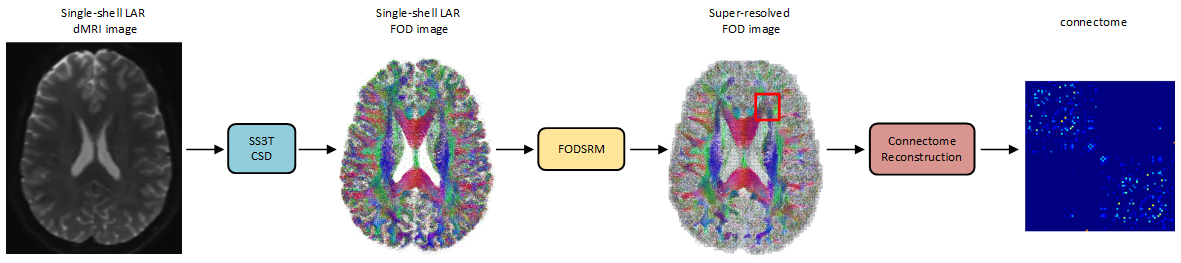
Our deep learning model FODSRM (fiber orientation distribution super-resolution method) takes (sequentially) as input an FOD patch cropped from a single-shell LAR FOD image, which is generated by the state-of-the-art single-shell 3-tissue constrained spherical deconvolution (SS3T CSD)2, and outputs the super-resolved version of the central voxel of this patch. Once the super-resolved FOD voxel for each patch has been obtained, they are combined together in the reverse order of the cropping operation to generate the super-resolved FOD data, which is the output of FODSRM. Then the super-resolved FOD data is used for connectome reconstruction, which is performed by SIFT2-based3 whole-brain tractography4, and then the Desikan-Killiany atlas was employed to calculate the connectome. (see Figure 1 for the pipeline). Human Connectome Project (HCP) data5 were selected to train our model as it is one of the largest dMRI dataset acquired with sophisticated protocols. Furthermore, as single-shell 32-direction dMRI images with low b value (b=1000) are widely used in practical clinical settings, we generated clinically accessible dMRI data (i.e. single-shell LAR) from the original multi-shell high-angular-resolution: we subsampled the first 32 directions from the b=1000 s/mm2 shell, as the HCP protocol samples directions in an incremental way such that any sequential subset would result in an approximately optimal design. Finally, the b0 volume is added into the extracted 32 directions to obtain the complete single-shell low-angular resolution dMRI dataset. The ‘ground truth’ FOD data used for conducting evaluation are generated from the original multi-shell HCP dMRI data using multi-shell CSD6. 110 subjects from HCP dataset are randomly selected for conducting our experiments. Our dataset is split into 50 training 10 evaluation, and 10 validation. For assessment, we compared FODSRM predictions with the ground truth and with the single-shell LAR FOD images computed from the current state-of-the-art method (SS3T CSD). Furthermore, we generated connectomes using each method and compared the ground truth with FODSRM and with SS3T CSD.Results
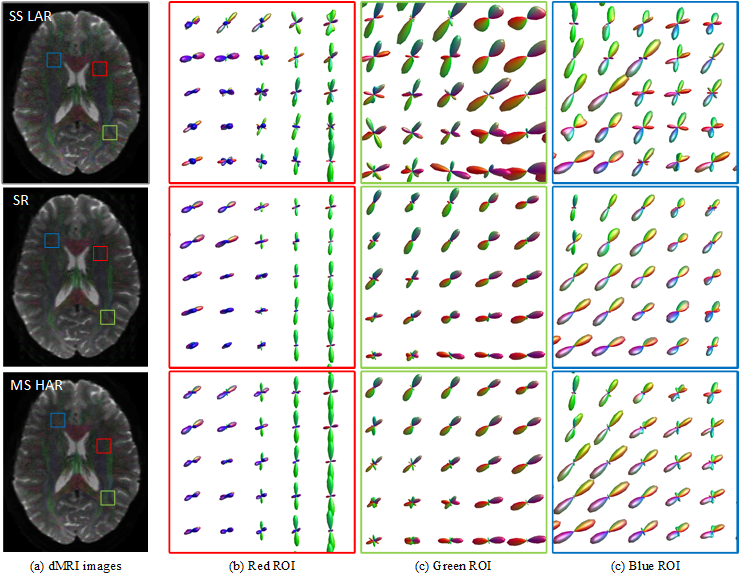
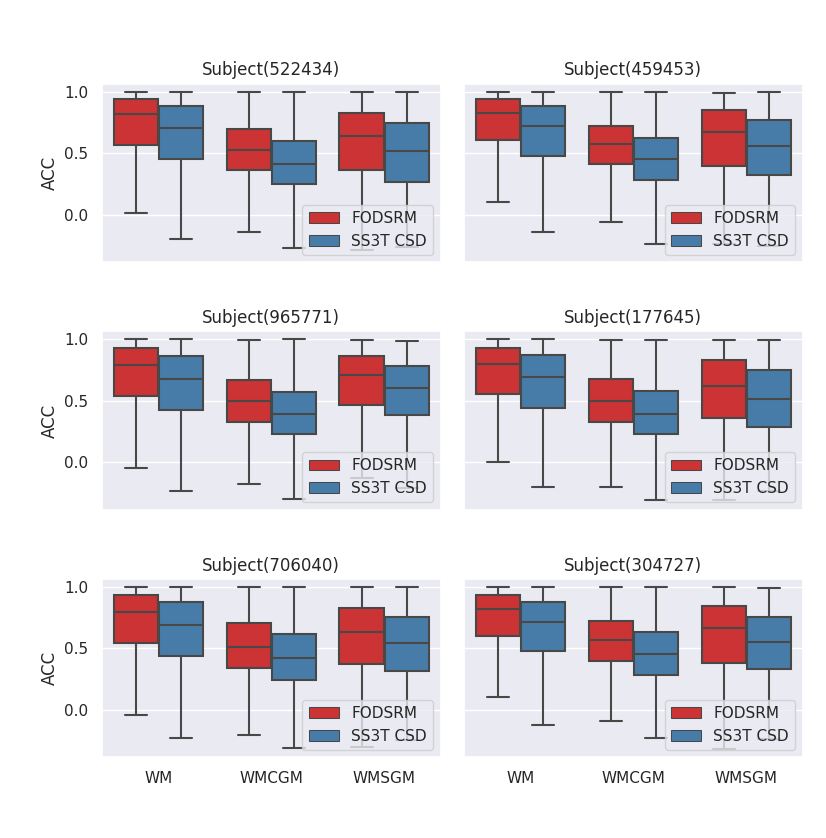
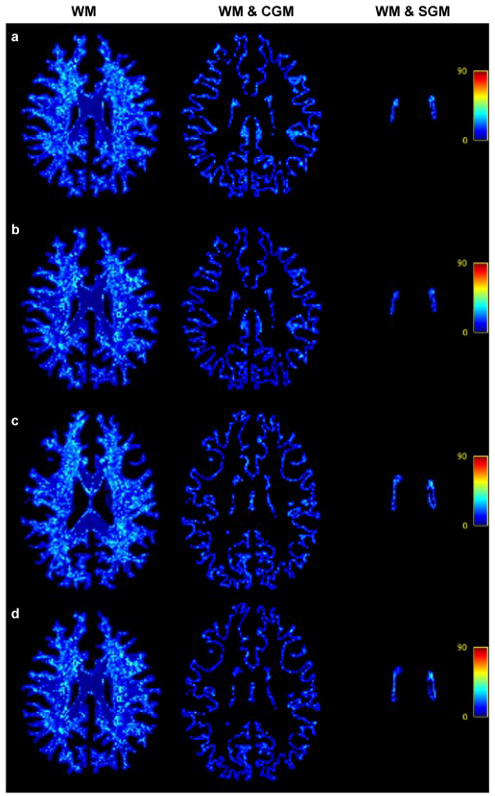
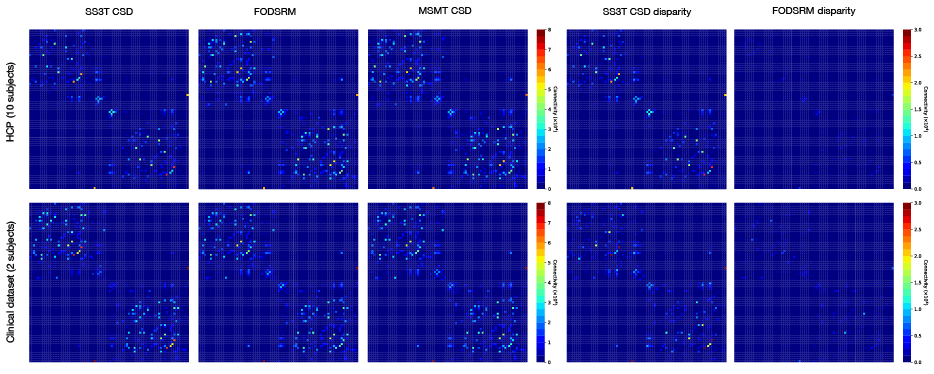
Figure 1 shows three anatomical regions, which are zoomed to reveal FODs. FODSRM was applied to single-shell low-angular-resolution FOD data of test subjects previously unseen by the network during training; the features of crossing, kissing, and fanning are clearly resolved by FODSRM, and the super-resolved FOD images have very good agreement with the ground truth FOD data. To quantitatively measure the improvement brought by FODSRM, we reported the angular correlation coefficients7 between the ground truth and the FOD estimates (see Figure 3) in three different types of tissues, such as white matter (WM), voxels of WM partial volumed with subcortical grey matter (SGM), and with cortical grey matter (CGM). One can clearly see that our method outperformed SS3T CSD. Furthermore, mean angular error (MAE), which is computed from the angular discrepancy between estimated and ground truth fixel8 (a fiber bundle instance extracted from a FOD), is used to evaluate our FOD estimates. Figure 4 demonstrates the MAE results in WM, WM&CGM, and WM&SGM, where we can see FODSRM outperformed SS3T CSD. Figure 5 shows the average connectomes (generated from SS3T CSD, FODSRM, and MSMT CSD respectively) across 10 subjects in HCP dataset and the difference between the ground truth with SS3T CSD and with FODSRM. We can observe that FODSRM yielded the most accurate connectome reconstructions, outperforming SS3T CSD by a large margin. To test the generalization ability, FDOSRM was applied to clinical diffusion MR images acquired by unseen (not present in the training phase) protocols using a different MRI scanner. From Figure 5, we can find that the improvement of connectome reconstruction obtained from super-resolved FOD images of LARDI data is very consistent with the HCP results.Discussion
The proposed deep-learning-based method, FODSRM, allows for the generation of super-resolved FOD images directly from conventional clinical-type single-shell LAR dMRI data, leading to comparable quality to those FODs produced from more advanced multi-shell HARDI data and superior results that current state-of-the-art deconvolution methods, Importantly, this is achieved with only a fraction of the data (e.g. as little as ~11% of the dMRI data for the HCP data used here). Furthermore, FODSRM achieves these FOD improvements without requiring high b-value data, which is most often not available in clinical protocols, but has been shown to be required for optimal performance when using current FOD algorithms (MSMT CSD).Acknowledgements
No acknowledgement found.References
1. Fornito, A., Zalesky, A. & Bullmore, E. Fundamentals of Brain Network Analysis. (Elsevier, 2016). doi:10.1016/C2012-0-06036-X
2. Khan, W. et al. Three-tissue compositional analysis reveals in-vivo microstructural heterogeneity of white matter hyperintensities following stroke. Neuroimage 218, 116869 (2020).
3. Smith, R. E., Tournier, J.-D., Calamante, F. & Connelly, A. SIFT2: Enabling dense quantitative assessment of brain white matter connectivity using streamlines tractography. Neuroimage 119, 338–351 (2015).
4. Smith, R. E., Tournier, J.-D., Calamante, F. & Connelly, A. Anatomically-constrained tractography: Improved diffusion MRI streamlines tractography through effective use of anatomical information. Neuroimage 62, 1924–1938 (2012).
5. Van Essen, D. C. et al. The WU-Minn Human Connectome Project: An overview. Neuroimage 80, 62–79 (2013).
6. Jeurissen, B., Tournier, J.-D. D., Dhollander, T., Connelly, A. & Sijbers, J. Multi-tissue constrained spherical deconvolution for improved analysis of multi-shell diffusion MRI data. Neuroimage 103, 411–426 (2014).
7. Anderson, A. W. Measurement of fiber orientation distributions using high angular resolution diffusion imaging. Magn. Reson. Med. 54, 1194–1206 (2005).
8. Raffelt, D. et al. Apparent Fibre Density: A novel measure for the analysis of diffusion-weighted magnetic resonance images. Neuroimage 59, 3976–3994 (2012).
Figures