1718
In Vivo Diffusion Tensor Distribution MRI of the Human Brain Using 300 mT/m Gradients1National Institute of Health, Bethesda, MD, United States, 2University of Helsinki, Helsinki, Finland, 3Massachusetts General Hospital and Harvard Medical School, Charlestown, MA, United States
Synopsis
Measuring and mapping the diffusion tensor distribution (DTD) via MRI holds the promise of revealing the tissue microstructure at sub-voxel resolution. In this study, we show the DTD results obtained on a human brain in-vivo using the new framework at MGH Connectome scanner with 300 mT/m gradients. The DTD within a voxel is assumed to be a normal tensor variate distribution constrained (CNTVD) within the manifold of 3 x 3 symmetric positive definite matrices. The estimated DTD is used to obtain a family of metrics which aim to disentangle size, shape and orientation heterogeneities present within a voxel.
Introduction
Measuring and mapping the diffusion tensor distribution (DTD) via MRI promises to reveal tissue microstructure at sub-voxel resolution [1]–[3]. The DTD within a voxel is assumed to be a constrained normal tensor variate distribution (CNTVD) within the manifold of 3 x 3 symmetric positive definite matrices [4]. The CNTVD has the maximum entropy among all probability densities supported by a constraint with given first and second moments, which makes it a natural choice for characterizing brain tissue microstructure where the ground truth DTD is so far unknown [4]. The estimated DTD yields a family of metrics which aim to disentangle size, shape and orientation heterogeneities present within a voxel. In this study, we show in vivo DTD results obtained on a human brain using this new framework on the MGH Connectome scanner using 300 mT/m gradients which allowed shorted echo time for a given b-value. The DTD analysis pipeline was tested using an isotropic polyvinylpyrrolidone (PVP) diffusion MRI phantom.Methods
Assuming Gaussian diffusion in microscopic water pools within a voxel, the signal model is given by [5],$$S(\mathbf{b}) = S_0 \int p(\mathbf{D}) e^{-\mathbf{b}.\mathbf{D}} d\mathbf{D} = S_0 \overline{e^{-\mathbf{b}.\mathbf{D}}}$$
Where overbar denotes averaging over the DTD, $$$p(\mathbf{D})$$$. This signal is approximated using the Monte-Carlo (MC) method by drawing samples from a CNTVD with given second order mean and fourth-order covariance tensors. This approximation is used to estimate the CNTVD moments by fitting the acquired data to a multitude of models in decreasing order of parsimony from DTI to DTD using a nonlinear least-squares (NNLS) routine [4]. Given the estimated mean and covariance tensor, we provide a new definition for microscopic fractional anisotropy (μFA) based on the non-commutativity of the FA operator,
$$\mu FA = \overline{FA(\mathbf{D})} \neq FA(\overline{\mathbf{D}})$$
From the microscopic diffusion tensors sampled from the CNVTD, we further identify the source of using size, shape and orientation heterogeneity metrics as shown below,
$$V_{size} = \sqrt{\frac{1}{9}\sum_{i=1}^3 \sum_{i=1}^3 \Omega_{ij}}, V_{shape} = \sqrt{\mathrm{Var}\left(\frac{\lambda_2}{\lambda_1}\right)+\mathrm{Var}\left(\frac{\lambda_3}{\lambda_2}\right)}, V_{orient} = \min_{i=1,2,3} \sqrt{\frac{\beta^i_2 + \beta^i_3}{2\beta^i_1}}$$
Where is the fourth order covariance tensor expressed in 6 x 6 matrix form, Var is the variance operator, $$$\lambda_1>\lambda_2>\lambda_3$$$ are the sorted eigenvalues of the micro-diffusion tensors and β are the eigenvalues of the average dyadic tensors formed among the microscopic diffusion tensors to overcome the sorting bias [6]. These metrics increase with the amount of heterogeneity within the voxel.
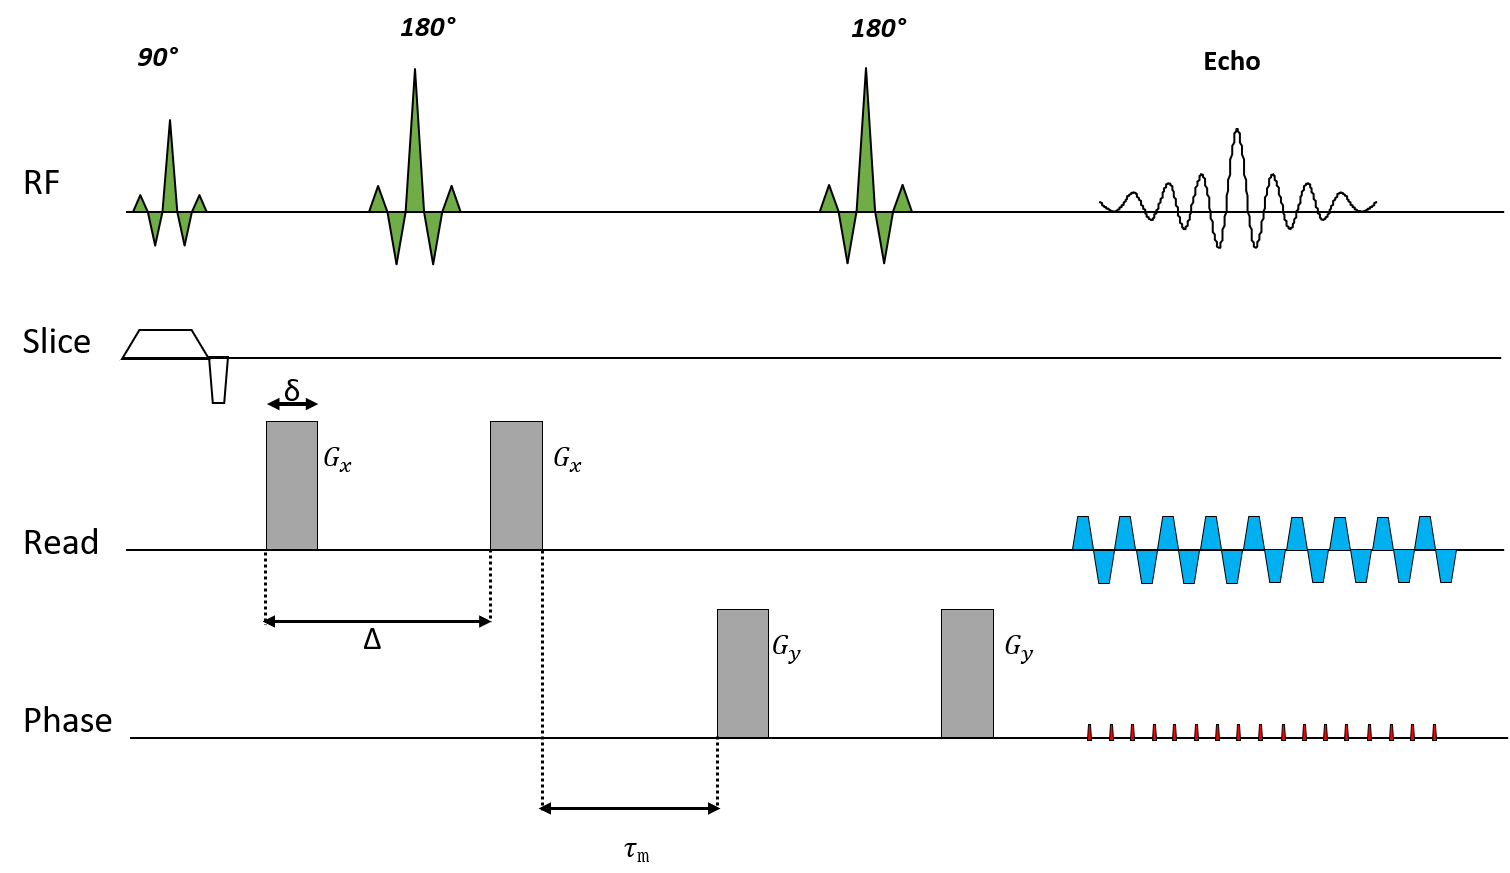
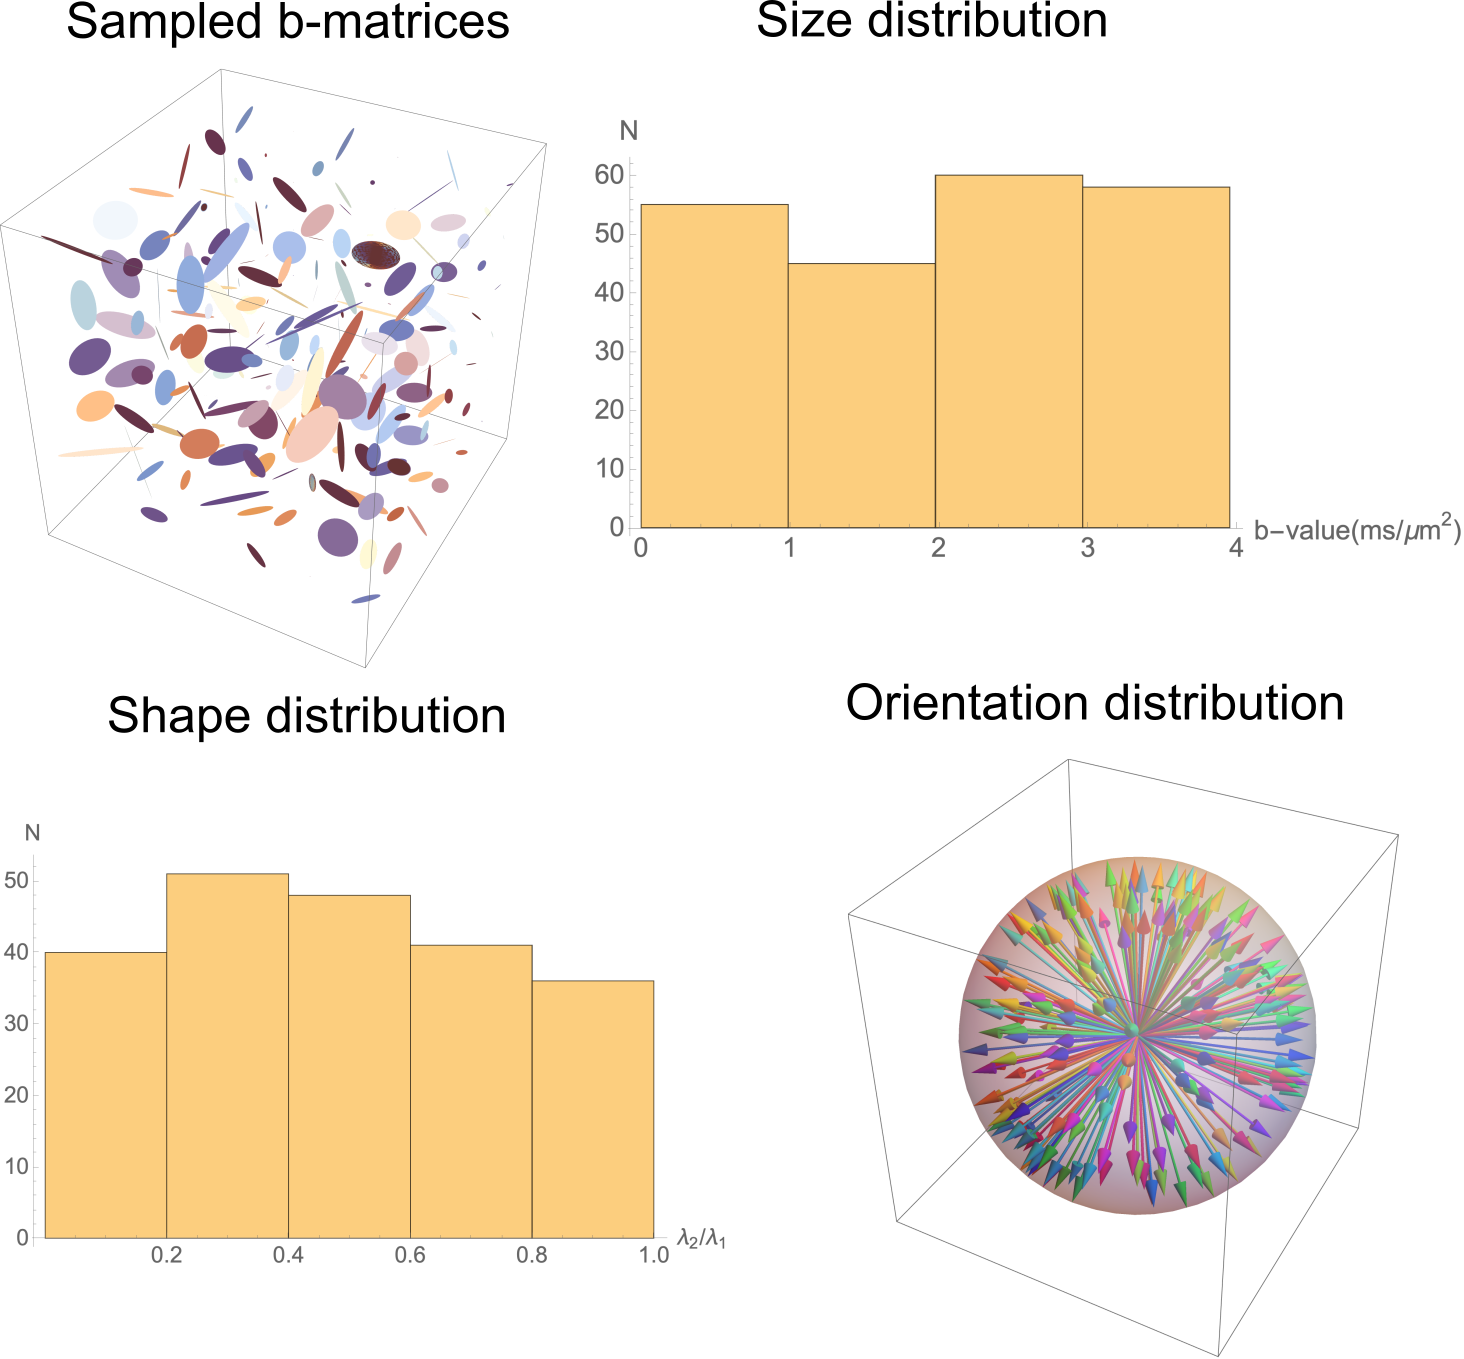
The diffusion measurements encoded with rank-1 and rank-2 b-matrices which are sufficient to estimate the first two CNTVD moments [4] were acquired using a standard double PFG pulse sequence with EPI readout (Figure 1). The two q-vectors in the diffusion block were randomly oriented and distributed uniformly over a unit sphere, and their amplitudes were randomly varied to obtain b-matrices with uniform size, shape and orientation distributions. Figure 2 shows the sampled b-matrices displayed as ellipsoids along with the histogram of b-values and ratios of their two non-zero eigenvalues.
MRI data was acquired on a 3T system (MAGNETOM Skyra CONNECTOM, Siemens Healthcare) capable of up to 300 mT/m gradient strength and 200 T/m/s slew rate. The pulse sequence was calibrated using a 40% PVP phantom [7] using the following parameters: δ = 10 ms, Δ = 18 ms, τm =5 ms, TR/TE = 12,000/100 ms with a 2 mm isotropic spatial resolution. A total of 216 MRIs were acquired with different b-tensor encodings as shown in Figure 2 yielding b-values ranging from 0 – 4,000 s/mm2. The b = 0 s/mm2 acquisition was repeated with reversed phase encoding to correct for susceptibility distortions. The data was also corrected for gradient nonlinearities and eddy current-induced distortions, and registered using standard methods. The DTD data was acquired in a healthy volunteer with identical diffusion-encoding gradient parameters and the following imaging parameters: FOV=200x200 mm, TR/TE=10,000/101 ms at 2 mm isotropic spatial resolution.
Results and Discussion
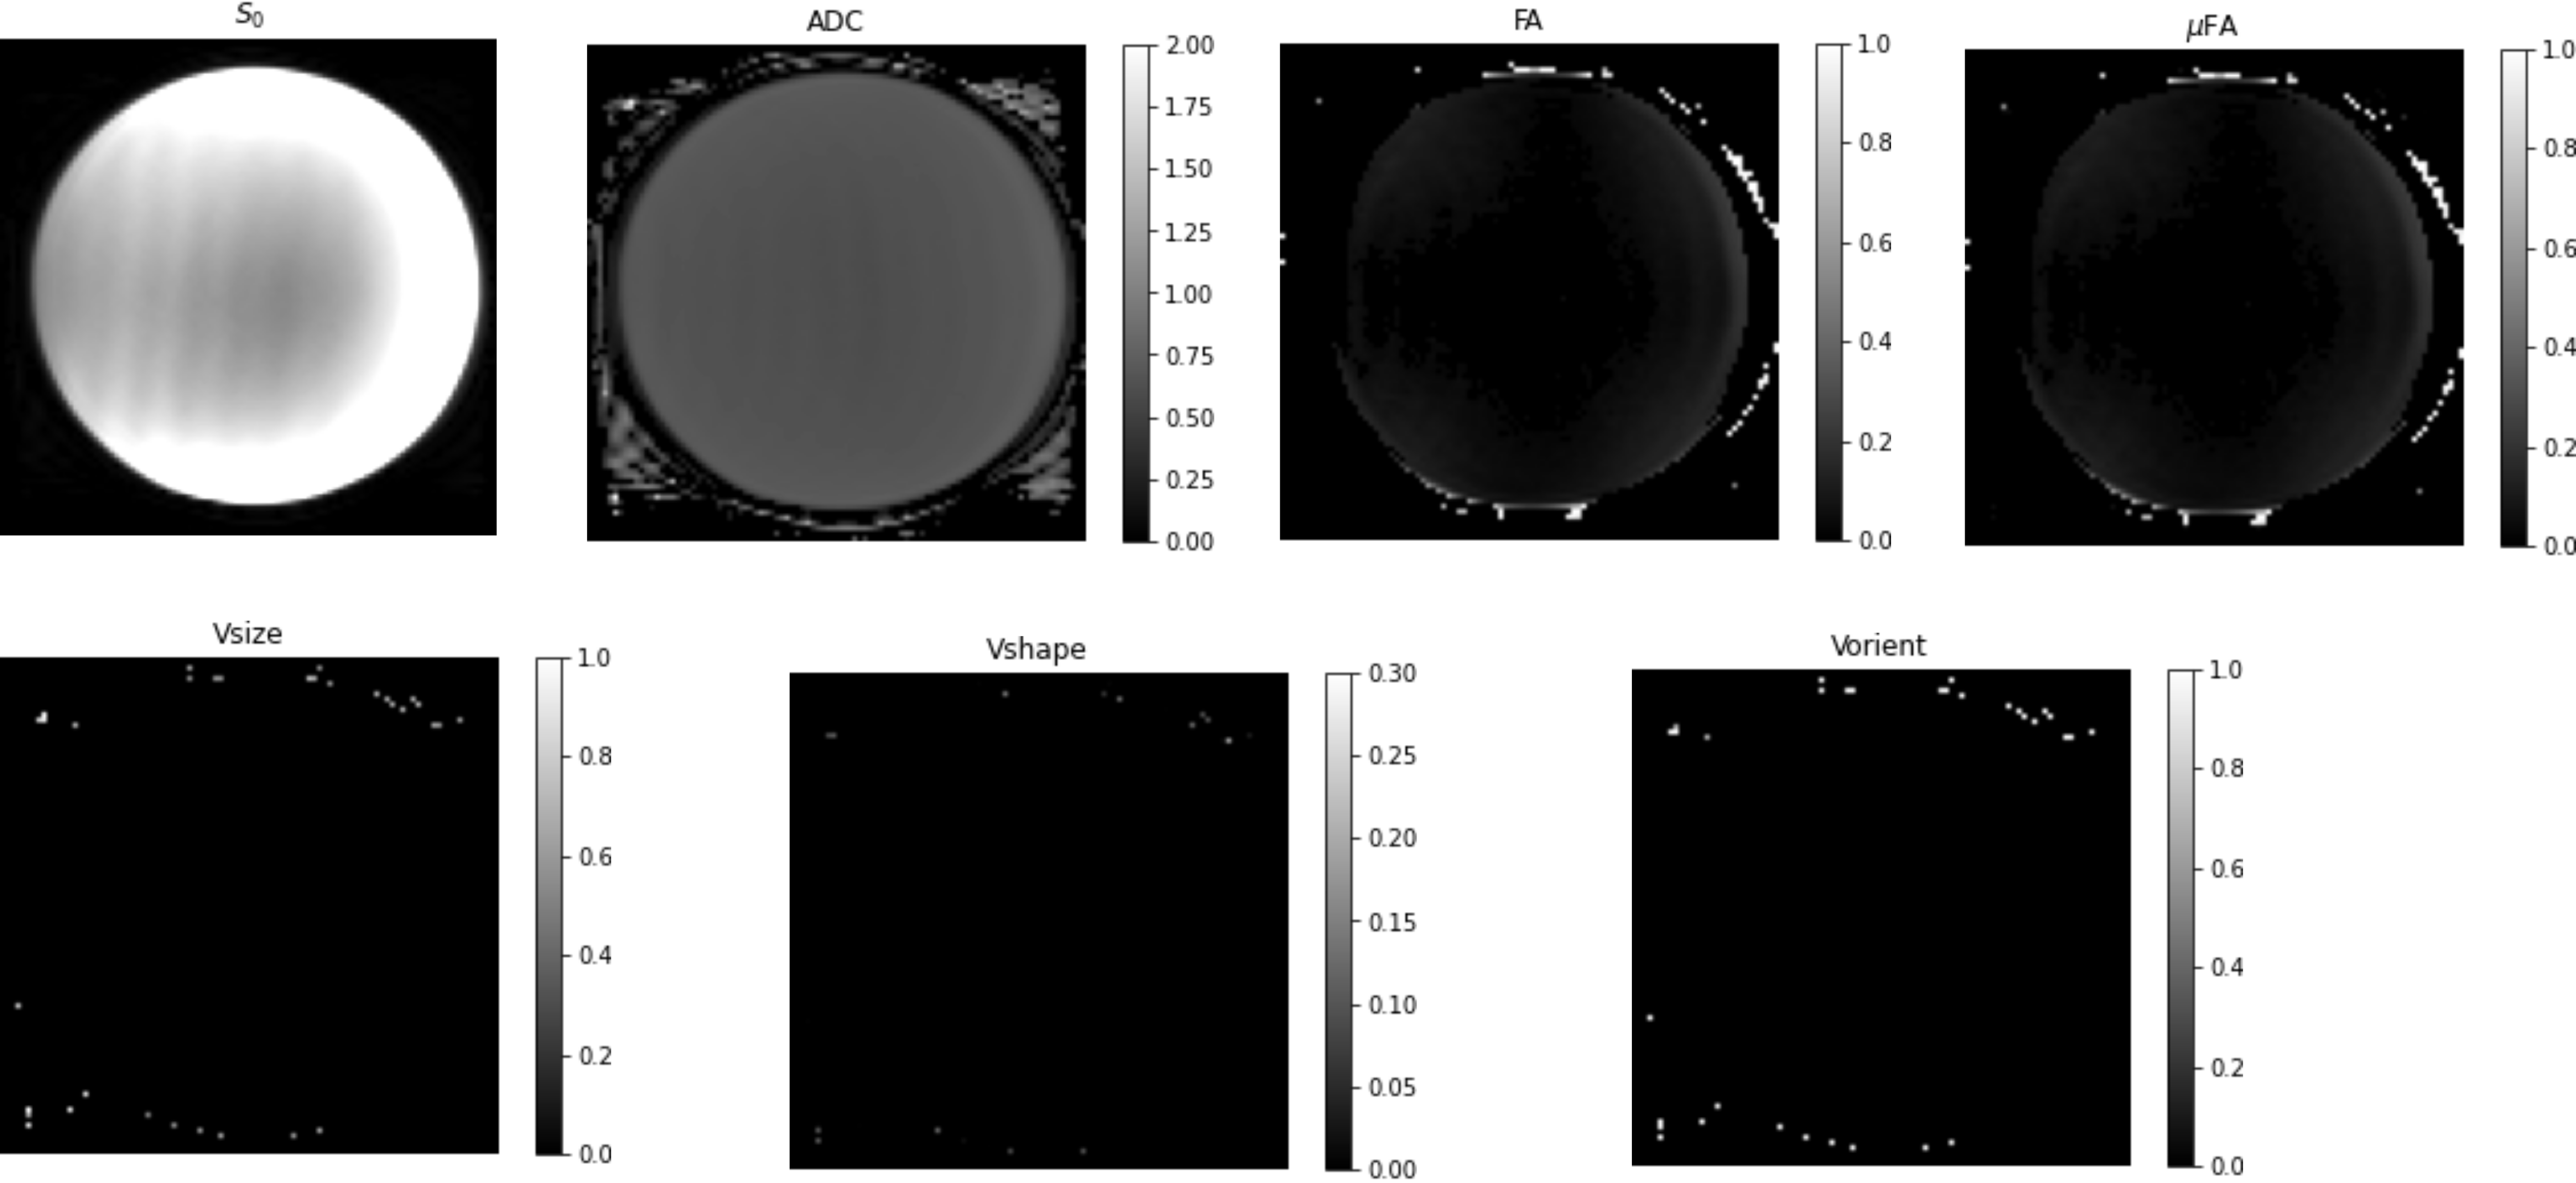
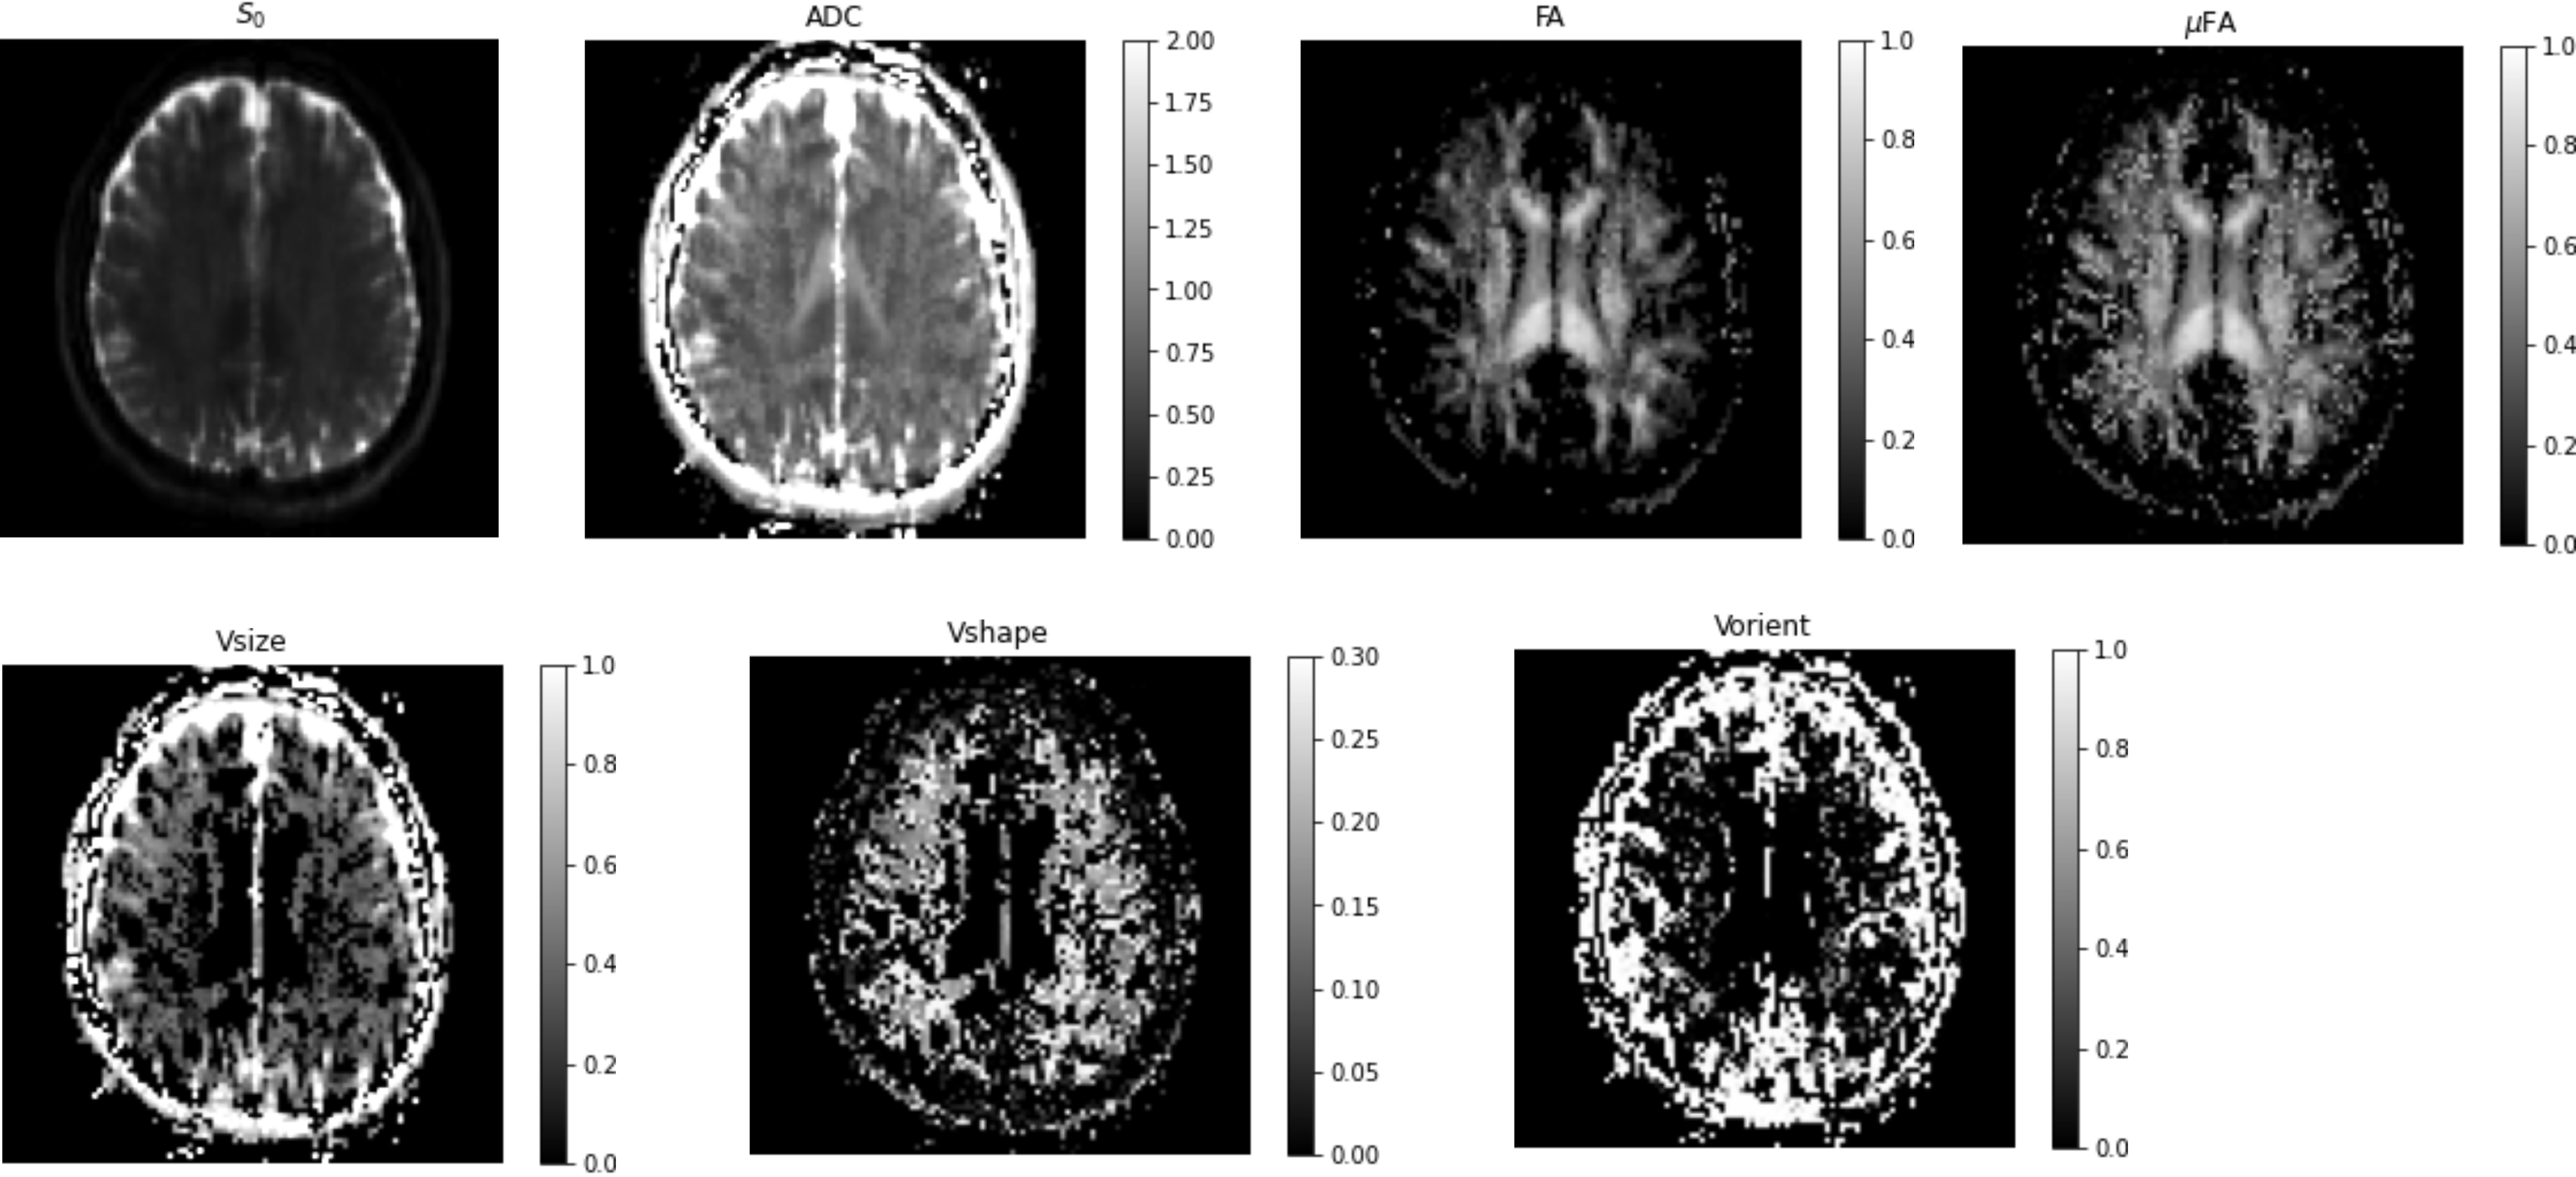
The results obtained from the diffusion phantom are shown in Figure 3. The average diffusivity measured was approximately 0.6 μm2/ms at 15°C consistent with published results [7]. The FA and μFA maps were close to zero, consistent with the DTD being a delta function, resulting in the DTI model. The heterogeneity metrics were close to zero as expected for this sample. The results from the human brain data are shown in Figure 4. The mean tensor was similar to DTI in brain tissue (i.e., uniform ADC throughout the parenchyma and elevated FA in white matter tracts). The μFA was elevated in the corona radiata due to increased shape heterogeneity in the region visible in shape heterogeneity map, likely due to splaying fibers which would result in a mixture of prolate and oblate microscopic diffusion tensors. The size heterogeneity was elevated at the CSF-parenchyma boundary due to the presence of highly diffusive CSF and slowly diffusing brain parenchyma. It was also elevated in the white matter albeit to a lesser degree, perhaps due to different sized fiber bundles traversing this region.Conclusion
A new experimental design and analysis technique is introduced to make an unbiased estimate of mean and covariance tensors of DTD. This method was able to capture heterogeneity present within normal brain tissue and represent a significant advance in the study of brain microstructure.Acknowledgements
This work was funded by the Intramural Research Program of the Eunice Kennedy Shriver National Institute of Child Health and Human Development, and with some support from the NIH BRAIN Initiative: “Connectome 2.0: Developing the next generation human MRI scanner for bridging studies of the micro-, meso- and macro-connectome”, 1U01EB026996-01.References
[1] D. Topgaard, “Diffusion tensor distribution imaging,” NMR Biomed., vol. 32, no. 5, p. e4066, May 2019, doi: 10.1002/nbm.4066.
[2] C.-F. Westin et al., “Q-space trajectory imaging for multidimensional diffusion MRI of the human brain,” Neuroimage, vol. 135, pp. 345–362, Jul. 2016, doi: 10.1016/J.NEUROIMAGE.2016.02.039.
[3] F. Szczepankiewicz et al., “Quantification of microscopic diffusion anisotropy disentangles effects of orientation dispersion from microstructure: Applications in healthy volunteers and in brain tumors,” Neuroimage, vol. 104, pp. 241–252, Jan. 2015, doi: 10.1016/j.neuroimage.2014.09.057.
[4] K. N. Magdoom, S. Pajevic, D. Gasbarra, and P. J. Basser, “A New Framework for MR Diffusion Tensor Distribution,” bioRxiv, p. 2020.05.01.071118, May 2020, doi: 10.1101/2020.05.01.071118.
[5] B. Jian, B. C. Vemuri, E. Ozarslan, P. R. Carney, and T. H. Mareci, “A novel tensor distribution model for the diffusion-weighted MR signal.,” Neuroimage, vol. 37, no. 1, pp. 164–76, Aug. 2007, doi: 10.1016/j.neuroimage.2007.03.074.
[6] P. J. Basser and S. Pajevic, “Statistical artifacts in diffusion tensor MRI (DT‐MRI) caused by background noise,” Magn. Reson. Med., vol. 44, no. 1, pp. 41–50, Jul. 2000, doi: 10.1002/1522-2594(200007)44:1<41::AID-MRM8>3.0.CO;2-O.
[7] C. Pierpaoli, J. Sarlls, U. Nevo, P. J. Basser, and F. Horkay, “Polyvinylpyrrolidone (PVP) water solutions as isotropic phantoms for diffusion MRI studies,” in International Society for Magnetic Resonance in Medicine, 2009, p. 1414, Accessed: Dec. 12, 2018. [Online]. Available: https://cds.ismrm.org/protected/09MProceedings/files/01414.pdf.
Figures