1717
Resolution and b Value Dependent Structural Connectome for Ex Vivo Mouse Brain1Duke University, Durham, NC, United States, 2Radiology and Imaging Sciences, Indiana University, Indianapolis, IN, United States
Synopsis
Tractography and structural connectome have been widely used in preclinical studies in recent years. However, assessment of the experimental parameters for the final outputs of diffusion MRI is still lack. In this study, we acquired an ex vivo mouse brain high spatial (50 µm isotropic) and angular resolution (384 diffusion encoding directions) diffusion MRI dataset in a preclinical 9.4T system. We analyzed the tractography and connectome under different experimental conditions, including b value, spatial resolution, and angular resolution.
Purpose
To evaluate the experimental effects for diffusion tractography and structural connectome in mouse brain.Introduction
Diffusion MRI (dMRI) provides a number of different ways to characterize brain microstructures and structural connectome1,2. The mouse brain is particularly interesting target since there are various genetic models in which dMRI might provide insight to the structural connectivity variants under different brain diseases3,4. The mouse brain is about 3000 times smaller than human brain, which requires high resolution to reduce the partial volume effect for connectivity analysis5. The angular resolution and b value are found to be crucial to resolve the crossing fibers and accurately tract the white matter bundles. Multi-shell (different b values) diffusion MRI datasets with high spatial and angular resolution can afford as a foundation to understand these effects for tractography and structural connectome.Methods
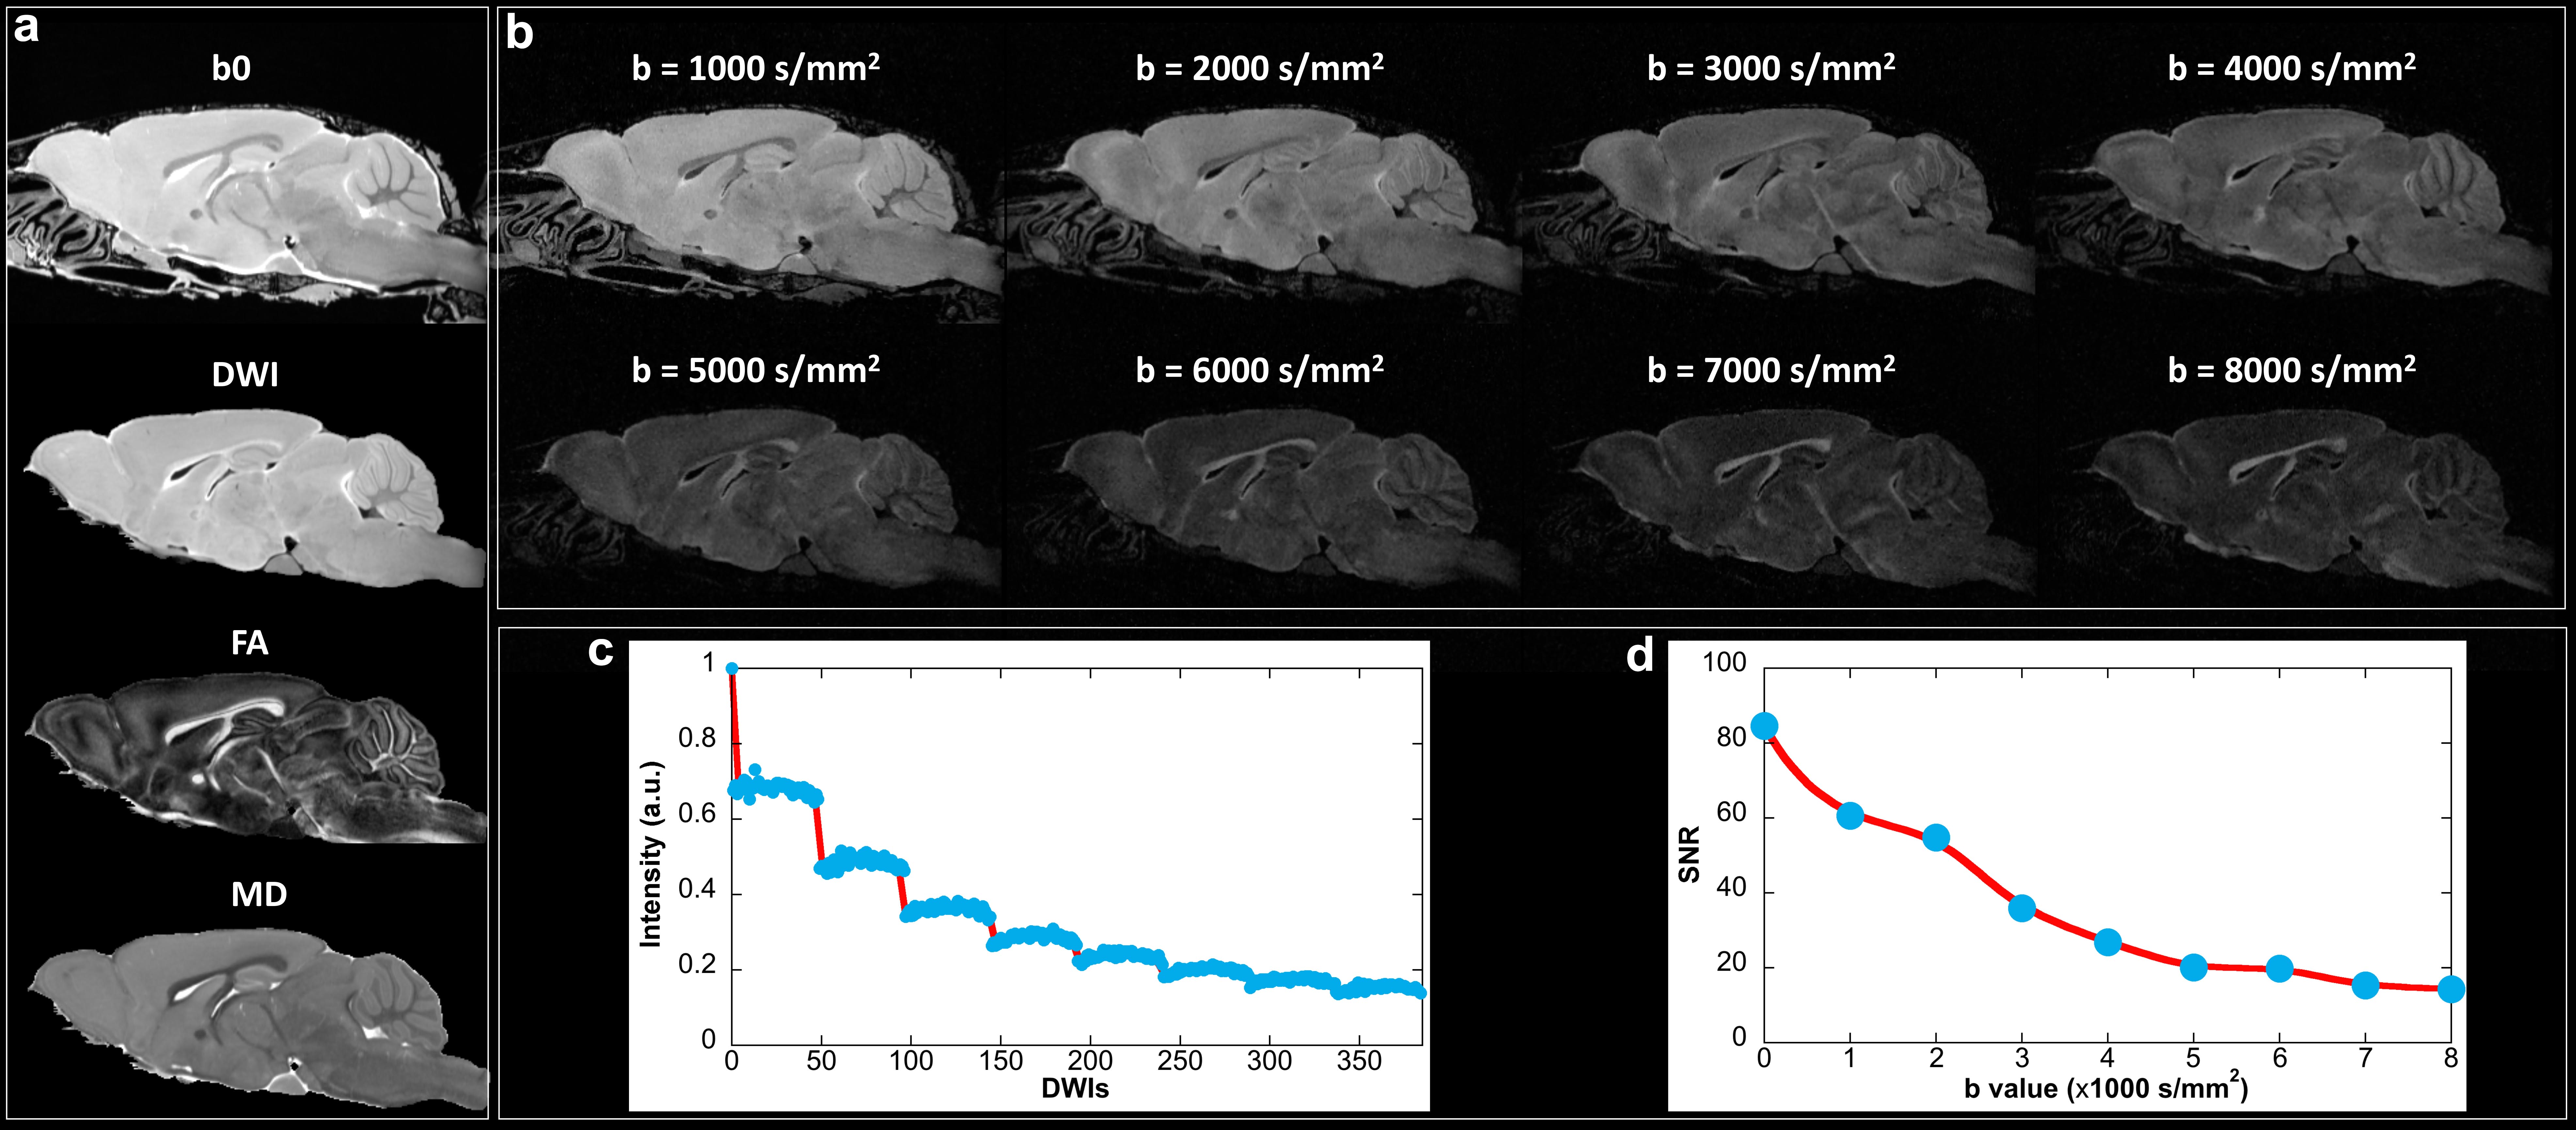
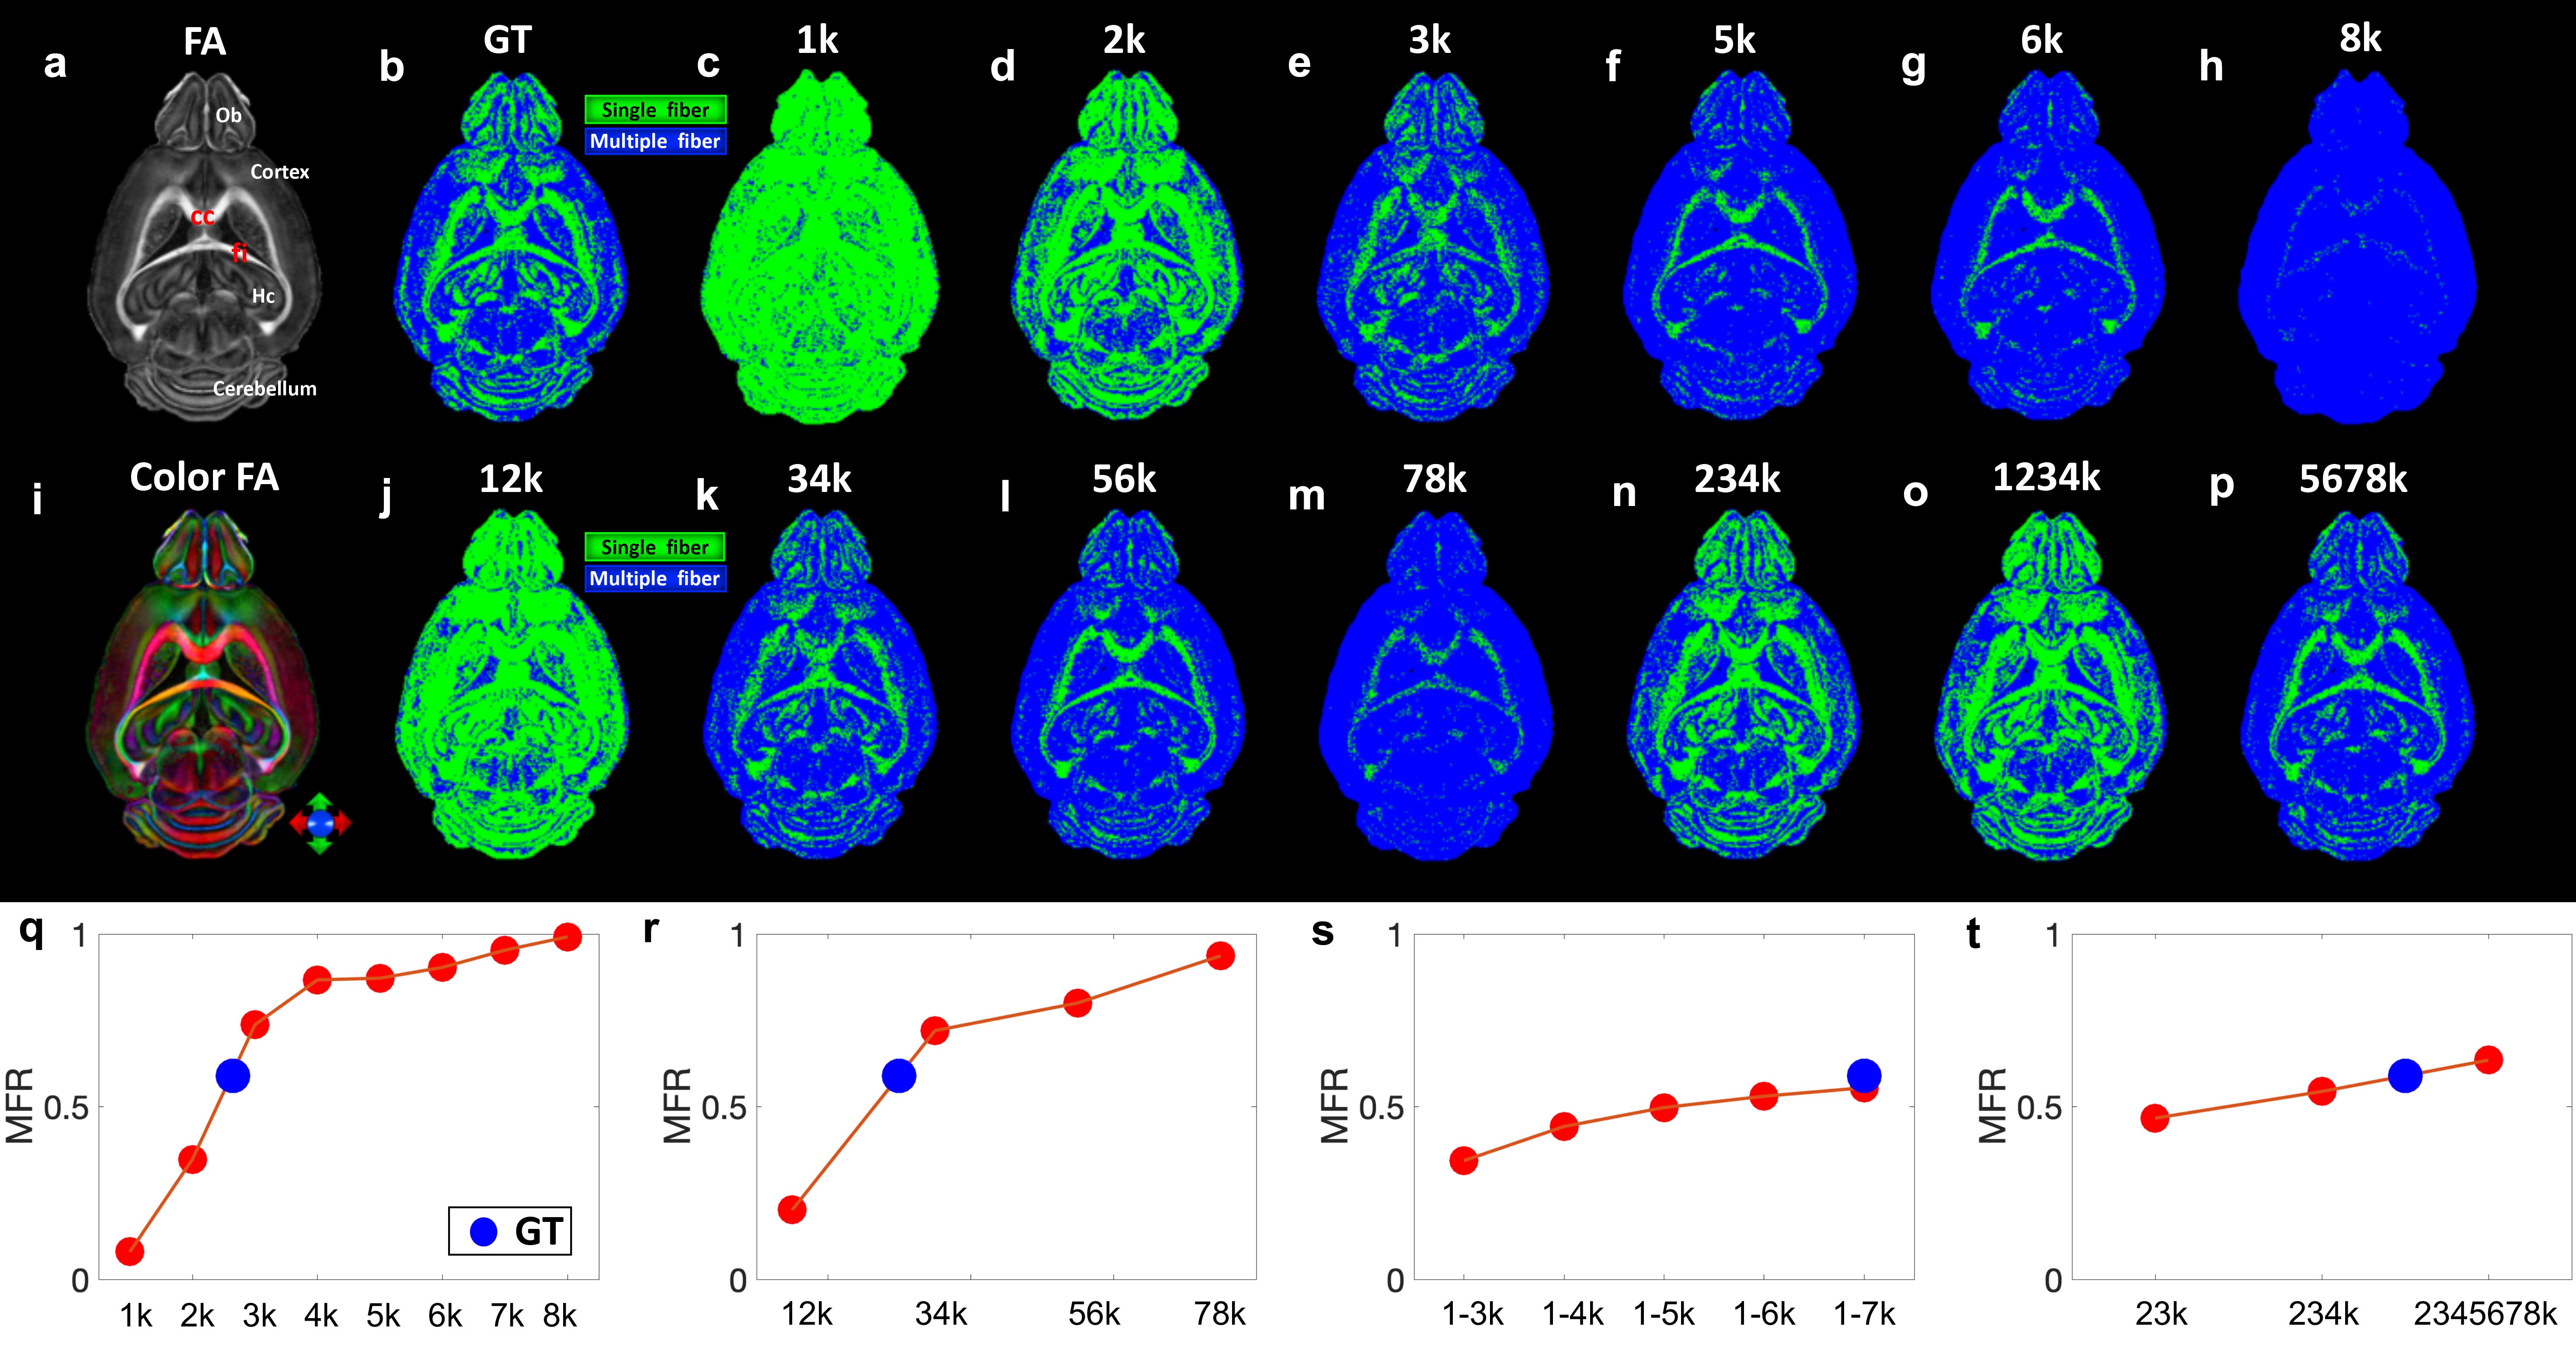
Animal experiments were carried out in compliance with the Duke University Institutional Animal Care and Use Committee. Animals were sacrificed and perfusion fixed with a 1:10 mixture of ProHance-buffered formalin. MR images were acquired on a 9.4T Oxford 8.9-cm vertical bore magnet (Oxford Instruments, Abingdon, United Kingdom) with an Agilent VnmrJ 4.0 imaging console. We used a three-dimensional (3D) diffusion-weighted spin-echo pulse sequence with that was modified to support k-space undersampling and varying b values with different diffusion gradient directions. A 3D CS strategy fully sampled the readout dimension and under sampled the two-phase encoding dimensions using a sparsifying approach, which has been described in detail previously4. An acceleration factor of 5.12 were used in this study with multiple shells (b value = 1000, 2000, 3000, 4000, 5000, 6000, 7000, 8000 s/mm2) acquisition at 50 μm isotropic resolution, 48 directions DWIs and 4 b0 images in each shell, and one repetition. The total scan time was 148 hours (0.36 hours/volume). This dataset was further subsampled by different b values to assess the performance of crossing fibers, tractography, and structural connectome. Reconstruction of the under sampled k-space data has been described in previous studies. All the DWIs were registered to the baseline image (b0) to correct the eddy currents. Generalized Q-sampling imaging (GQI) is a model-free reconstruction method that quantifies the density of diffusion water at different orientations6.Results
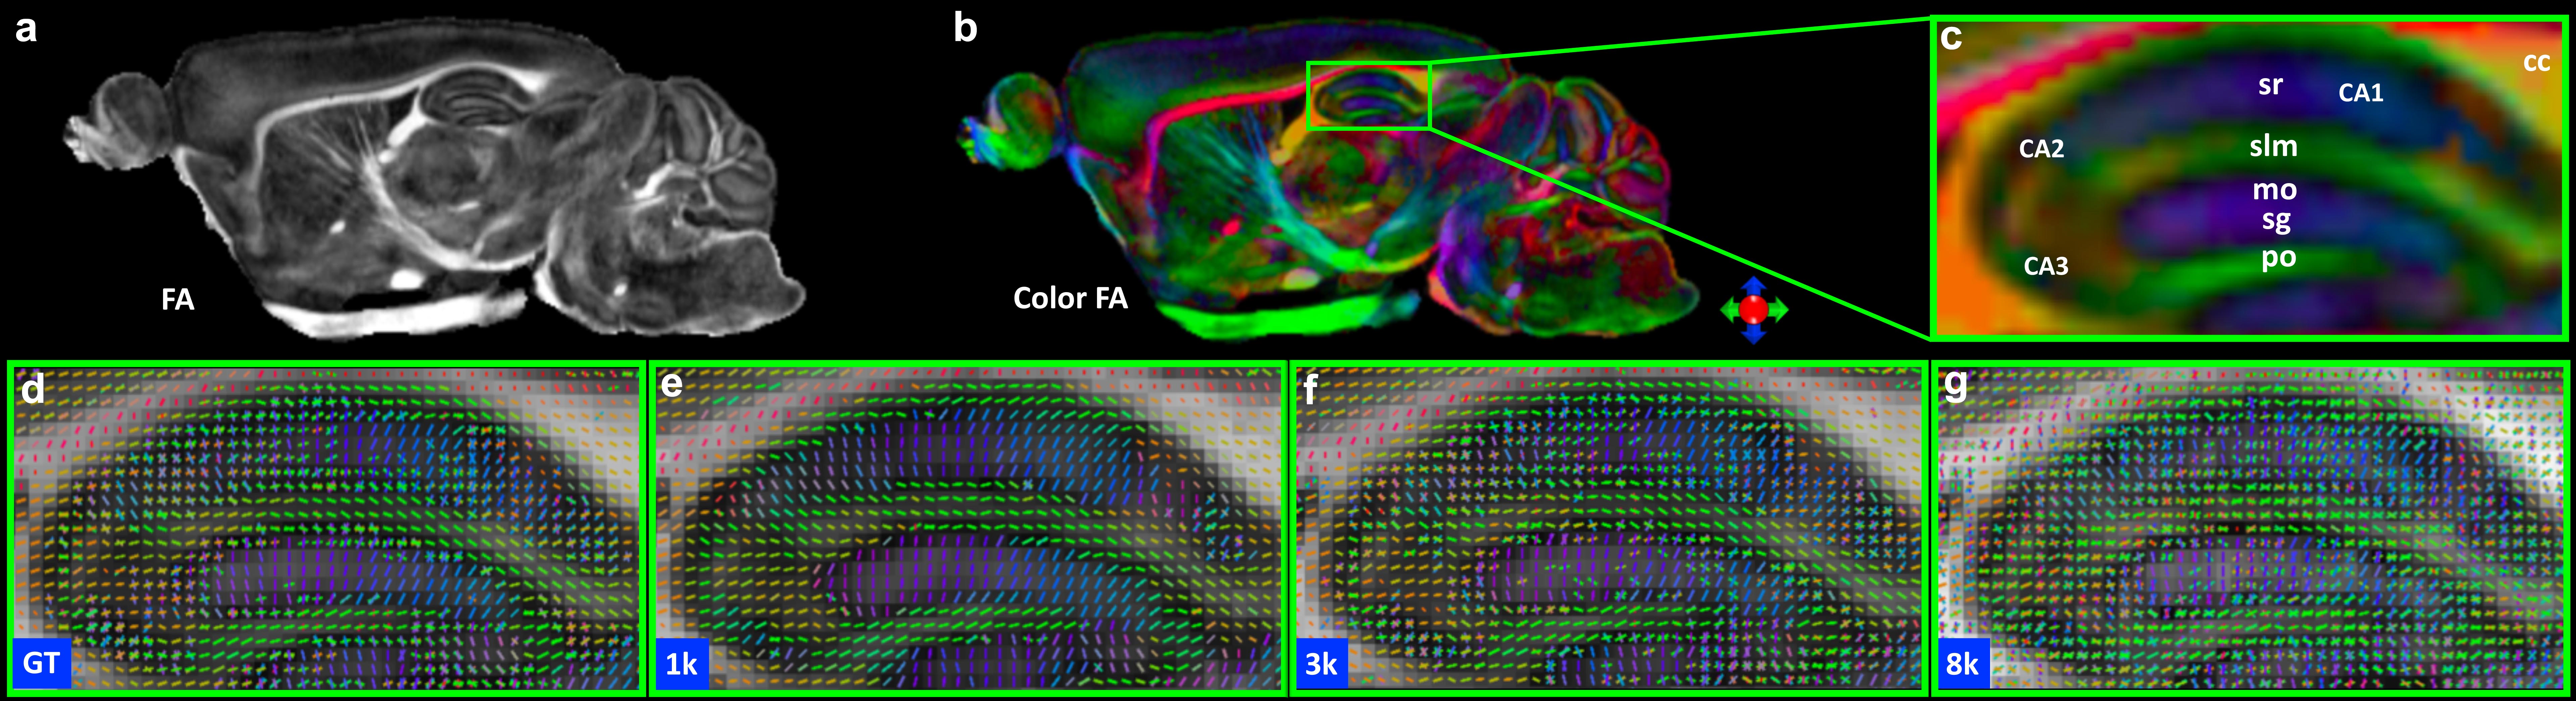
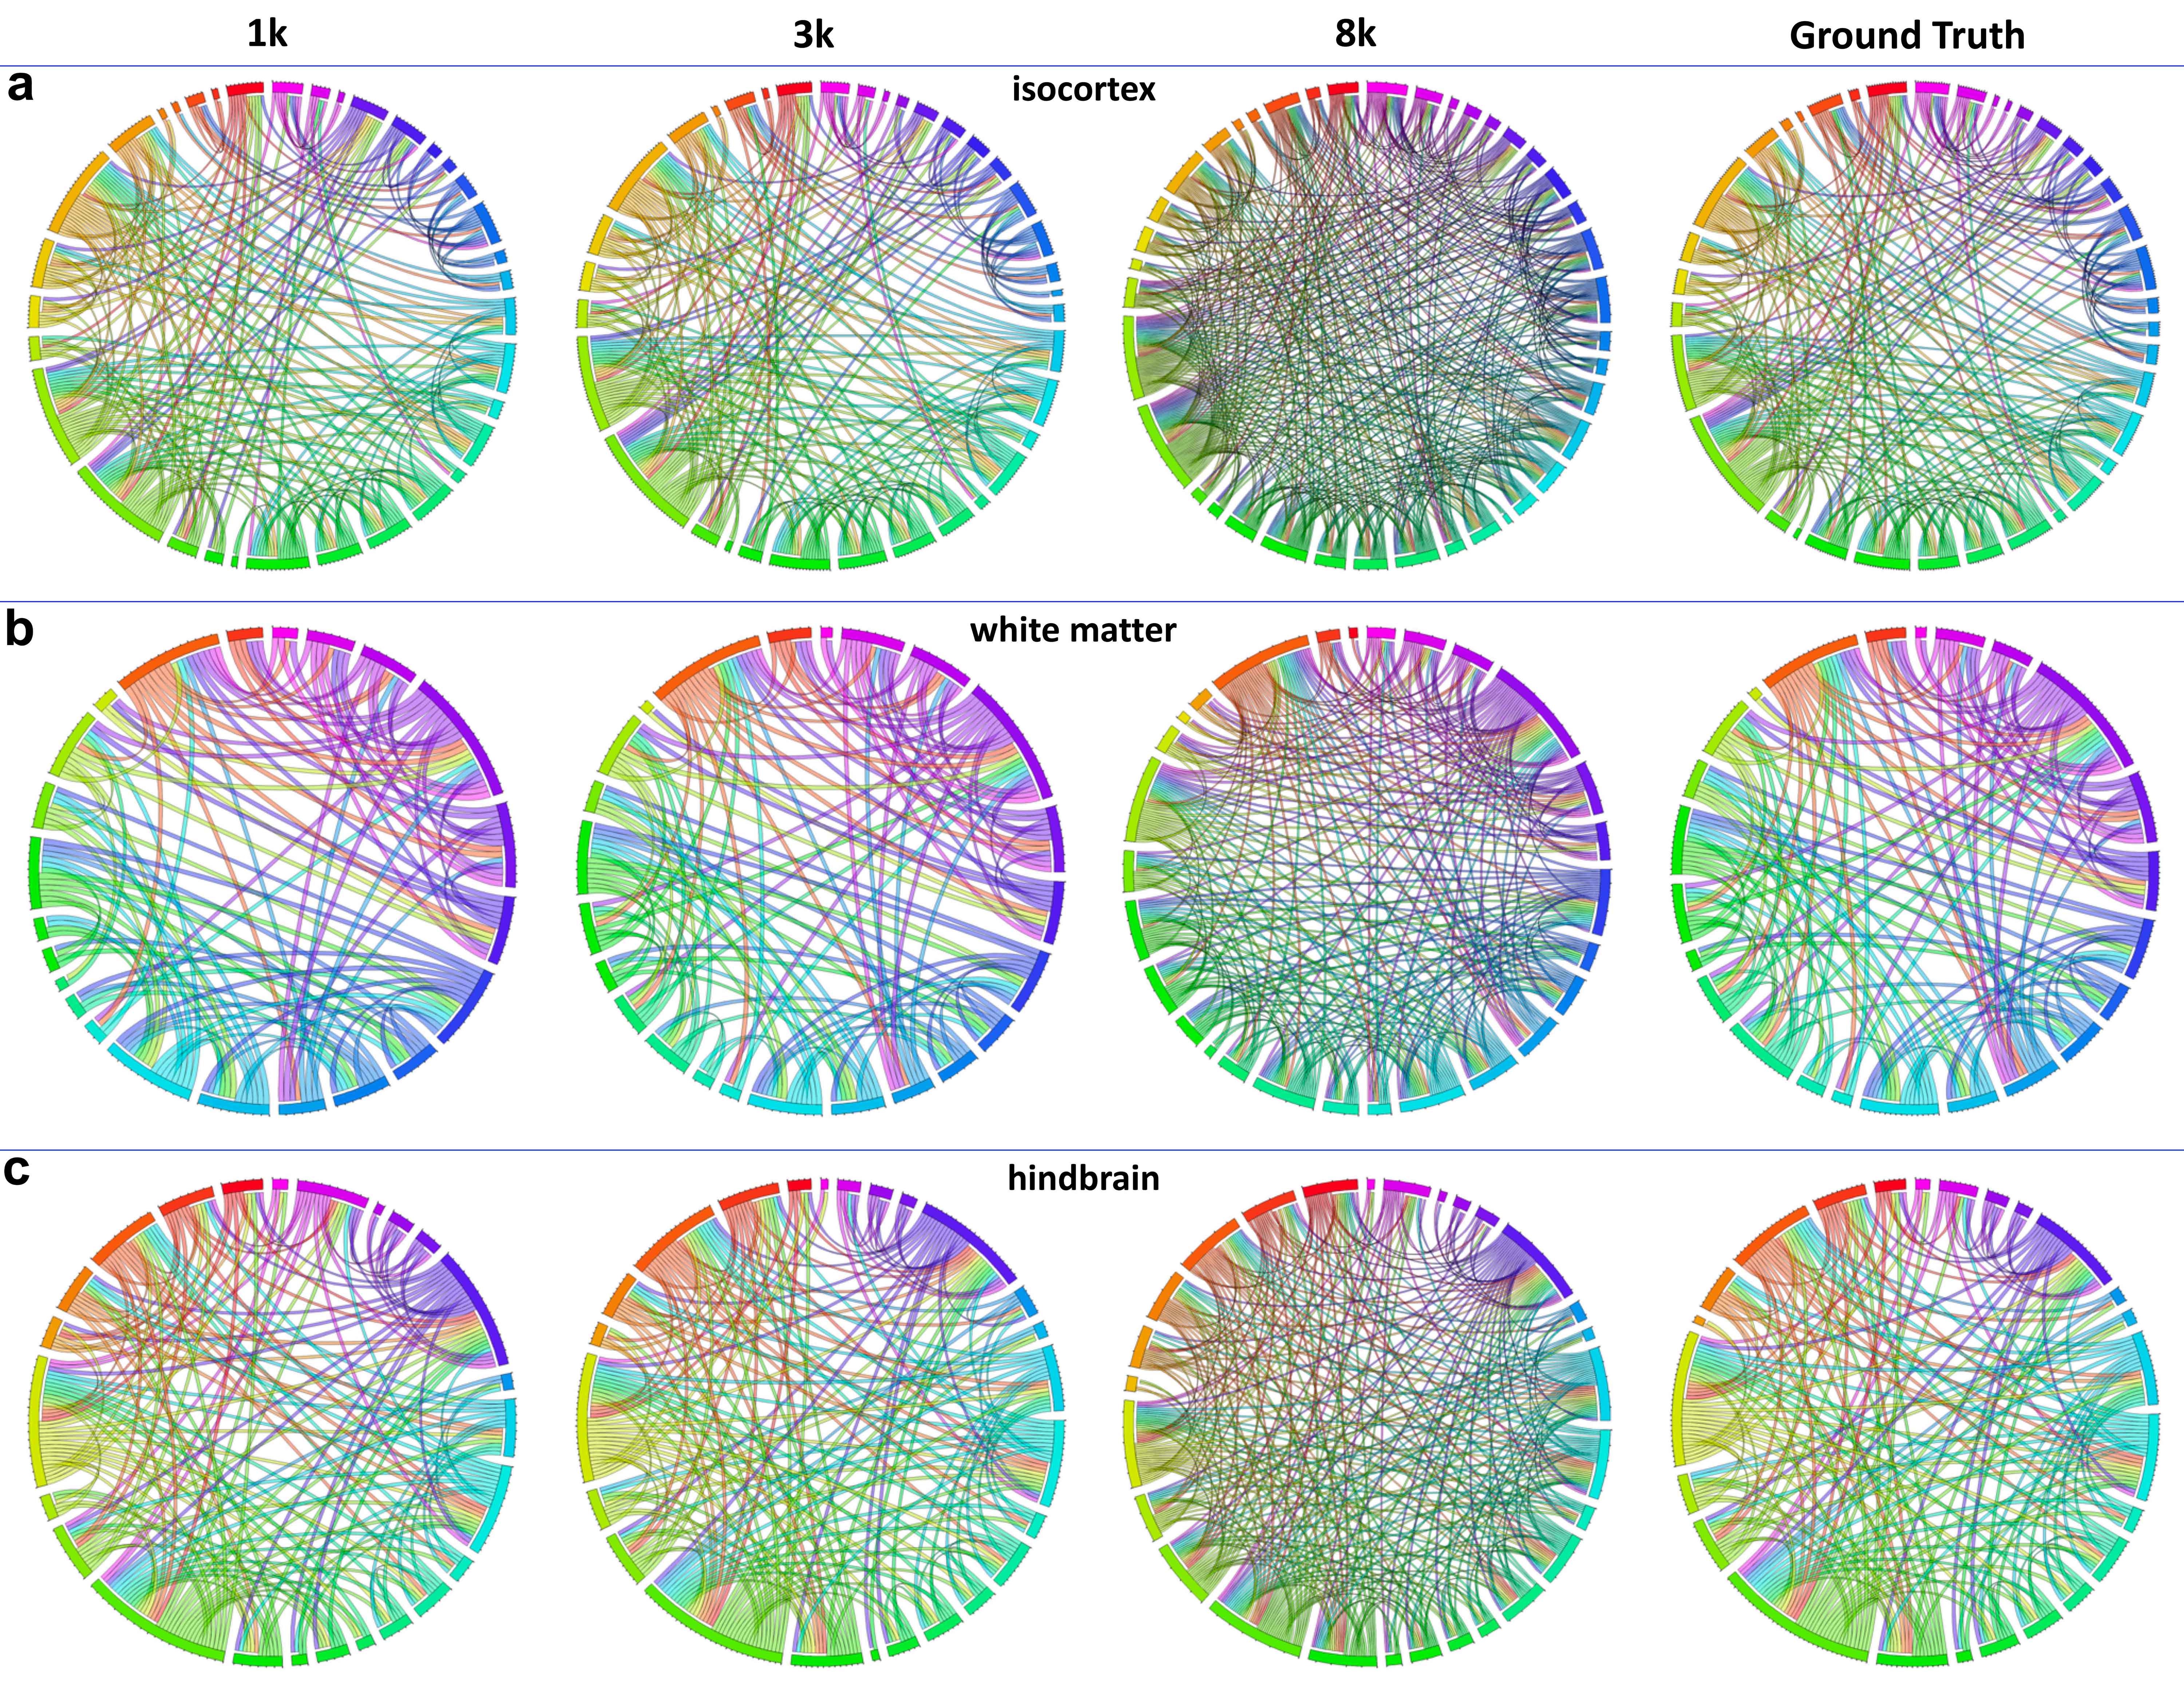
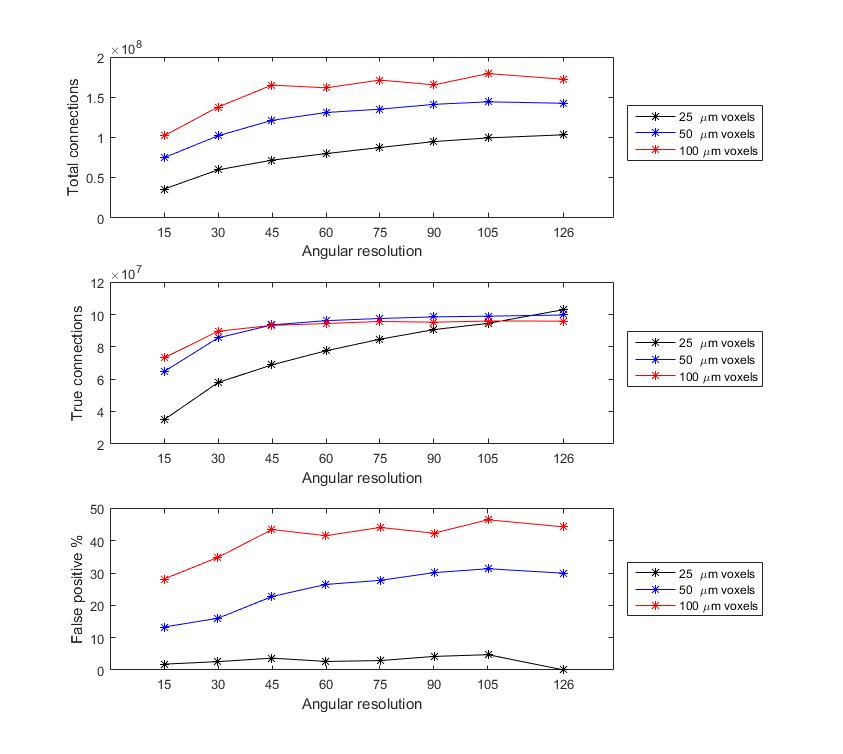
Figure 1 shows the representative b0 (a), averaged diffusion weighted images (DWI), FA, MD. The DWI, the signal intensity, and signal-to-noise ratio (SNR) at different b values (b-d). The signal intensity and b value gradually decreased with higher b value. Figure 2 illustrated the crossing fibers resolved at different combination of b values, where there are few crossing fibers can be resolved at b value of 1000 s/mm2. The multiple-fiber ratio (MFR) gradually increases with b value and becomes more stable with more shells/higher angular resolution. The MFR at b value of 2000 and 3000 s/mm2 (t) is comparable to the result obtained from the GT (ground truth, with all b values included). There are more false-positive fibers were resolved in the hippocampus regions at higher b value (Figure 3g) and the mediate b value of 3000 s/mm2 shows comparable results to the GT. Figure 4 shows the connectivity maps in isocortex, white matter, and hindbrain regions, where high b value (8000 s/mm2) results in more false-positive connections and low b value (1000 s/mm2) results in more false-negative connections. Figure 5 demonstrated that the importance of the angular resolution, where the false-negative connections are dramatically reduced with higher angular resolution.Discussion and Conclusion
This study demonstrates that the tractography and structural connectivity are strongly dependent on the acquisition parameters, including b value and angular resolution. Compared to the in vivo studies, the diffusivity is largely reduced in the fixed brain, a medicate b value (~ 3000 s/mm2) is appropriate for diffusion tractography and connectivity analysis. The mouse brain connectome is also affected by the angular resolution, which calls attention to interpret the outcomes for diffusion MRI.Acknowledgements
This work was supported by NIH/NIBIB P41 EB015897, NIH/NINDS 1R01NS096720-01A1, and Charles E. Putman MD Vision Award of the Department of Radiology, Duke University School of Medicine.References
1. Aggarwal M, Jones MV, Calabresi PA, Mori S, Zhang JY (2012) Probing mouse brain microstructure using oscillating gradient diffusion MRI. Magnetic Resonance in Medicine 67 (1):98-109.
2. Calabrese E, Badea A, Cofer G, Qi Y, Johnson GA (2015) A Diffusion MRI Tractography Connectome of the Mouse Brain and Comparison with Neuronal Tracer Data. Cereb Cortex 25 (11):4628-4637.
3. Johnson GA, Calabrese E, Badea A, Paxinos G, Watson C (2012) A multidimensional magnetic resonance histology atlas of the Wistar rat brain. Neuroimage 62 (3):1848-1856.
4. Wang N, Anderson RJ, Badea A, Cofer G, Dibb R, Qi Y, Johnson GA (2018) Whole mouse brain structural connectomics using magnetic resonance histology. Brain Struct Funct 223 (9):4323-4335.
5. Wang N, Zhang J, Cofer G, Qi Y, Robert A, White L, Johnson GA (2019) Whole mouse brain structural connectomics using magnetic resonance histology. Brain Struct Funct 224 (5):1797-1813.
6. Yeh FC, Wedeen VJ, Tseng WY. Generalized q-sampling imaging. IEEE Trans Med Imaging 2010;29(9):1626-1635.
Figures