1716
Internal gradient distribution tensors of white matter tracts models1Centro Atómico Bariloche, CONICET, CNEA, 8400, San Carlos de Bariloche, Argentina, 2Instituto Balseiro, CNEA, Universidad Nacional de Cuyo, 8400, San Carlos de Bariloche, Argentina, 3Instituto de Nanociencia y Nanotecnología, CONICET, CNEA, San Carlos de Bariloche, Argentina
Synopsis
Detecting non-invasively tissue-microstructural changes associated with pathologies constitutes a promising diagnosis paradigm. Susceptibility-induced magnetic field gradients constitute a way to obtain microstructural information which is expected to complement Diffusion Weighted Imaging (DWI) methods, since these methods arise from distinct physical phenomena. We performed simulations that show the potential of extracting quantitative tissue-microstructure information of axons in the white matter based on internal-gradient-distribution tensors. We show promising results that can allow detecting alterations in axon diameters, axon density and demyelination using internal gradient distributions as a diagnostic tool.
Introduction
Obtaining morphological information of deep-tissue microstructure beyond the current MRI voxel-averaged values will considerably enhance the current diagnostics capability of non-invasive imaging. Promising methods that can be exploited to extract microstructure information of the brain White Matter (WM) and Gray Matter (GM) are those based on magnetic susceptibility variations (Δχ). The main source of susceptibility change with respect to water is the iron content and the lipids in the myelin sheath 1,2. The interaction between the main magnetic field and Δχ produces internal magnetic gradients (IG) which directly reflects the nature of the microstructure arrangement 3,7. We consider MRI sequences and strategies that have been proposed to measure these internal gradients without the need of rotating the sample 3,4. These IG’s provide complementary information about the intravoxel microstructure, specially in scenarios where DWI effects are tenuous. The method measures susceptibility-induced IG distributions along several directions to deliver morphologies of anisotropic structures 4. An internal gradient distribution tensor (IGDT) that defines the IG distribution components along different spatial axes is measured. We show with numerical models how quantitative information of the underlying microstructure of axon bundles present in WM and GM can be extracted by the IGDT.Methods
Axon distributions.Parallel axon bundles are simulated in a 2D matrix with the AxonPacking open-source software ⁵. The axon diameters follow a Log-Normal distribution. The diameters ratios $$$d_{unmyelinated}/d_{myelinated}$$$ (g-ratio) are set following the relation $$$0.220∗log(d_{unmyelinated}) + 0.508$$$ 6. Different axon distributions are simulated varying the minimum axon separation, mean axon diameter, g-ratio and axon volumetric fraction (AVF).
Internal gradient simulations.
The susceptibility-induced internal gradients are calculated using the Finite Perturber Method (FPM) 3,7. The structures are represented by punctual “perturbers” on the myelin sheath defined by a Δχ perturbation over the water magnetic susceptibility within intra and extra axonal space. The total magnetic field shift ΔB at a given point is determined by the superposition of the magnetic field shifts induced by each perturber. The internal gradient G0 is then calculated. A histogram of the gradient G0 is made and its gradient distribution width ΔG0 is determined from its standard deviation.Figure 1a shows a matrix representation of an axon bundle where the myelin sheath susceptibility is represented with ones (white) and the intra and extra axonal space represents the water susceptibility encoded with zeros (black). The internal gradient G0 vector component along the x axis is shown in Fig. 1b and its strength distribution in Fig. 1c.
Results
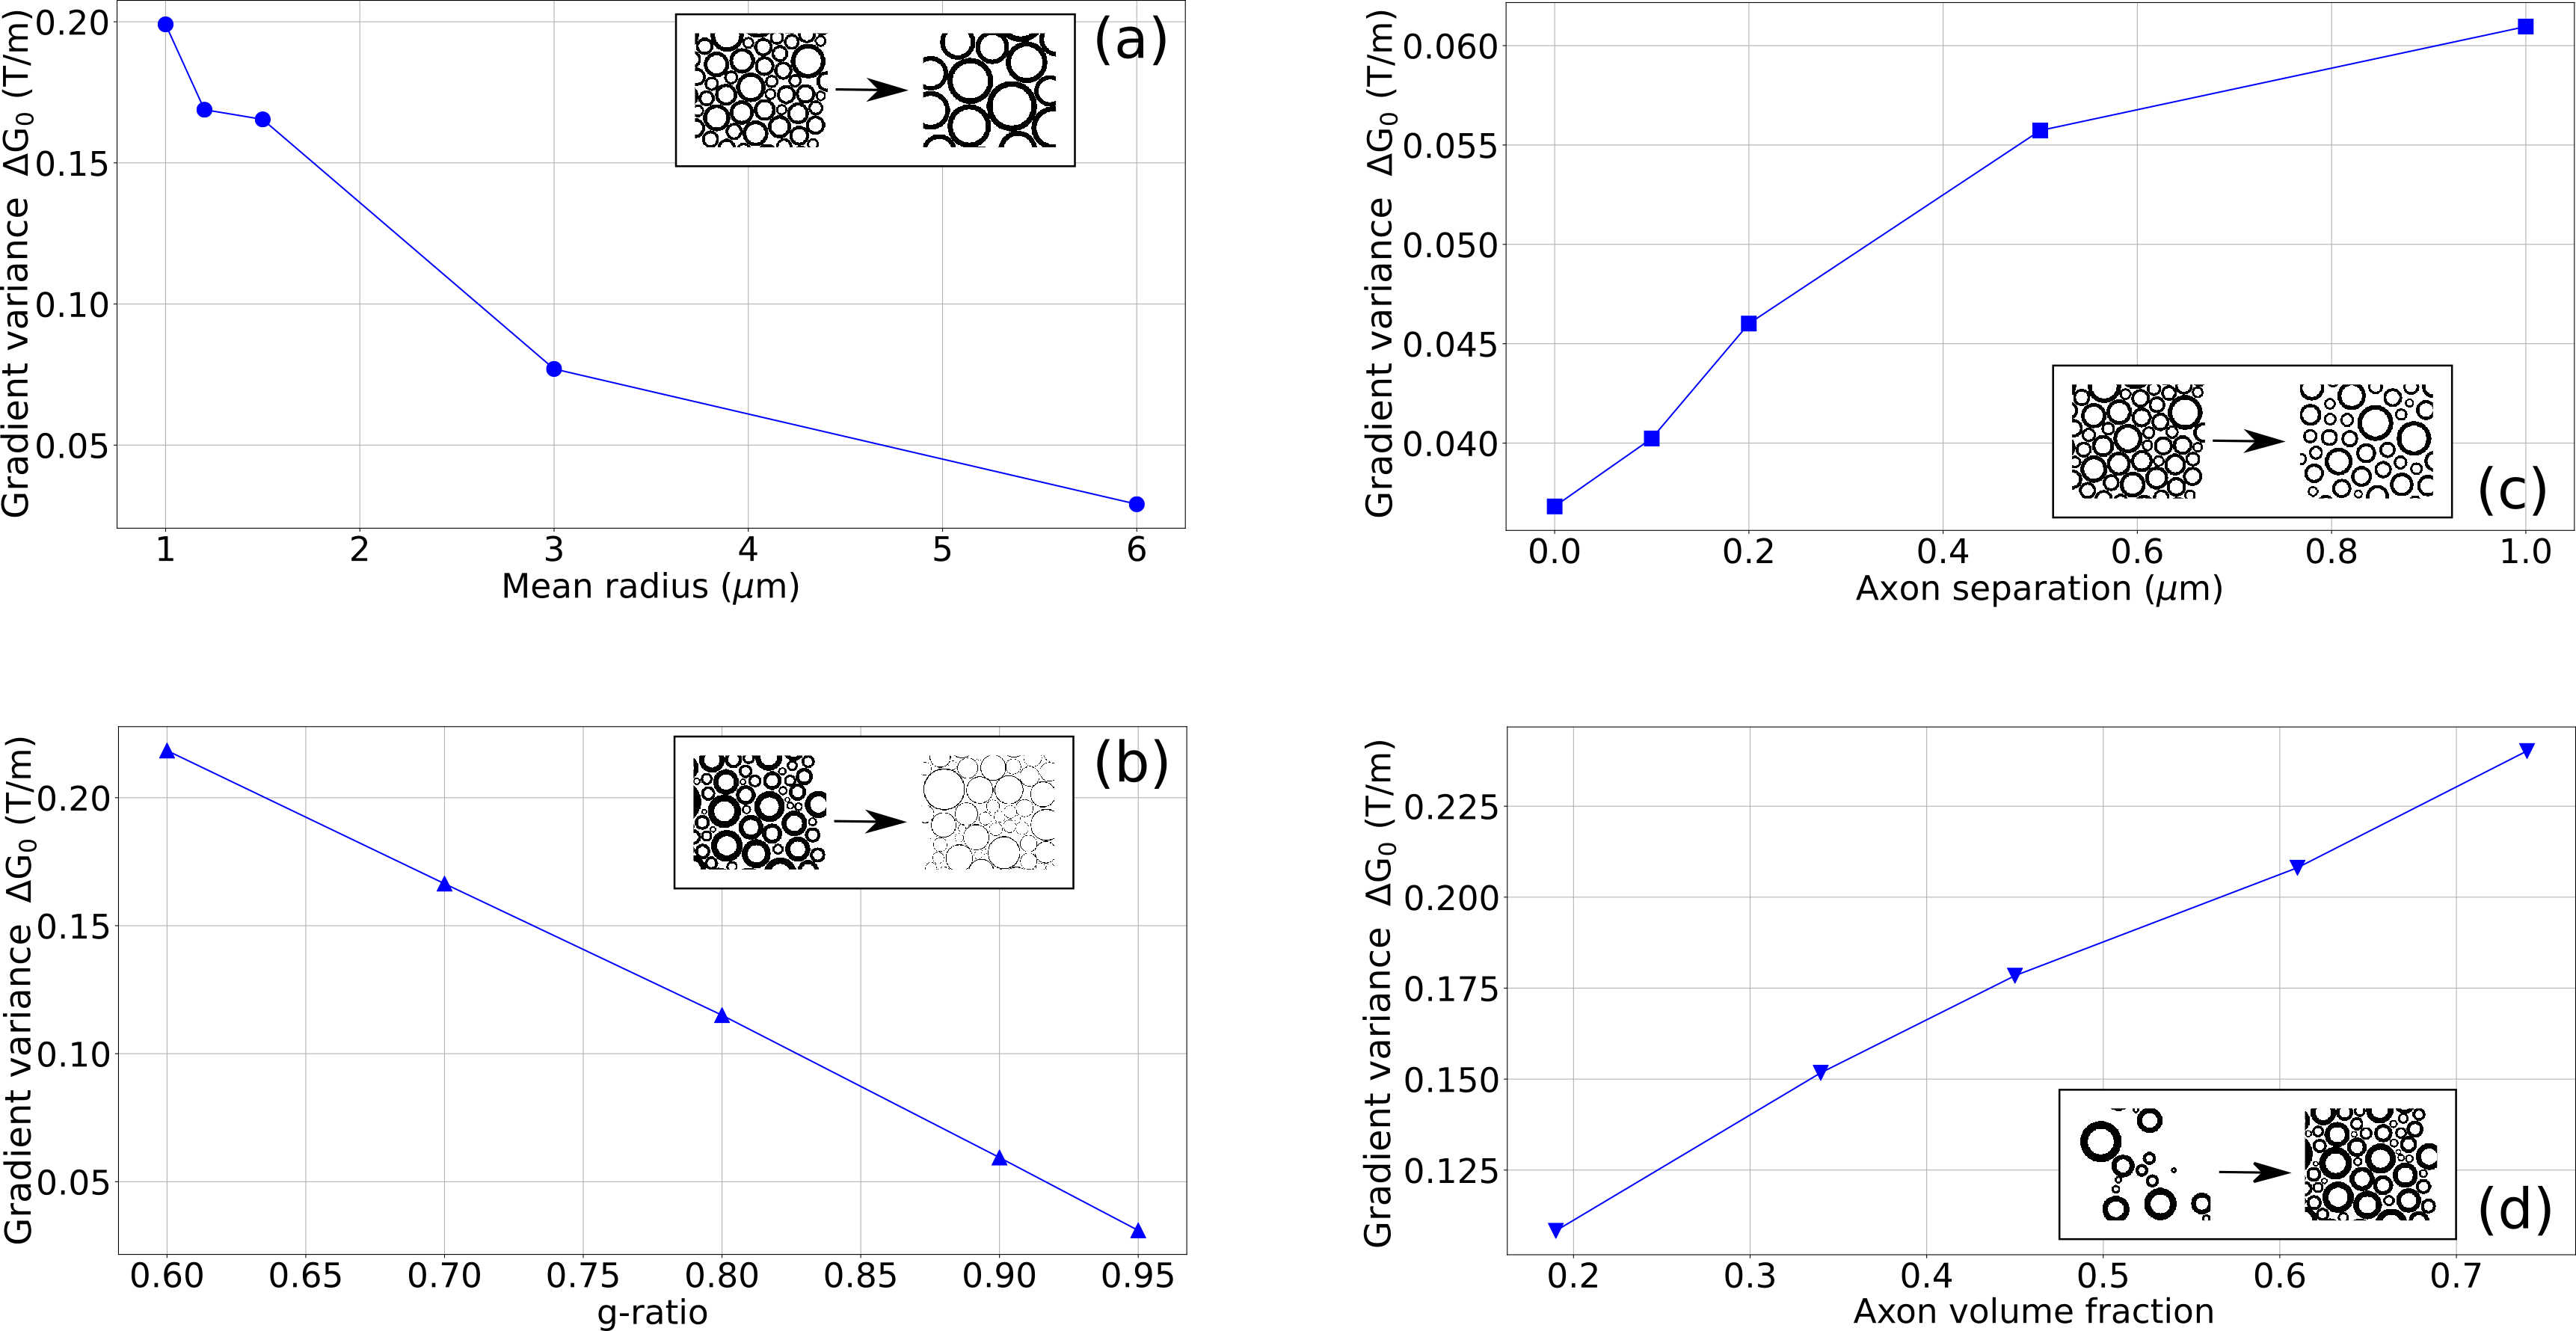
Internal Gradient Distribution induced by axon distributions.We quantify changes in the IGDT from the width ΔG0 along the x-component (along which it is maximum) as a function of the selected parameters in an external field of 9.4 T (Fig. 2). The dynamic range of variation for the relevant parameters and the considered myelin magnetic susceptibility Δχ were taken from the literature 8-12.
Microscopic internal gradient distribution tensors.
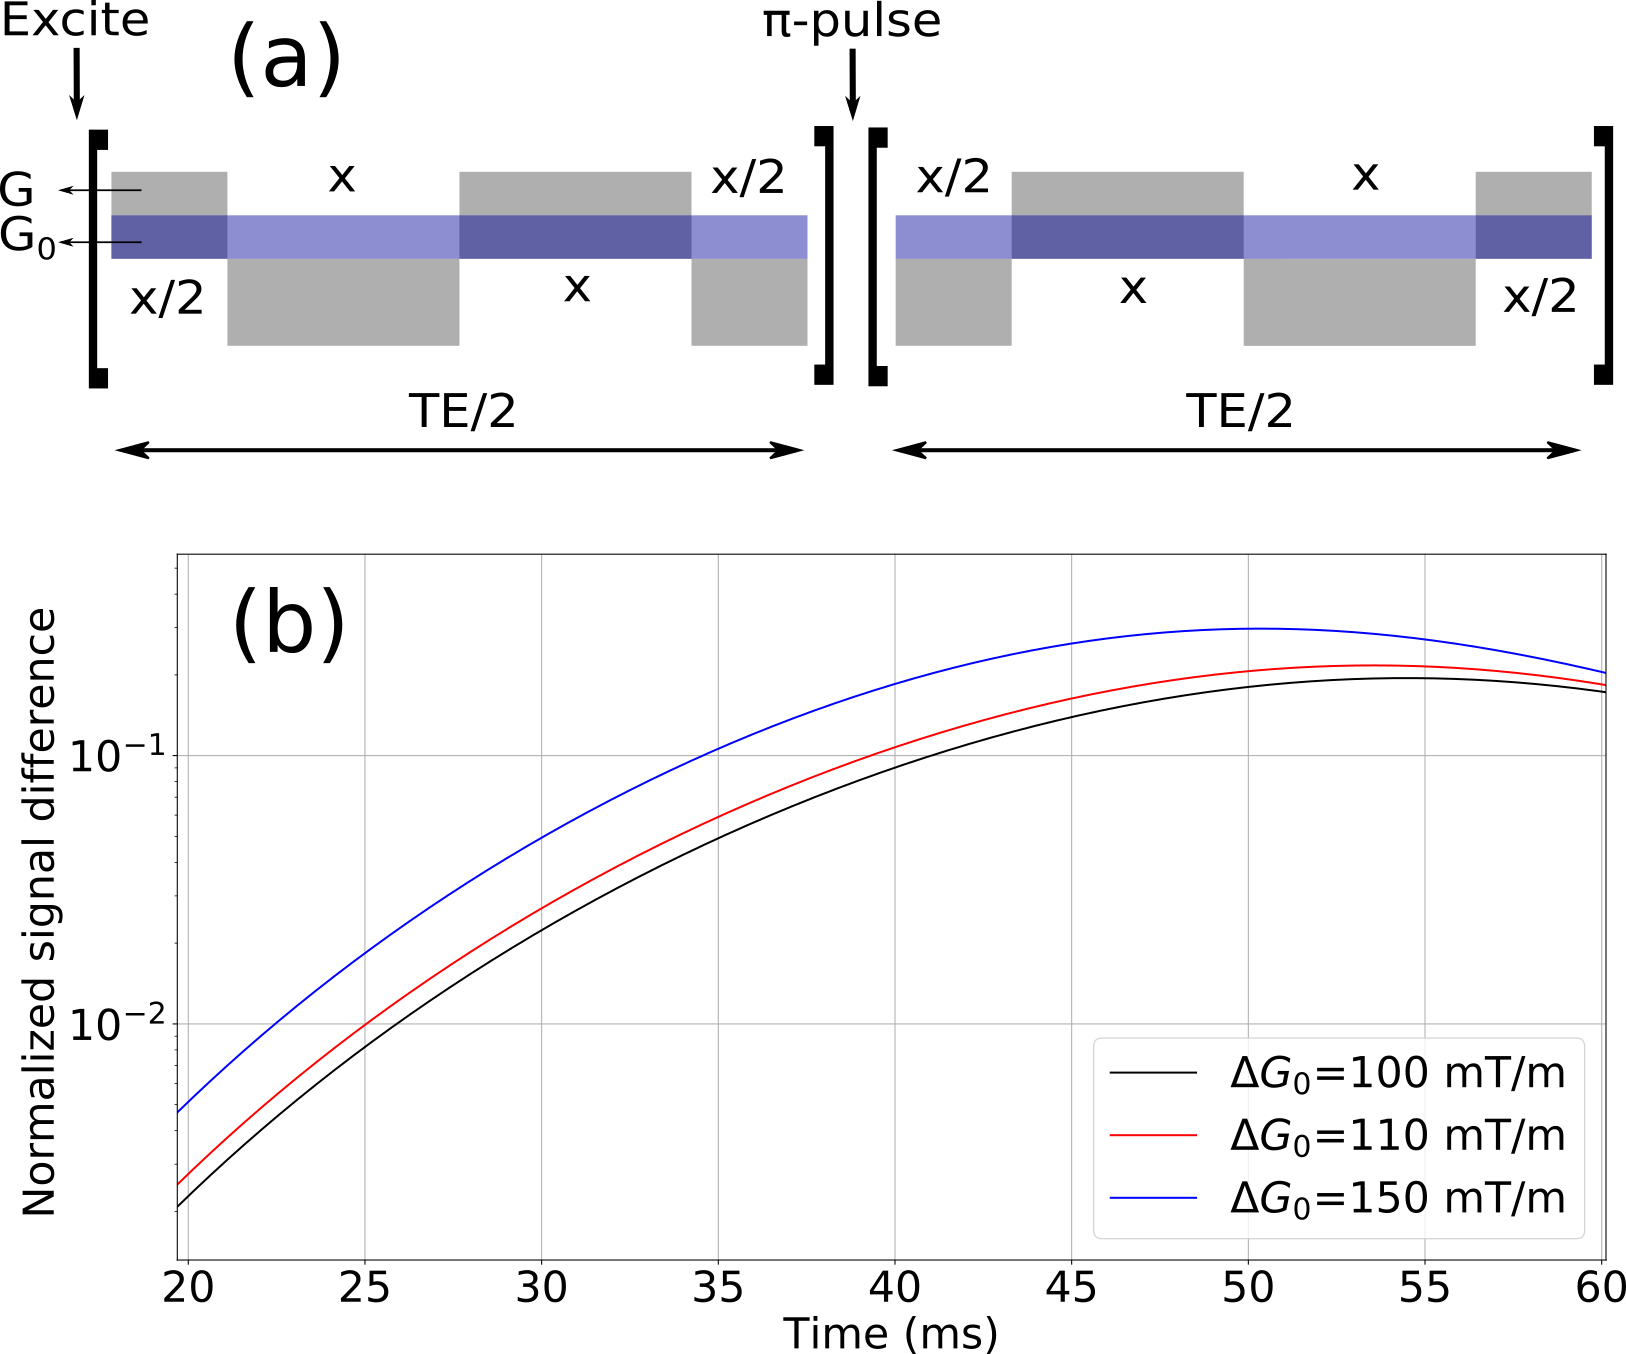
We consider the experimental estimation of these ΔG0 changes using the internal gradient distribution tensor technique 4. The internal gradient distribution width is determined from the signal derived by modulated gradient spin echo (MGSE) sequences that encode cross-terms based on the interference of an applied G and the internal gradients G0. A schematic representation of a MGSE sequence inference of internal gradients is shown in Fig 3a. The diffusion weighted signal decay is exponential, whose exponential argument is
$$\beta(TE)=\beta_{G^2}(TE)+\beta_{G_0^2}(TE)+\beta_{G\cdot G_0^2}(TE)$$
where TE is the total diffusion time of the sequence, $$$\beta_G$$$ is the diffusion weighting argument induced by the applied gradient and $$$\beta_{G_0}$$$ by the internal gradient. The last term is the cross-term used to extract the distribution width ΔG0. Figure 3b shows the signal difference between the MGSE sequences considering the presence of internal gradient distributions and without their effects.
Discussion
Internal gradient distribution widths within the range of 0.03 to 0.3 T/m are predicted as a function of the relevant parameters that characterize axon bundles in the brain white matter (Fig. 2). We show in Fig. 3 that these changes can easily be observed with signal-to-noise ratios within the range of 1% to 10% with the MGSE sequences 4 that interfere with the IGDT. The observed signal decay can be determined on a reasonable total diffusion time lower than the T2 times typical of white matter (80ms). We observed that the width of the intra-axon gradient distribution is in most cases significatively narrower than the extra-axon gradient distribution, and demyelination effects are significant.Conclusion
We observed changes in the internal gradient distribution widths due to structural parameters describing axon bundles which account for the axon mean size, the inter-axon distance, the myelination degree and the axon volume fraction. We found these changes to be in the order of tens of mT/m and we concluded that the effect of these changes in the signal decay of MGSE sequences 4 produce measurable signal differences. Based on the assumed model for axon bundles, our results predict that intra and extra axonal gradients distributions can be markedly different, and that the demyelination process can be diagnosed. Proof-of-principle experiments need first to be performed to achieve this conclusion on a real tissue.Acknowledgements
This work was supported by CONICET, Instituto Balseiro and CNEA; ANPCyT-FONCyT under Grants No. PICT-2017-3447, No. PICT-2017-3699, and No. PICT-2018-04333; PIP-CONICET (Grant No. 11220170100486CO), and UNCUYO SIIP Tipo I 2019-C028.References
1. Lee, J., Shmueli, K., Kang, B. T., Yao, B., Fukunaga, M., Van Gelderen, P., ... & Duyn, J. H. The contribution of myelin to magnetic susceptibility-weighted contrasts in high-field MRI of the brain. Neuroimage. 2012; 59(4), 3967-3975.
2. Liu, C., Li, W., Johnson, G. A., & Wu, B. High-field (9.4 T) MRI of brain dysmyelination by quantitative mapping of magnetic susceptibility. Neuroimage. 2011; 56(3), 930-938.
3. Han, S. H., Song, Y. K., Cho, F. H., Ryu, S., Cho, G., Song, Y. Q., & Cho, H. Magnetic field anisotropy based MR tractography. Journal of Magnetic Resonance. 2011; 212(2), 386-393.
4. Álvarez, G. A., Shemesh, N., & Frydman, L. Internal gradient distributions: A susceptibility-derived tensor delivering morphologies by magnetic resonance. Scientific reports. 2017; 7(1), 1-10.
5. Mingasson, T., Duval, T., Stikov, N., & Cohen-Adad, J. AxonPacking: an open-source software to simulate arrangements of axons in white matter. Frontiers in neuroinformatics. 2017; 11, 5.
6. Ikeda, M., & Oka, Y. The relationship between nerve conduction velocity and fiber morphology during peripheral nerve regeneration. Brain and behavior. 2012; 2(4), 382-390.
7. Pathak, A. P., Ward, B. D., & Schmainda, K. M. A novel technique for modeling susceptibility-based contrast mechanisms for arbitrary microvascular geometries: the finite perturber method. Neuroimage. 2008; 40(3), 1130-1143.
8. Lee, J., Shmueli, K., Kang, B. T., Yao, B., Fukunaga, M., Van Gelderen, P., ... & Duyn, J. H. The contribution of myelin to magnetic susceptibility-weighted contrasts in high-field MRI of the brain. Neuroimage. 2012; 59(4), 3967-3975.
9. Wharton, S., & Bowtell, R. Fiber orientation-dependent white matter contrast in gradient echo MRI. Proceedings of the National Academy of Sciences. 2012; 109(45), 18559-18564.
10. Xu, T., Foxley, S., Kleinnijenhuis, M., Chen, W. C., & Miller, K. L. The effect of realistic geometries on the susceptibility‐weighted MR signal in white matter. Magnetic resonance in medicine. 2018; 79(1), 489-500.
11. Sukstanskii, A. L., & Yablonskiy, D. A. On the role of neuronal magnetic susceptibility and structure symmetry on gradient echo MR signal formation. Magnetic resonance in medicine. 2014; 71(1), 345-353.
12. Liu, C., Li, W., Johnson, G. A., & Wu, B. High-field (9.4 T) MRI of brain dysmyelination by quantitative mapping of magnetic susceptibility. Neuroimage. 2011; 56(3), 930-938.
Figures