1715
A new superficial white matter connectivity atlas of the chimpanzee brain
Maëlig Chauvel1, Ivy Uszynski1, William Hopkins2, Jean-François Mangin1, and Cyril Poupon1
1Université Paris-Saclay, CEA, CNRS, BAOBAB, Neurospin, Gif-sur-Yvette, France, 2Keeling Center for Comparative Medicine and Research, The University of Texas MD Anderson Cancer Center, Bastrop, TX, United States
1Université Paris-Saclay, CEA, CNRS, BAOBAB, Neurospin, Gif-sur-Yvette, France, 2Keeling Center for Comparative Medicine and Research, The University of Texas MD Anderson Cancer Center, Bastrop, TX, United States
Synopsis
Mapping the chimpanzee brain connectome is a key to the comprehension of the singularity of the human brain evolution. Contrary to the macaque species, few studies have been performed in vivo on chimpanzees due to its proximity with humans. While different atlases of the structural connectivity exist for humans, we established the first superficial atlas of the white matter connectivity in chimpanzees, using diffusion MRI-based tractography and advanced fiber clustering techniques.
Introduction
Humans are the fruit of a long and complex brain evolution. A way to better appreciate the ancient or evolved Homo sapiens brain characteristics relies on comparative investigations with homologous species. Because Human kind phylogenetically separated from the Pan kind around 6 million years ago, chimpanzees remain our closest living hominidae relative, making it a pertinent model for brain studies1. Few studies address the structural connectivity of the chimpanzee brain, whereas its proximity with humans could be key to understanding the human brain. Thanks to the unique imaging data collection provided by the National Yerkes Primate Research Center and the access to elaborated diffusion MRI tools to investigate brain connectivity, we propose here to establish the first atlas of the superficial white matter bundles of the chimpanzee brain.Materials and methods
Chimpanzee cohort - A cohort of 39 chimpanzees including 23 females and 16 males aged from 9 to 25 years old stemming from the National Yerkes Primate Research Center (NYPRC, Atlanta) was studied in the frame of an imaging protocol approved by the Local Animal Welfare Committee.Imaging protocol - All individuals were scanned using a Siemens Tim Trio 3T MRI system with a birdcage coil with an imaging protocol including a 0.625mm isotropic MPRAGE T1-weighted scan and a series of 5 1.9mm isotropic diffusion MRI (dMRI) scans using a single-short 2D PGSE sequence (TE/TR=86ms/6s, RBW=1563Hz/pixel, matrix 128x128, FOV=243.2mm) at b=1000s/mm² along 60 diffusion directions.
Pre/Post-processing - After correcting for imaging artifacts2 and matching all individuals to the Juna.Chimp template3 using diffeomorphic registration4, dMRI was used to compute analytical Q-ball ODF maps5 (SH order 6, Laplace-Beltrami regularization factor of 0.006) from which a whole brain regularized deterministic tractography was launched (1 seed/voxel, forward step 0.4mm, aperture angle 30°) to obtain individual tractograms. A fiber clustering algorithm was then applied to the set of tractograms following the approach of Guevara et al in 20126. It includes an intra-subject hierarchical fiber clustering of connectograms relying on a hemisphere-based, length-based, and brain parcels-based partition of fibers to obtain individual clusters represented by their centroid, followed by a cross-subject clustering using a density-based spatial clustering of the individual centroid maps (DBSCAN)7 using a corrected pairwise maximum Euclidean distance to define an affinity between centroids. The parameters were optimized in order to get an optimal number of clusters, yielding a normalization factor nf=26, a centroid affinity maximum distance of 18mm, an affinity maximum distance after exclusion of 4mm, and an affinity variance of 140625mm².
Superficial clusters were then selected using the Davi130 parcellation atlas3. Each superficial cluster connecting two parcels A and B was attributed a name following the syntax A_B_Id (Id corresponding to the cluster index in the set of all clusters connecting parcels A and B), thus yielding a novel superficial white matter bundle atlas of the chimpanzee. The atlas was then applied to the 39 chimpanzees tractograms to allow quantitative investigations.
Results
39 individual whole brain tractograms were obtained, including a mean of 1503922 ± 158933 fibers, from which a fiber length histogram was computed to define length boundaries and a threshold of 40mm to separate long from short fibers. The intra-subject fiber clustering step performed on short fibers provided 5400±747 clusters for the left hemisphere and 5473±737 clusters for the right hemisphere at the individual scale, being slightly higher for the right hemisphere.Thanks to the optimization of the different parameters of the clustering algorithm (particularly the normalization factor and the centroid maximum affinity distance, see figure 1.) inter-subject fiber clustering step resulted in 2424 clusters for the left hemisphere and 2438 clusters for the right hemisphere. The automatic labelisation using the DAVI 130 parcellation resulted in a total of 137 pair-matched regions, with 2189 clusters for the left hemisphere and 2182 clusters on the right hemisphere (see figure 2.), allowing the creation of a new superficial white matter bundle atlas of the chimpanzee brain (see figure 3.).Conclusion
To our knowledge, while the first long bundle atlas of the chimpanzee brain has already been released8, the work presented here is the first superficial white matter atlas of the chimpanzee brain. This atlas has to be validated with postmortem studies, but already provides a tool to investigate the commonalities/singularities of the chimpanzee/human brain.Acknowledgements
This work was partially funded by the Blaise Pascal Chair from Région Ile de France and University Paris-Saclay to W. Hopkins.References
- D. Goldman et al., PNAS, 1987 ; 84(10):3307‑11
- J.L.R. Andersson, NeuroImage, 2003 ; 20(2):870-888
- S. Vickery et al., bioRxiv, 2020 ; 10.1101/2020.04.20.04
- B.B. Avants, et al.,NeuroImage, 2012 ; 54(3), pp.2033–2044
- M. Descoteaux et al., MRM, 2007 ; 58(3), 497-510
- P. Guevara et al., Neuroimage, 2012 ; 61(4), 1083-1099
- M.Ester et al., KDD, 1996 ; 10.5555/3001460.3001507
- K.L Bryant et al.; bioRxiv, 2020 ; 10.1101/2020.01.24.918516
Figures
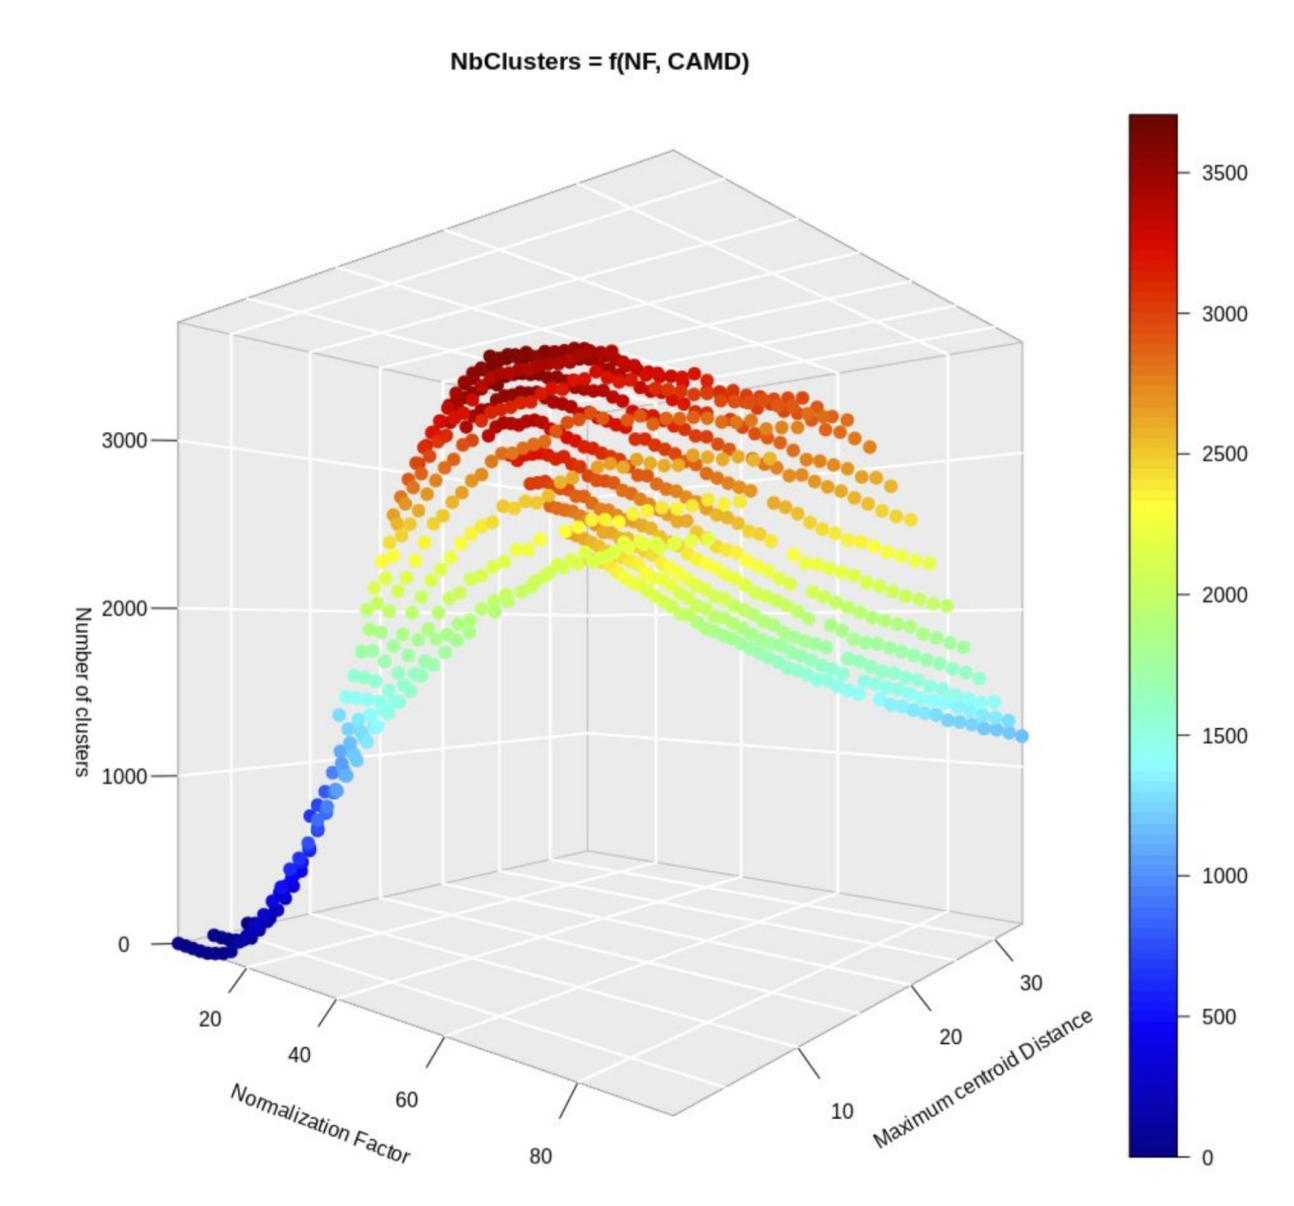
Figure 1. Optimization of the inter-subject fiber clustering in order to obtain a maximum number of clusters of fibers. Abbreviations : Nf - Normalization Factor, CAMD - centroid affinity maximum distance. The normalization factor allows a better consideration of the length of the different fibers, the maximum affinity centroid distance acts on the intensity of the fiber aggregation. The color bar is an indicator of the number of clusters. The maxima was reached for Nf = 26 and CAMD = 18 with 3705 clusters for the left hemisphere.
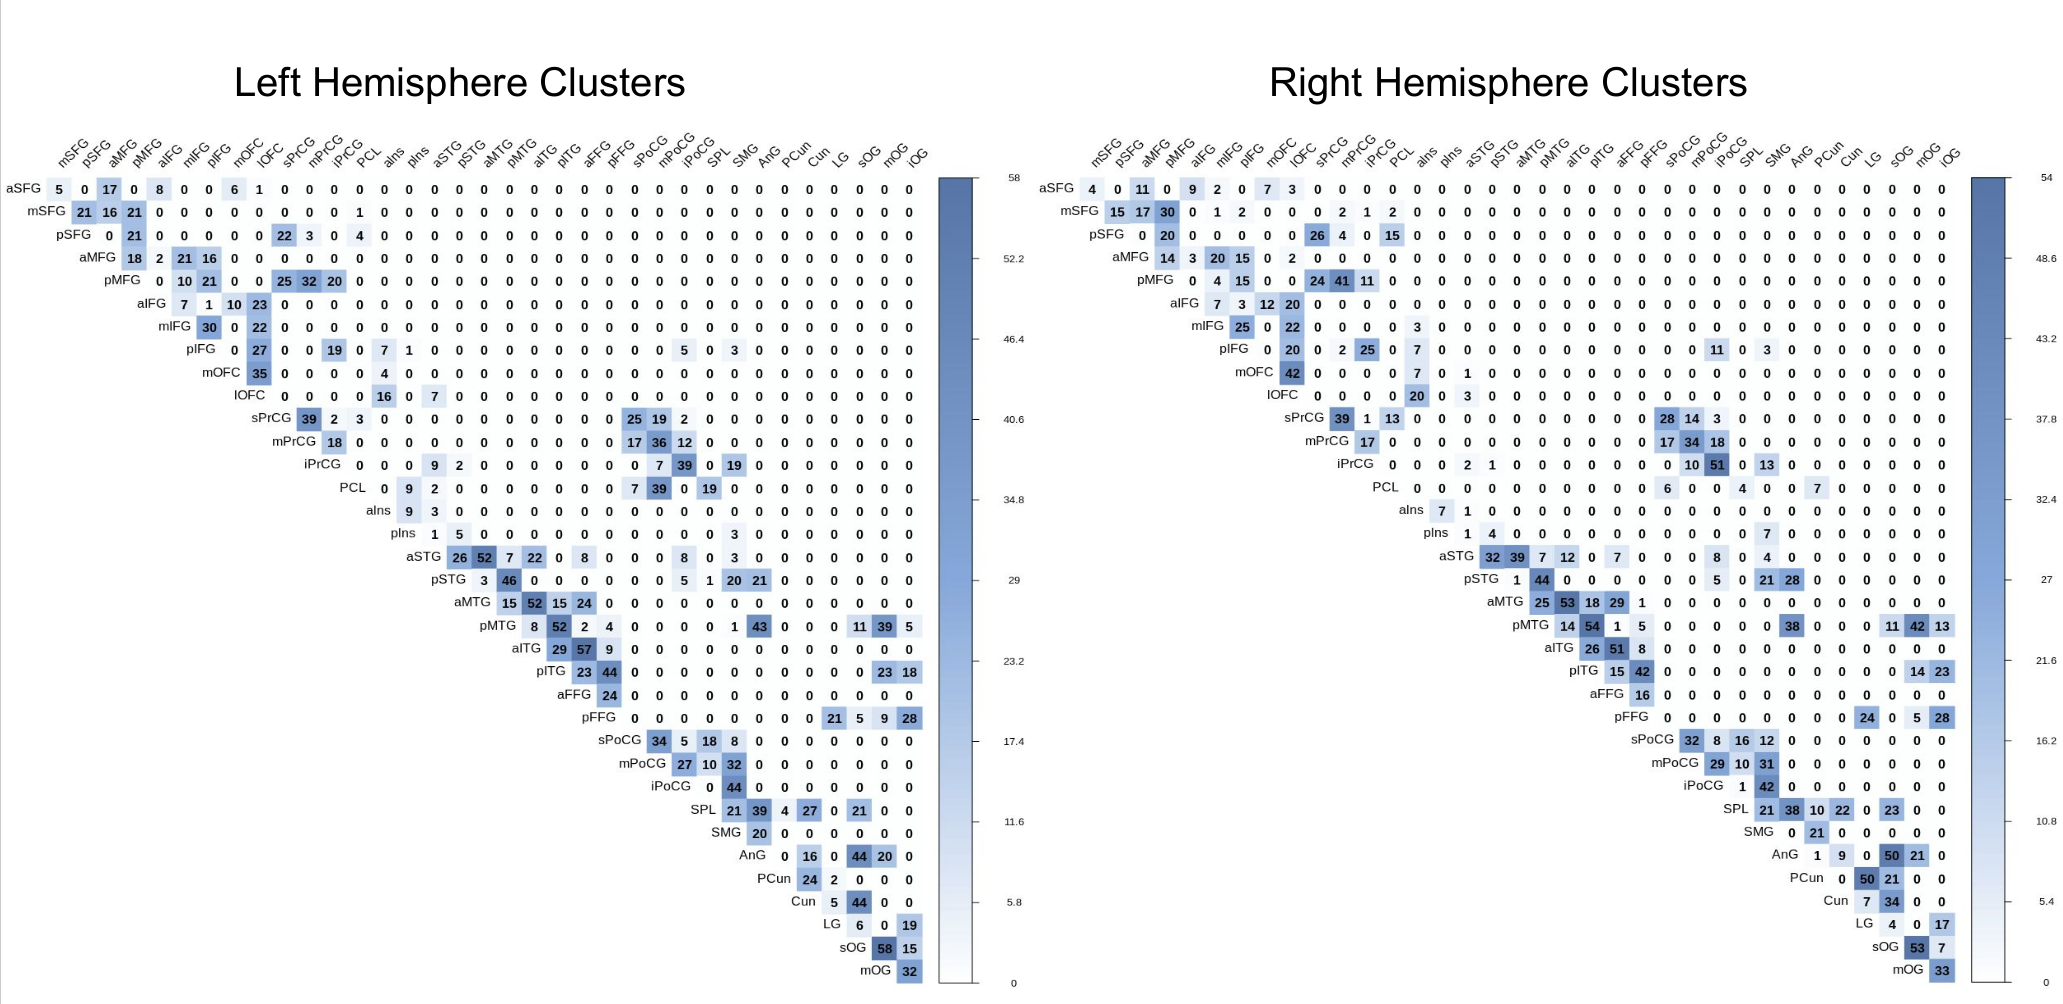
Figure 2. Matrices of the number of clusters found for each pair of regions of the left and right hemisphere superficial white matter bundles atlas. The color bar intensity is related to the number of clusters, in total, 2189 / 2182 clusters found for the left/right hemispheres.
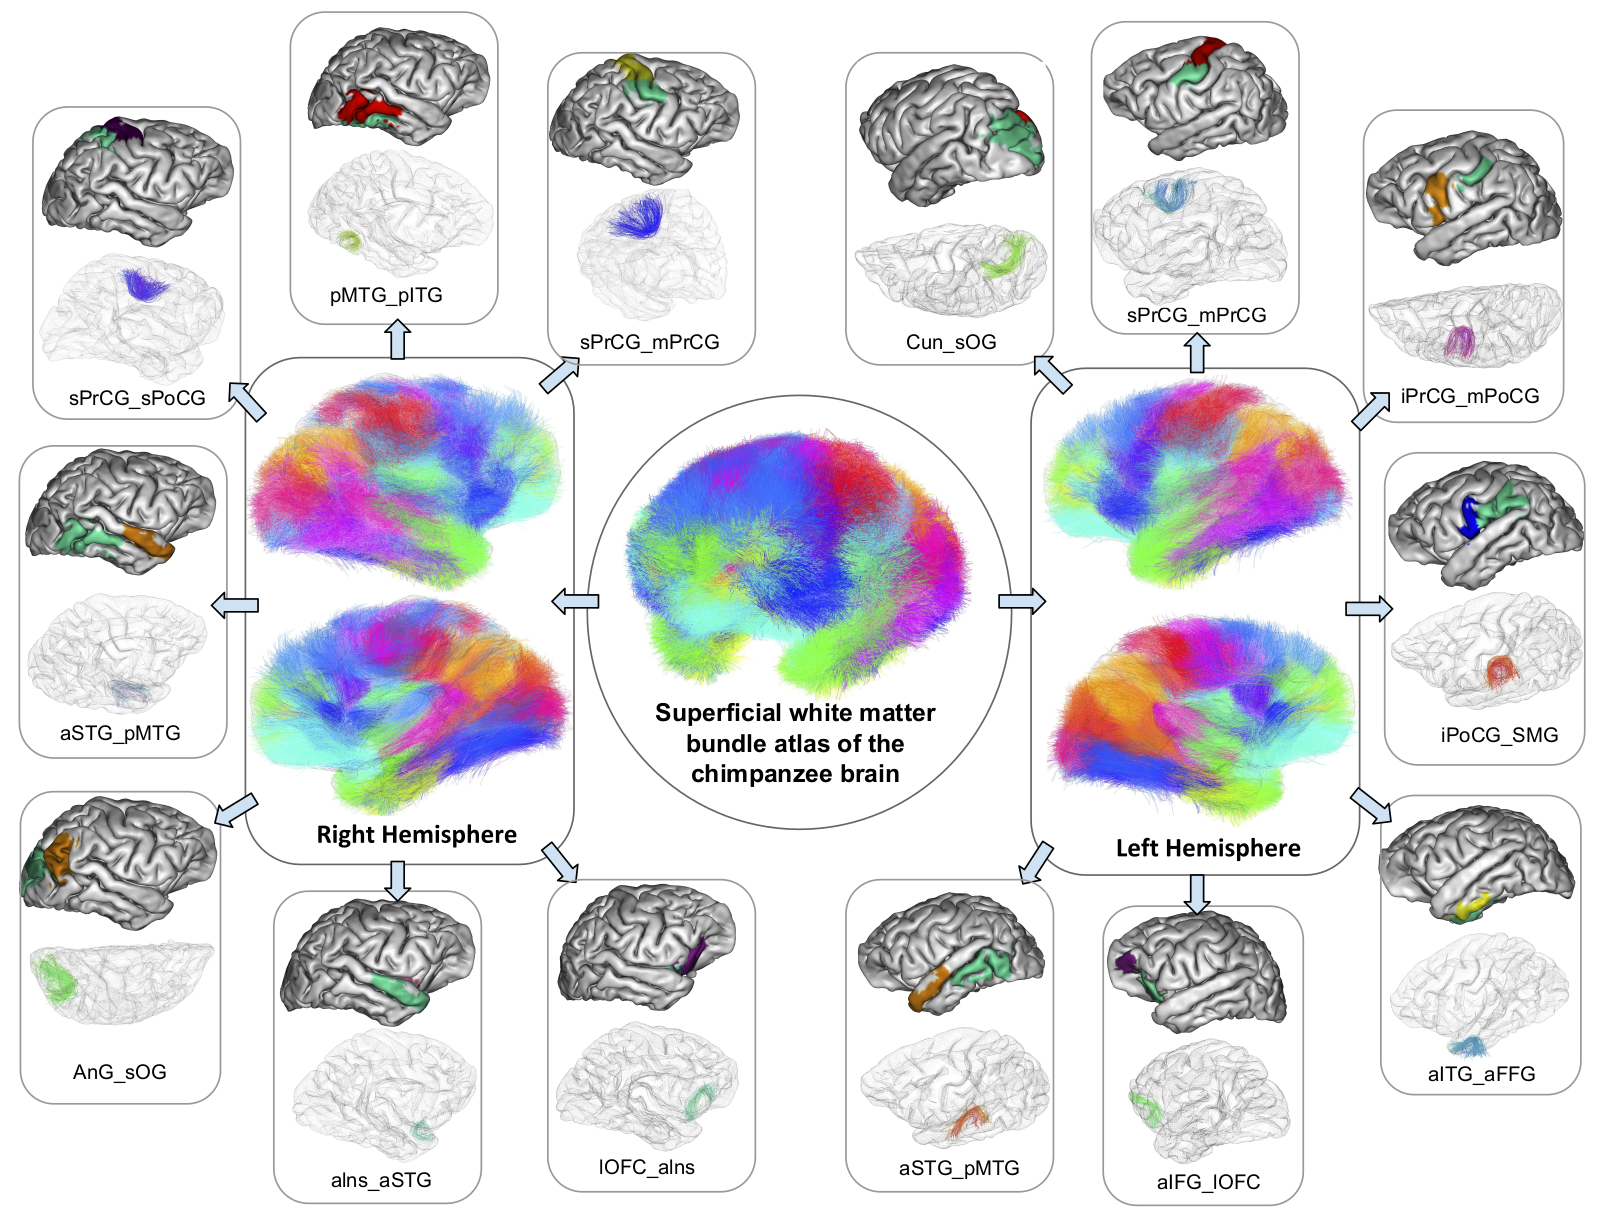
Figure 3. Superficial white matter bundle atlas of the chimpanzee brain (center), with a detailed vision of some U-fibers found in the right (on the left) and left hemispheres (on the right). Abbreviations : a,s,p,m,l : anterior, superior, posterior, medial, lateral ; AnG : Angular gyrus, Cun : Cuneus, FFG : Fusiform gyrus, IFG : Inferior frontal gyrus, ITG : Inferior temporal gyrus, OFC : Orbitofrontal cortex, OG : Occipital gyrus, lns : Insula, MTG : Middle temporal gyrus, PoCG : Postcentral gyrus, PrCG : Precentral gyrus, SMG : Supramarginal gyrus, STG : Superior temporal gyrus.