1714
Technical performance of ADC and IVIM measurements in glioma and normal brain on a 1.5T MR-Linac
Liam S. P. Lawrence1, Rachel W. Chan2, Hanbo Chen3, Brian Keller3, James Stewart3, Mark Ruschin3, Brige Chugh3,4, Mikki Campbell3, Aimee Theriault3, Greg J. Stanisz1,2,5, Scott MacKenzie3, Sten Myrehaug3, Jay Detsky3, Pejman J. Maralani6, Chia-Lin Tseng3, Greg J. Czarnota1,2,3, Arjun Sahgal3, and Angus Z. Lau1,2
1Medical Biophysics, University of Toronto, Toronto, ON, Canada, 2Physical Sciences, Sunnybrook Research Institute, Toronto, ON, Canada, 3Department of Radiation Oncology, Sunnybrook Health Sciences Centre, Toronto, ON, Canada, 4Department of Physics, Ryerson University, Toronto, ON, Canada, 5Department of Neurosurgery and Paediatric Neurosurgery, Medical University of Lublin, Lublin, Poland, 6Department of Medical Imaging, University of Toronto, Sunnybrook Health Sciences Centre, Toronto, ON, Canada
1Medical Biophysics, University of Toronto, Toronto, ON, Canada, 2Physical Sciences, Sunnybrook Research Institute, Toronto, ON, Canada, 3Department of Radiation Oncology, Sunnybrook Health Sciences Centre, Toronto, ON, Canada, 4Department of Physics, Ryerson University, Toronto, ON, Canada, 5Department of Neurosurgery and Paediatric Neurosurgery, Medical University of Lublin, Lublin, Poland, 6Department of Medical Imaging, University of Toronto, Sunnybrook Health Sciences Centre, Toronto, ON, Canada
Synopsis
Technical performance evaluation of diffusion parameters on MR-Linacs (MRLs) is important for cancer applications. We evaluated the accuracy and repeatability of 1.5T MRL measurements of apparent diffusion coefficient (ADC) and intravoxel incoherent motion blood volume fraction (IVIM-f) in the brain via comparison with a diagnostic-quality scanner, in patients undergoing treatment. ADC measurements agree in normal and tumour tissue, but are biased in cerebrospinal fluid. IVIM-f measurements are likely negatively biased. Repeatability is comparable between scanners. The majority of high-grade glioma patients demonstrated significant ADC changes, but not IVIM-f changes.
Introduction
Parameters derived from diffusion-weighted imaging (DWI) are potentially early biomarkers of glioma treatment response.1-3 Characterizing changes in diffusion parameters during radiotherapy for the development of response criteria can be done using a MR-Linac (MRL), a combined MR scanner and linear accelerator, which allows serial quantitative imaging during radiotherapy. The hardware modifications required to integrate the scanner and accelerator have an unknown effect on in vivo scan quality. In this abstract, we evaluate the accuracy and repeatability of ADC and IVIM blood volume fraction (IVIM-f) measurements in the brain on a MR-Linac in patients.Methods
Patients with central nervous system tumours received 15-30 fractions of radiotherapy on a 1.5T Elekta Unity MR-Linac (Elekta, Stockholm, Sweden). Additional imaging was performed (Philips Ingenia 1.5T MR) at select time-points during therapy. DW images with single-shot EPI readout and T1-weighted images for anatomical reference were acquired, using the parameters shown in Figure 1.Four ROIs were used: the gross tumour and clinical target volumes (GTV, CTV), contralateral normal-appearing white matter (cNAWM), and cerebrospinal fluid (CSF). The GTV and CTV were contoured as part of treatment planning. cNAWM was created by segmentation with FSL FAST.4,5 CSF was created using a region-growing algorithm in the ventricles implemented in FSL.
Voxelwise ADC maps were computed by linear least-squares fitting of a monoexponential model to the log-signal versus b-value using a subset of the acquired b-values (MRL: [100,200,400,800] s/mm2; Ingenia: [200,400,600,800] s/mm2). The median ADC over each ROI was computed. IVIM-f was computed over each ROI by (1) averaging over voxels with ADC<1.5 μm2/ms to minimize edema/CSF effects, (2) fitting a monoexponential model between 200-800 s/mm2, and (3) computing $$$f = 1-S_0/S(0)$$$.
To evaluate accuracy, we compared same-day measurements from the MR-Linac and Ingenia. Brain DW images and ROIs were rigidly co-registered using FSL FLIRT6,7 and resampled to the MRL voxel size. Bias and limits of agreement (95% confidence intervals) were computed for both median ADC and IVIM-f (N=7 patients, 11 paired scans).
To evaluate repeatability (N=24 on MRL, 21 on Ingenia, 39 unique total), the within-subject standard deviation ($$$\text{wSD}$$$) and coefficient of variation ($$$\text{wCV}$$$) of the diffusion parameters for cNAWM and CSF were computed using R.8 The $$$\text{wSD}$$$ was estimated for each parameter over each ROI by fitting the one-way random effects model $$$y_{ij} = \mu + \alpha_i + \varepsilon_{ij}$$$ using the $$$\mathtt{lmer}$$$ function: $$$i$$$ indexes subjects, $$$j$$$ indexes repeats, $$$y_{ij}$$$ are the measurements, $$$\mu$$$ is the population mean, $$$\alpha_i$$$ are the subject random effects, and $$$\varepsilon_{ij} \sim \mathcal{N}(0,\text{wSD}^2)$$$ are the residuals. Confidence intervals were computed using the $$$\mathtt{confint}$$$ function. $$$\text{wCV}$$$ was estimated as $$$\text{wSD}/\mu$$$. The percent repeatability coefficient $$$\text{%RC}$$$ = 2.77$$$\text{wCV}$$$, which sets the threshold for statistical significance of change at the 95% confidence level,9 was computed. To show that the MRL $$$\text{wSD}$$$ is comparable to the Ingenia $$$\text{wSD}$$$, a one-sided t-test10 using the absolute squared residuals11 on the hypothesis that the MRL $$$\text{wSD}^2$$$ was larger than the Ingenia $$$\text{wSD}^2$$$ with a margin of $$$1.4 \times 10^{-5}$$$ (μm2/ms)2 (ADC) or $$$1.4 \times 10^{-6}$$$ (IVIM-f) was performed.
To evaluate if the repeatability coefficients of ADC and IVIM-f on the MR-Linac were sufficient for detecting changes over a 6-week radiotherapy course, the time-series of each parameter was computed over the GTV for 20 patients with high-grade glioma. If a parameter at any session was different from baseline by more than $$$\text{%RC}$$$, then the time-series was classified accordingly (“increased”, “no change”, “decreased”, “both”). The number of patients for which a significant change could be detected was counted.
Results and Discussion
The MRL-Ingenia comparison (Figure 2) showed MRL ADC has minimal bias relative to Ingenia in cNAWM, GTV, and CTV (-0.03±0.03, -0.04±0.06, -0.06±0.08 μm2/ms respectively), but is negatively biased in CSF (-0.34±0.21 μm2/ms). Possible reasons include signal-to-noise ratio12 and differing diffusion times13 due to lower maximum gradient strength (MRL: 15 mT/m; Ingenia: 40 mT/m). IVIM-f measurements appear negatively biased (Figure 2C), despite the confidence intervals overlapping zero (cNAWM: -0.02±0.02, GTV: -0.02±0.04, CTV: -0.03±0.03). The bias could be due to partial volume averaging with CSF.14The repeated measurement data from patients are shown in Figure 3 — the variability could be partly due to physiological noise, treatment effect, and longitudinal changes. Figure 4 summarizes the repeatability metrics: the MRL $$$\text{wSD}^2$$$ was not greater than the Ingenia $$$\text{wSD}^2$$$ by the stated margins for ADC-WM (p=.049) and IVIM-f-WM (p=.049); the test was inconclusive for ADC-CSF (p=.21).
Figure 5 shows parameter time-series over the GTV. ADC change was detected at the 95% confidence level for 17 of 20 patients; IVIM-f change was detected for only 4 of 20 patients.
Conclusions
ADC measurements on the MRL are comparable to those on a Philips Ingenia 1.5T in white matter, the GTV, and the CTV, but are biased in CSF. IVIM-f measurements are likely negatively biased. Repeatability is comparable between scanners for both ADC and IVIM-f in white matter, based on a one-sided t-test. Significant differences between intra-treatment ADC and the baseline value were detectable in the GTV for the majority of patients; the same was not true of IVIM-f.Acknowledgements
We would like to thank the MR-Linac radiation therapists Danny Yu, Katie Wong, Helen Su, Monica Foster, Shawn Binda, Rebekah Shin, Ruby Bola, Susana Sabaratram, Christina Silverson and Anne Carty for scanning and for their assistance with the protocol. We gratefully acknowledge the following sources of funding: Natural Sciences and Engineering Research Council (NSERC); the Terry Fox Research Institute; Canadian Institutes of Health Research; the Canadian Cancer Society Research Institute.References
- Chenevert TL, Stegman LD, Taylor JMG, et al. Diffusion Magnetic Resonance Imaging: an Early Surrogate Marker of Therapeutic Efficacy in Brain Tumors. J Natl Cancer Inst. 2000;92(24):2029-2036. doi:10.1093/jnci/92.24.20292.
- Hamstra DA, Galbán CJ, Meyer CR, et al. Functional Diffusion Map As an Early Imaging Biomarker for High-Grade Glioma: Correlation With Conventional Radiologic Response and Overall Survival. J Clin Oncol. 2008;26(20):3387-3394. doi:10.1200/JCO.2007.15.23633.
- Ellingson BM, Cloughesy TF, Zaw T, et al. Functional diffusion maps (fDMs) evaluated before and after radiochemotherapy predict progression-free and overall survival in newly diagnosed glioblastoma. Neuro-Oncol. 2012;14(3):333-343. doi:10.1093/neuonc/nor2204.
- Smith SM, Jenkinson M, Woolrich MW, et al. Advances in functional and structural MR image analysis and implementation as FSL. NeuroImage. 2004;23:S208-S219. doi:10.1016/j.neuroimage.2004.07.0515.
- Zhang Y, Brady M, Smith S. Segmentation of brain MR images through a hidden Markov random field model and the expectation-maximization algorithm. IEEE Trans Med Imaging. 2001;20(1):45-57. doi:10.1109/42.9064246.
- Jenkinson M, Smith S. A global optimisation method for robust affine registration of brain images. Med Image Anal. 2001;5(2):143-156. doi:10.1016/S1361-8415(01)00036-67.
- Jenkinson M, Bannister P, Brady M, Smith S. Improved Optimization for the Robust and Accurate Linear Registration and Motion Correction of Brain Images. NeuroImage. 2002;17(2):825-841. doi:10.1006/nimg.2002.11328.
- Raunig DL, McShane LM, Pennello G, et al. Quantitative imaging biomarkers: A review of statistical methods for technical performance assessment. Stat Methods Med Res. 2015;24(1):27-67. doi:10.1177/09622802145373449.
- Shukla‐Dave A, Obuchowski NA, Chenevert TL, et al. Quantitative imaging biomarkers alliance (QIBA) recommendations for improved precision of DWI and DCE‐MRI derived biomarkers in multicenter oncology trials. J Magn Reson Imaging. 2019;49(7):e101-e121. doi:10.1002/jmri.2651812.
- Lakens D. Equivalence Tests: A Practical Primer for t Tests, Correlations, and Meta-Analyses. Soc Psychol Personal Sci. 2017;8(4):355-362. doi:10.1177/194855061769717710.
- Barnhart HX, Barboriak DP. Applications of the Repeatability of Quantitative Imaging Biomarkers: A Review of Statistical Analysis of Repeat Data Sets. Trans Oncol. 2009;2(4):231-235. doi:10.1593/tlo.0926811.
- Jones DK. Precision and Accuracy in Diffusion Tensor Magnetic Resonance Imaging: Top Magn Reson Imaging. 2010;21(2):87-99. doi:10.1097/RMR.0b013e31821e56ac13.
- Kooreman ES, van Houdt PJ, Keesman R, et al. ADC measurements on the Unity MR-linac – A recommendation on behalf of the Elekta Unity MR-linac consortium. Radiother Oncol. Published online October 2020:S0167814020308215. doi:10.1016/j.radonc.2020.09.04614.
- Bisdas S, Klose U. IVIM analysis of brain tumors: an investigation of the relaxation effects of CSF, blood, and tumor tissue on the estimated perfusion fraction. Magn Reson Mater Phy. 2015;28(4):377-383. doi:10.1007/s10334-014-0474-z
Figures
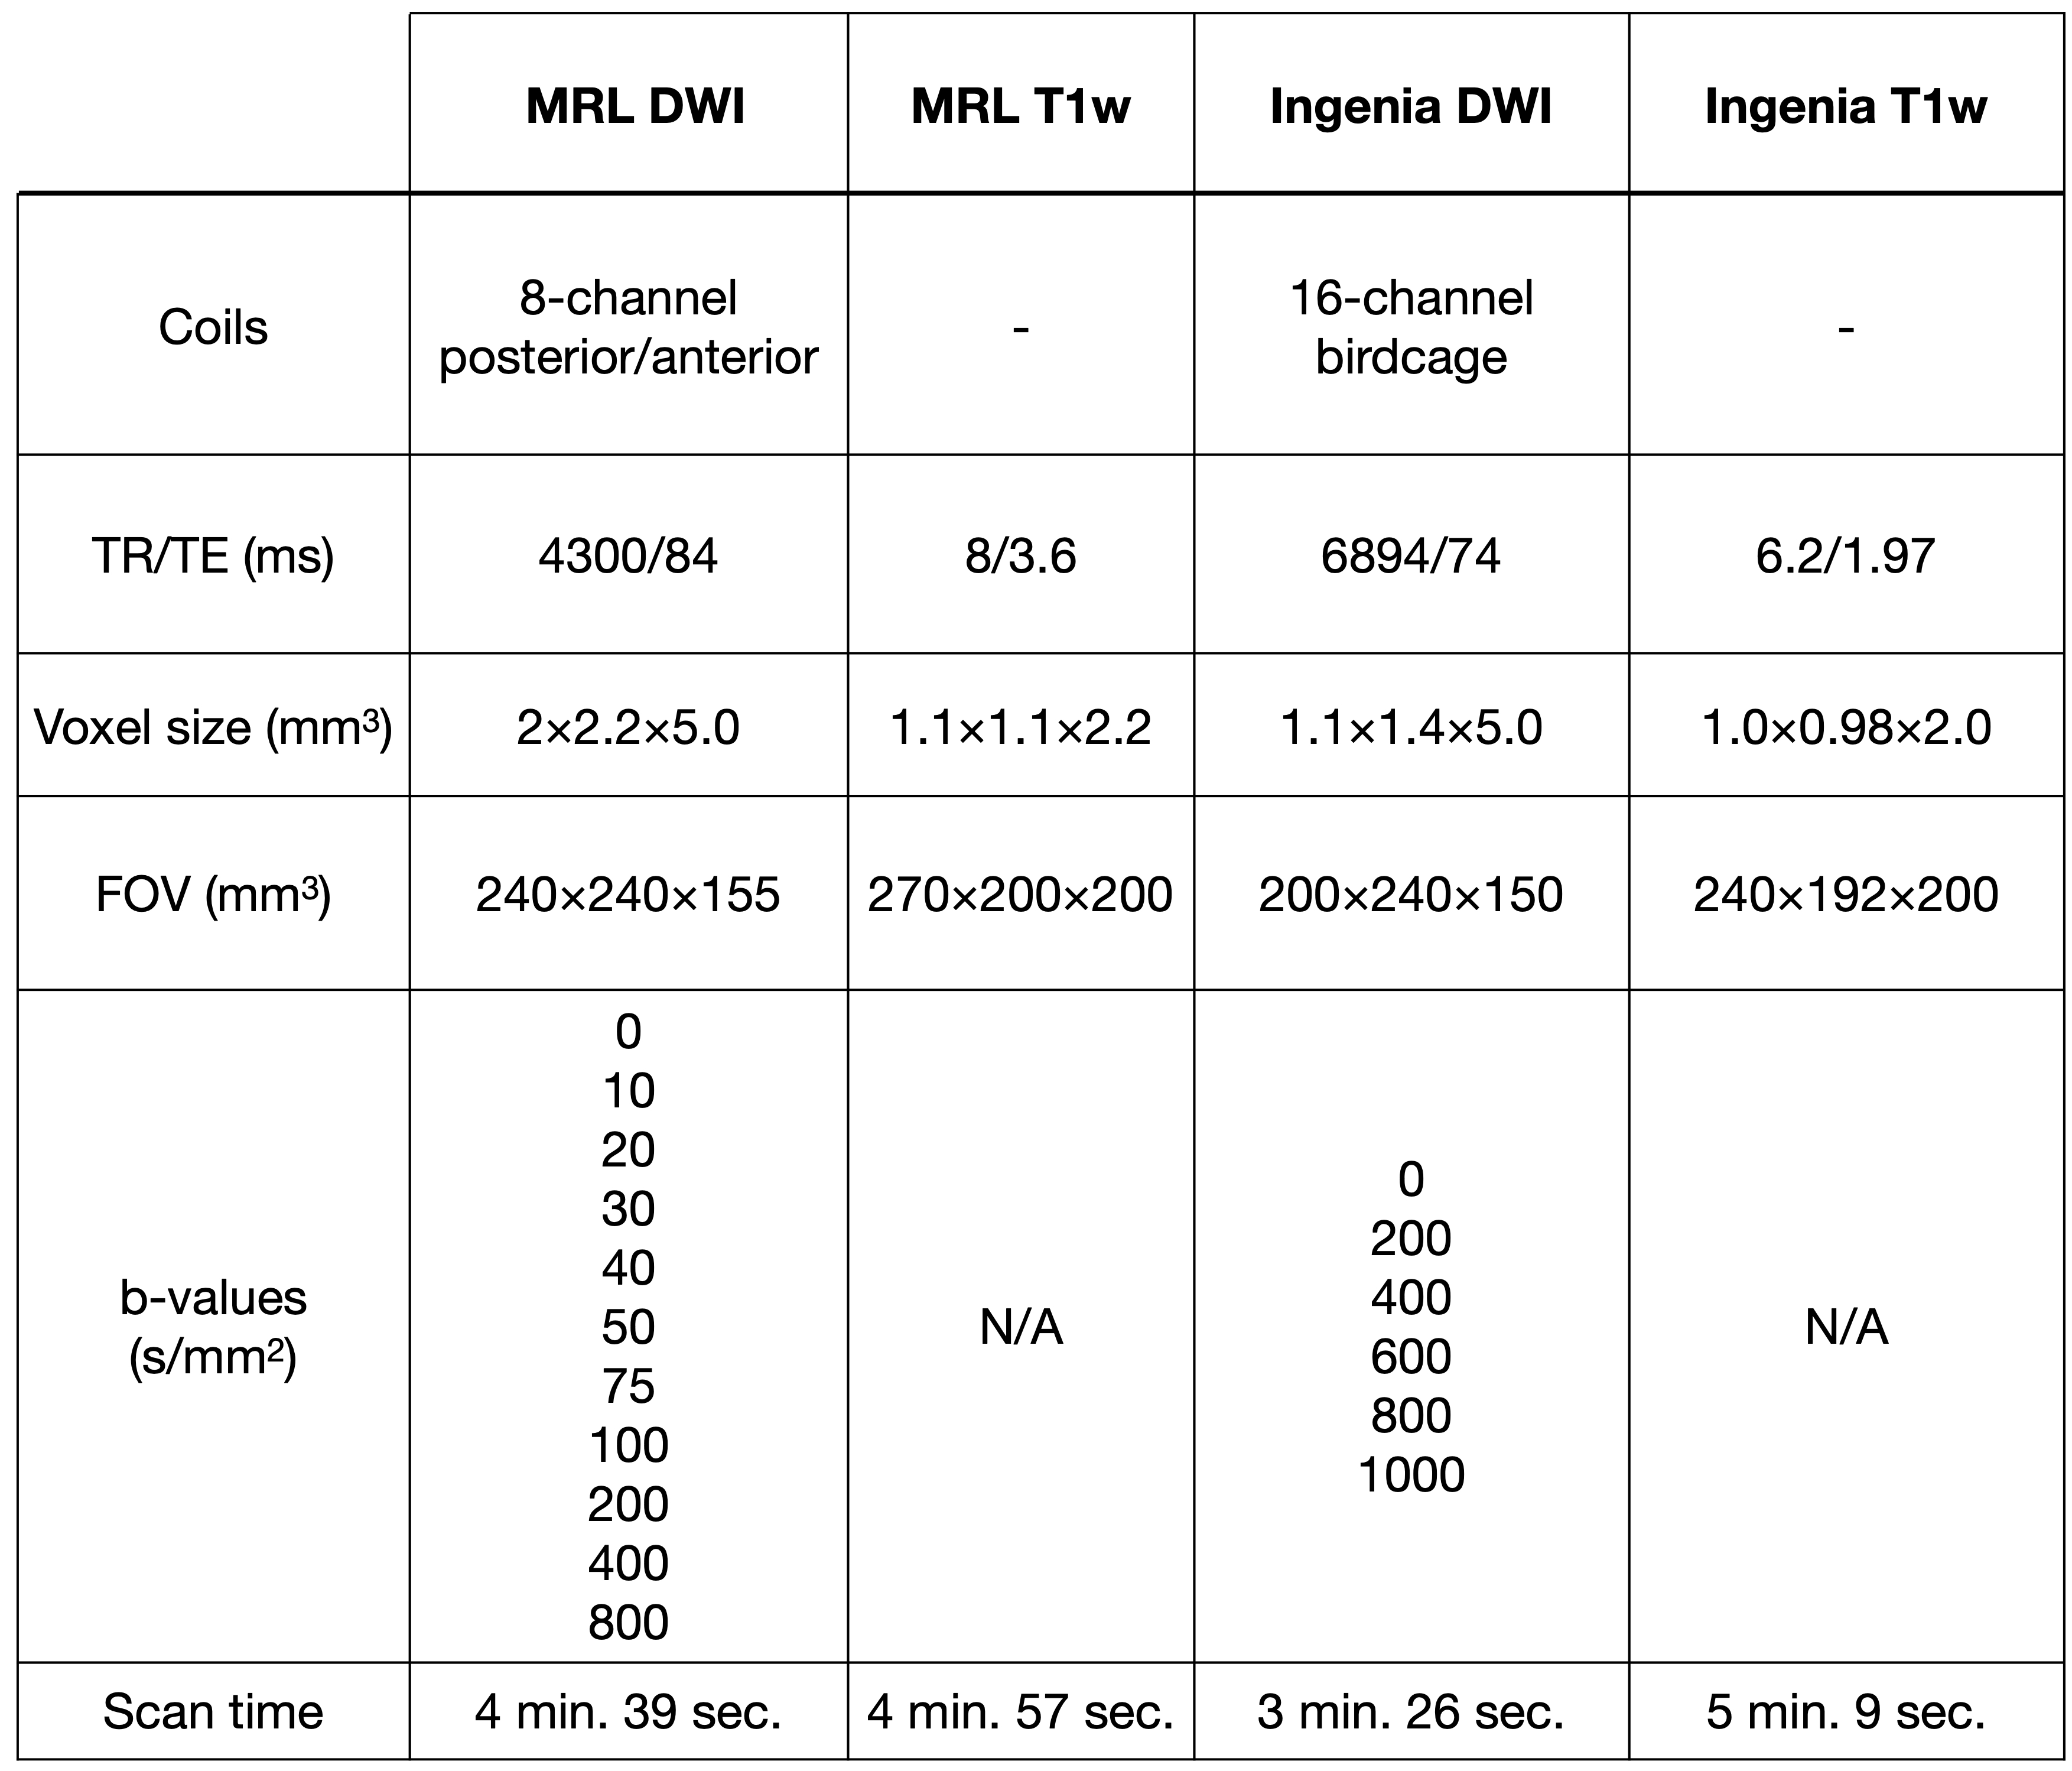
Figure 1 - MRL and Ingenia scan protocols: The acquisition parameters for the MRL and Ingenia DWI and T1w scans are shown.
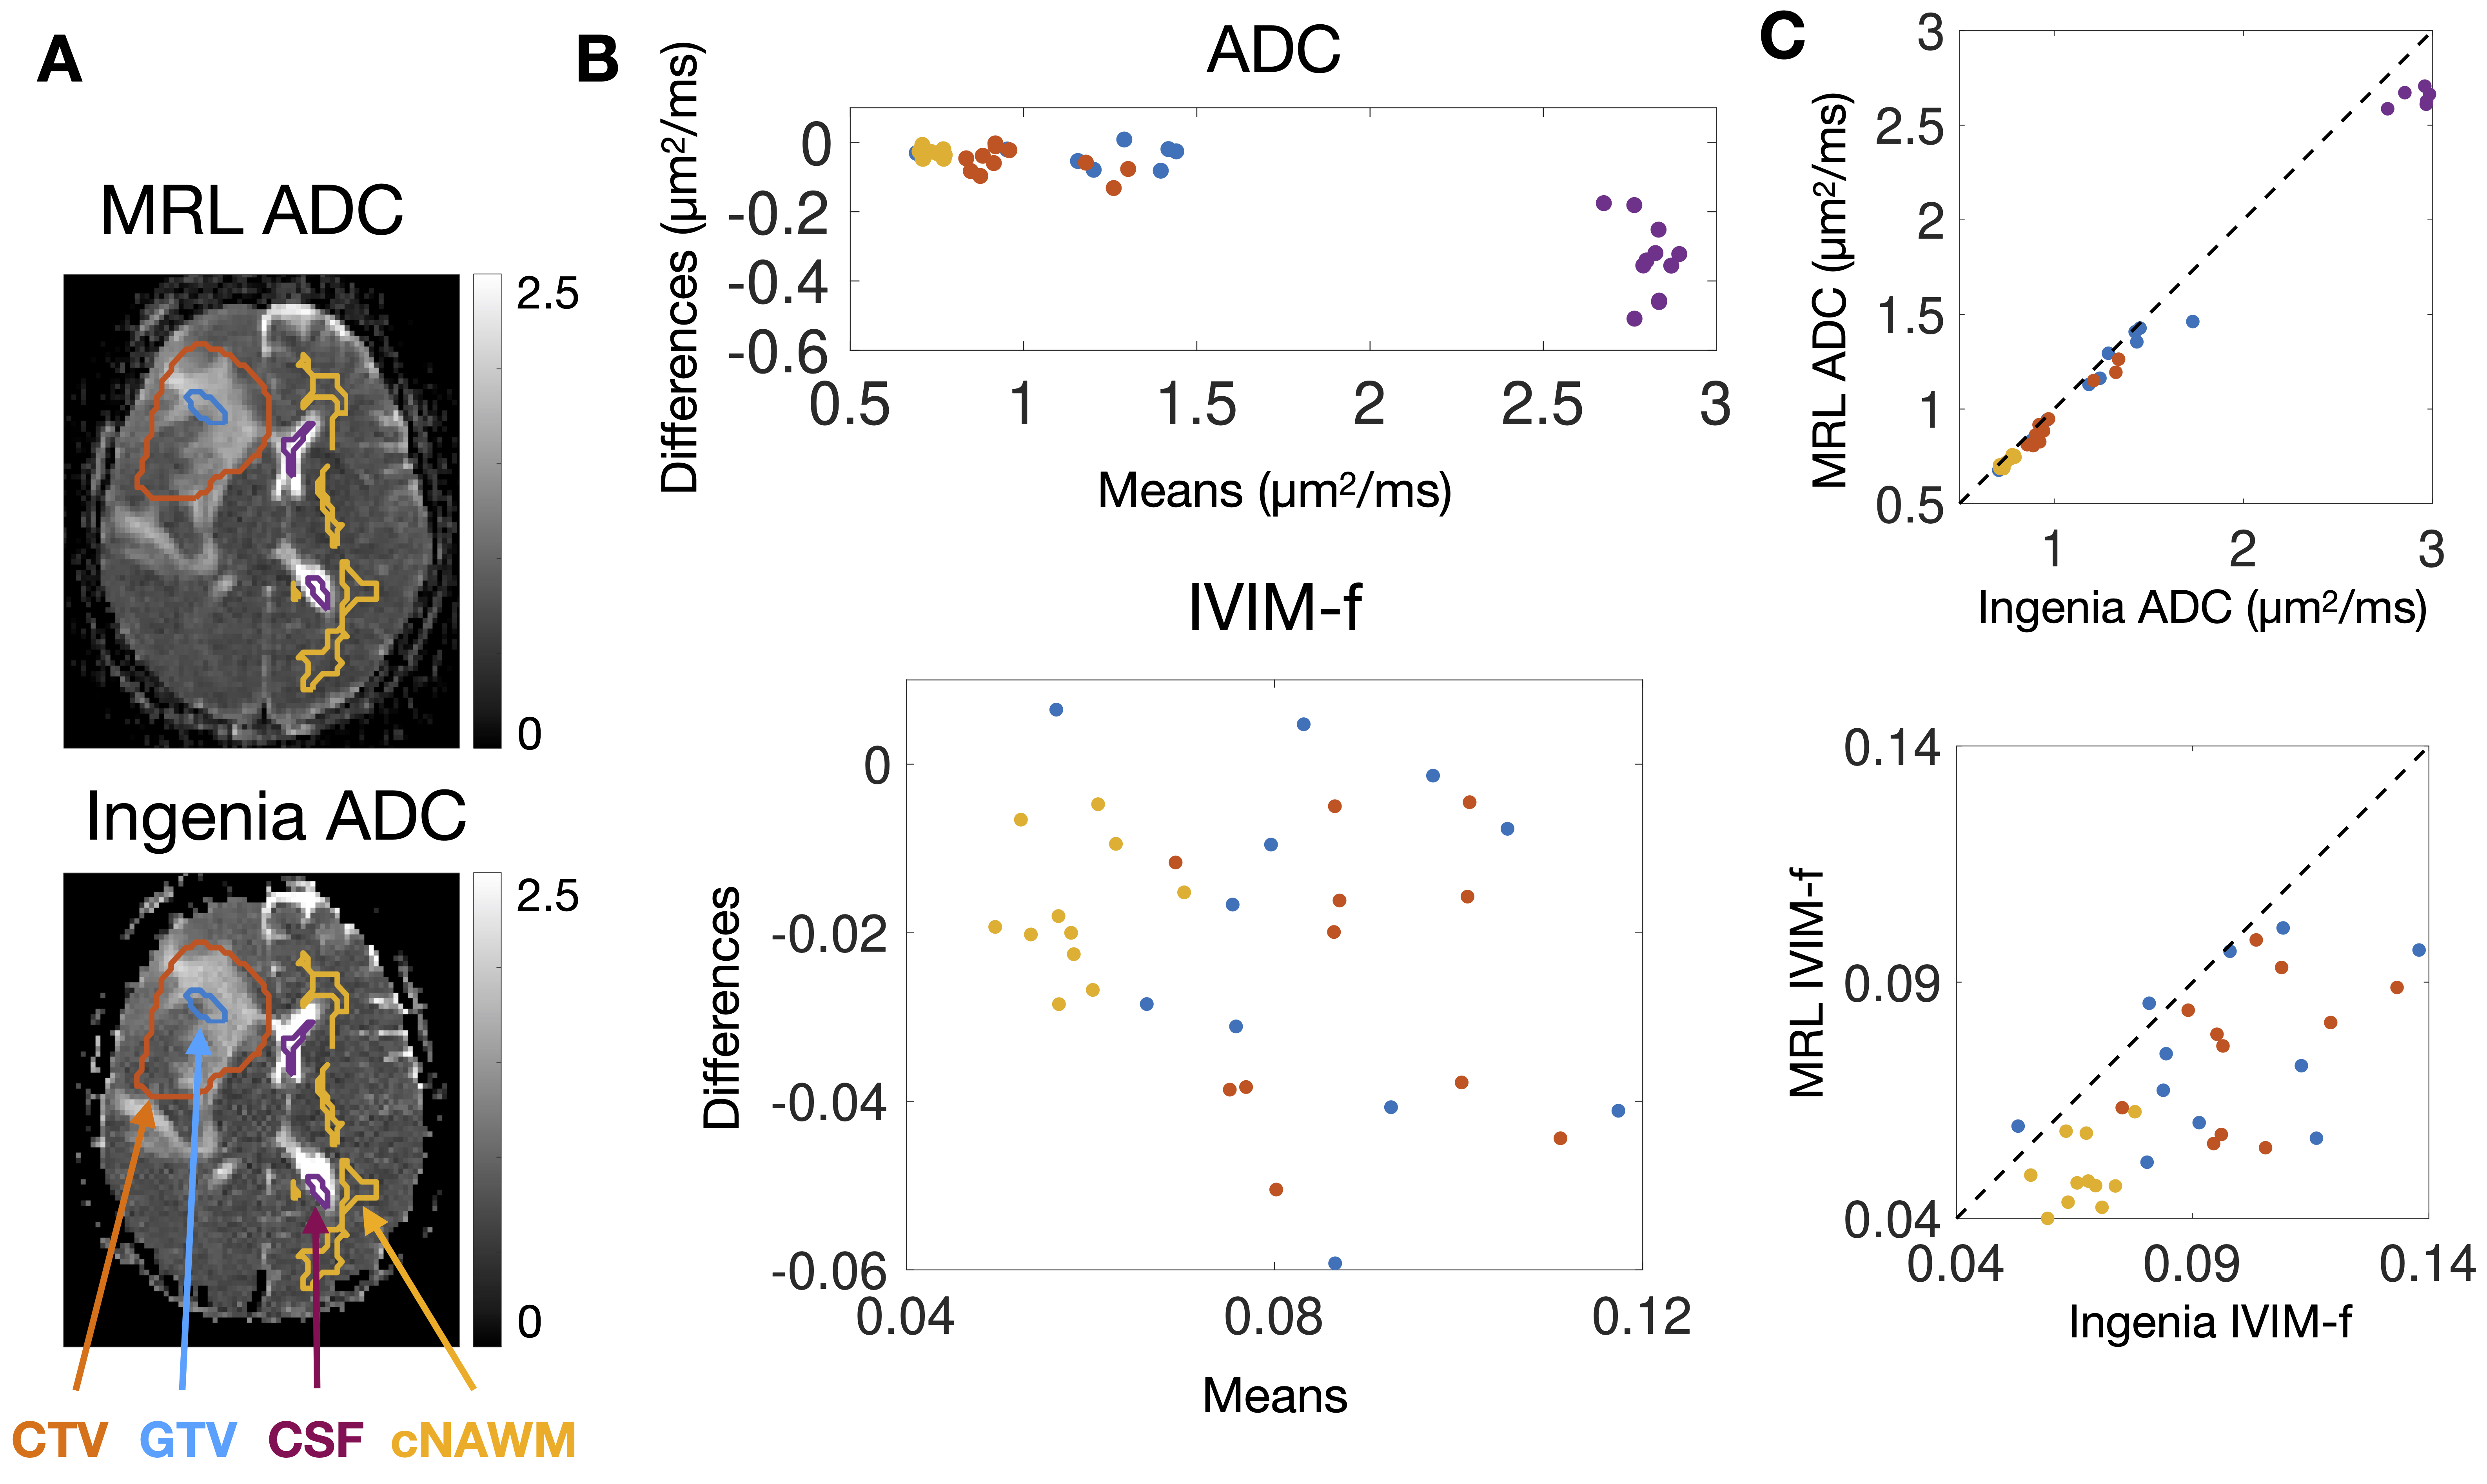
Figure 2 – Bland-Altman plots of median ADC and IVIM-f measured on the MRL versus the Ingenia: (A) shows ADC maps from the MRL and the Ingenia from the same patient on the same day. The contours are the GTV (blue), CTV (orange), cNAWM (yellow), and CSF (purple). Bland-Altman plots of the ADC and IVIM-f are shown in (B), with points coloured by ROI. (C) shows plots of Ingenia versus MRL ADC and IVIM-f.
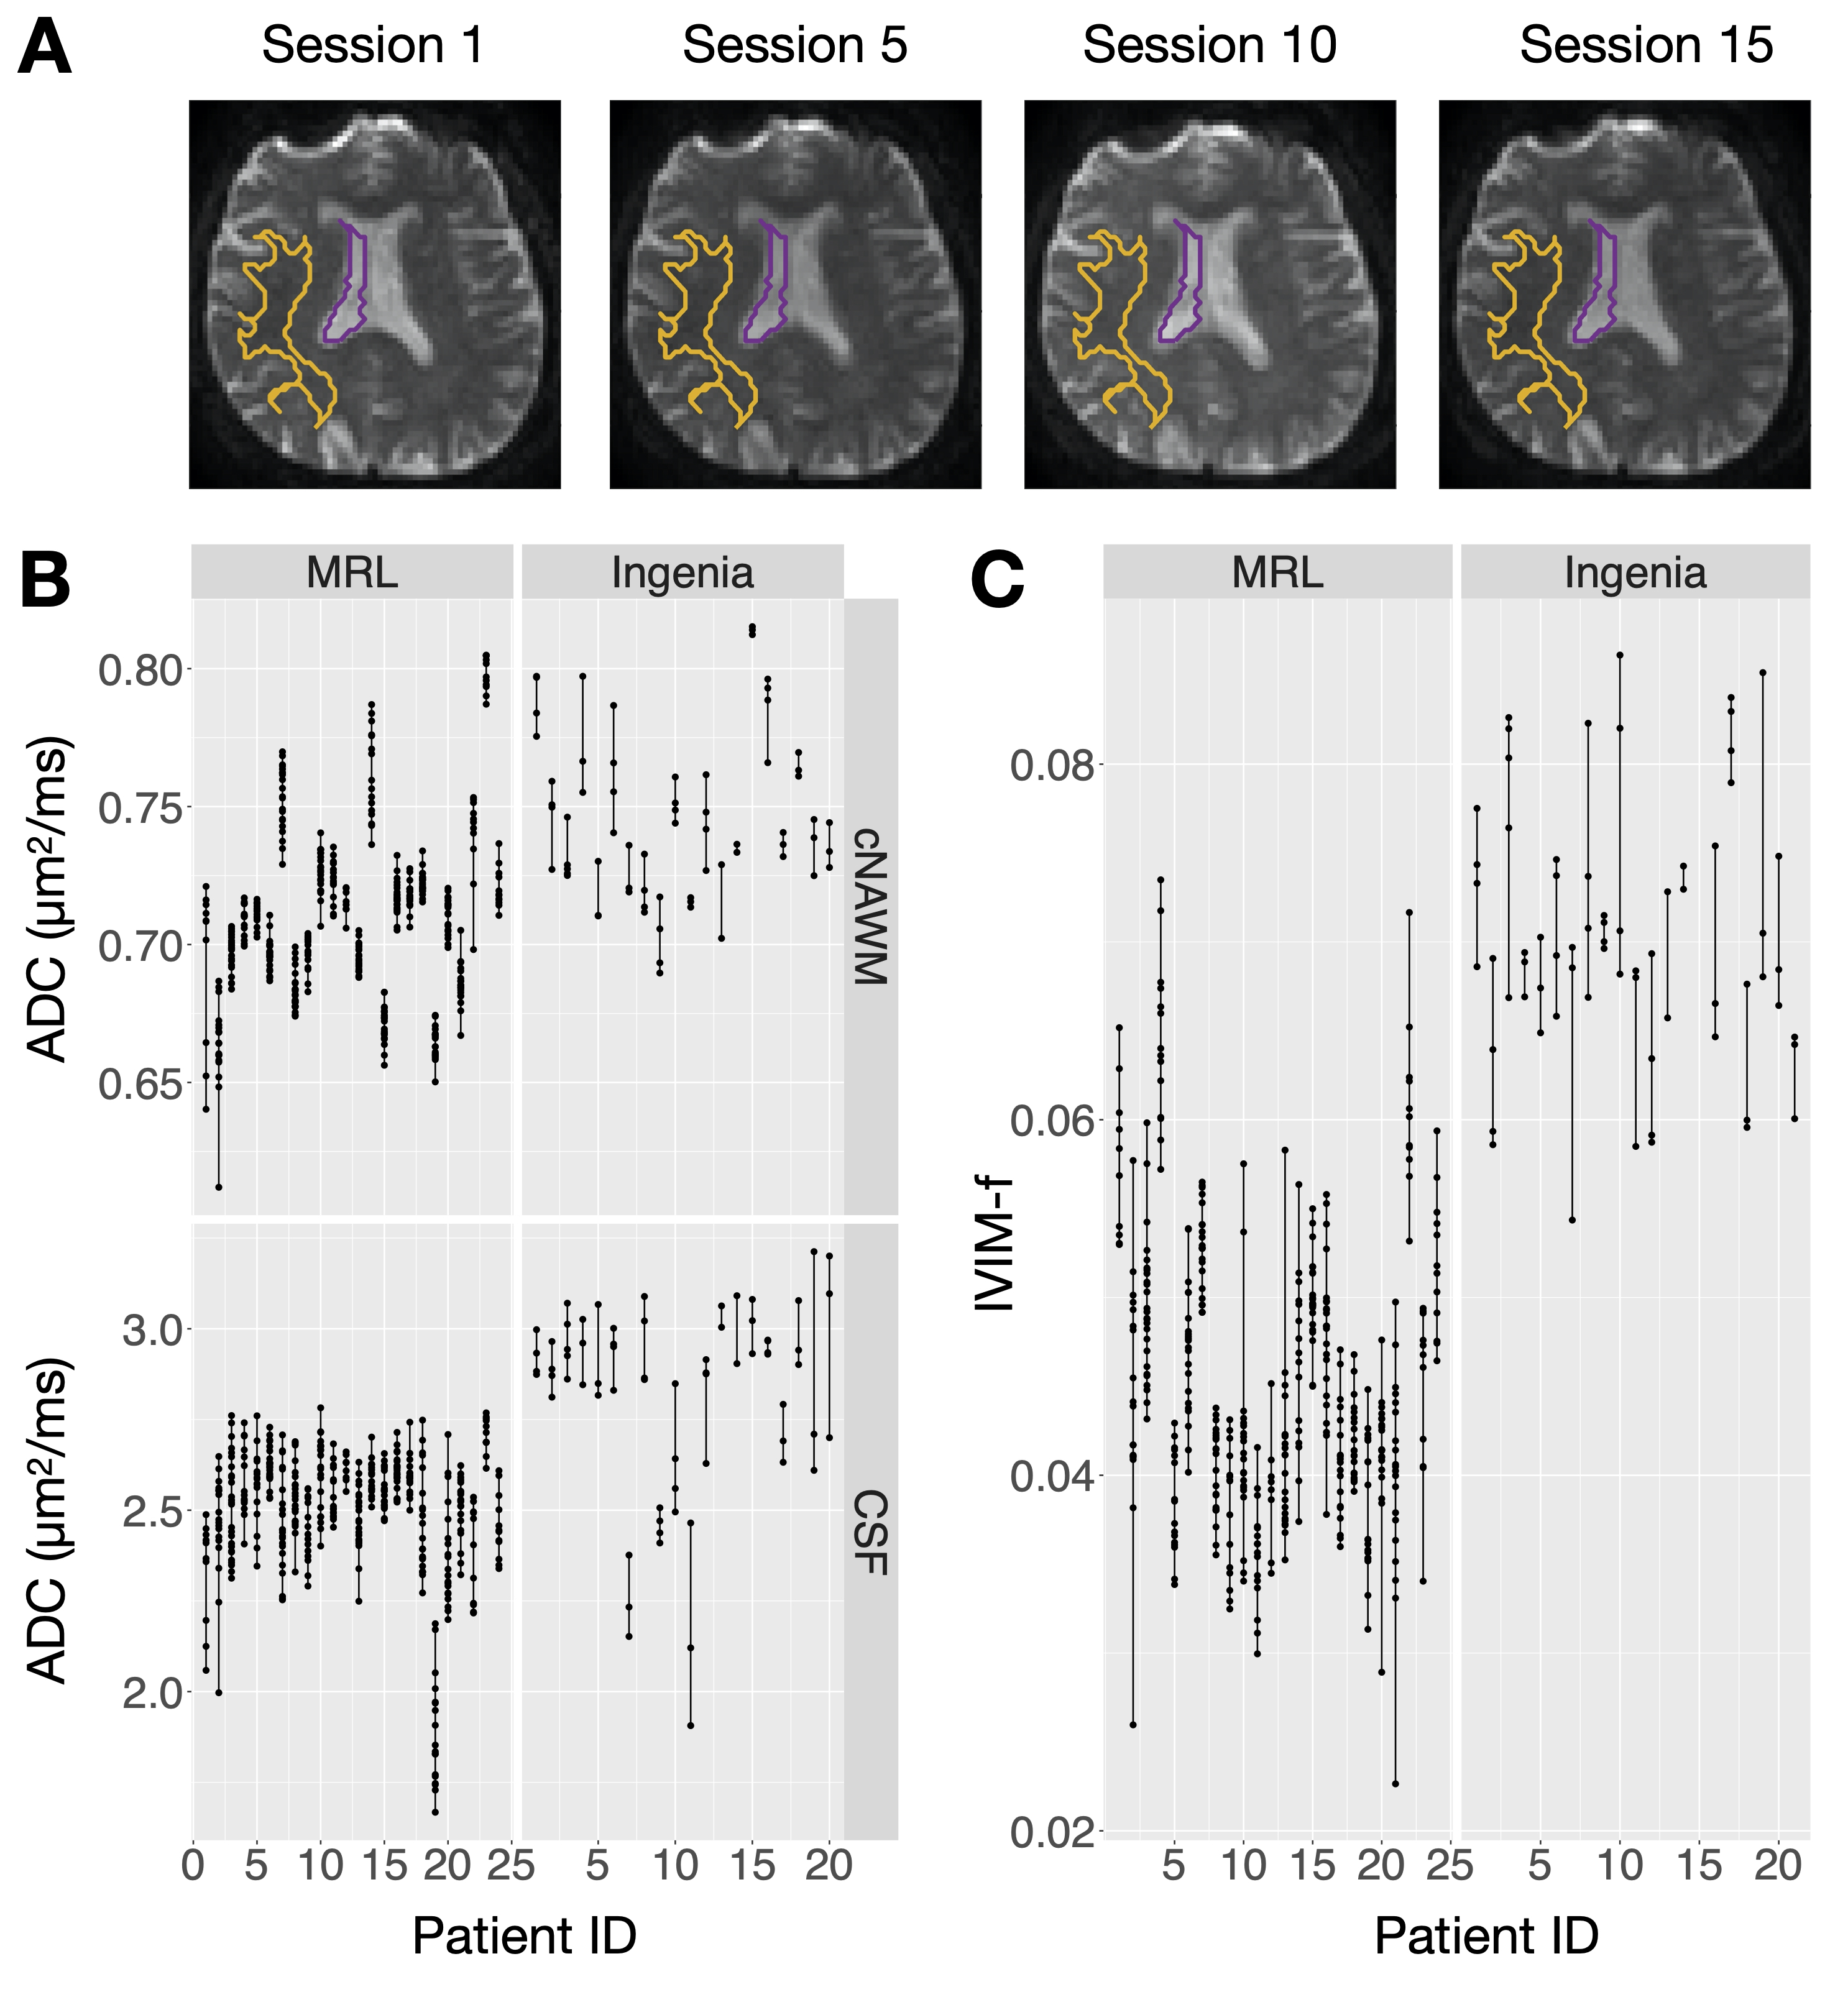
Figure 3 - Repeated measurements of ADC on the MRL and the Ingenia: (A) shows DWI(b=0) scans of the same subject taken over several sessions on the MRL. The cNAWM and CSF ROIs are shown in yellow and purple. (B) and (C) show the repeated measurements used to compute the repeatability metrics. Each dot corresponds to one scan session; the vertical lines link the repeated scans for each patient.
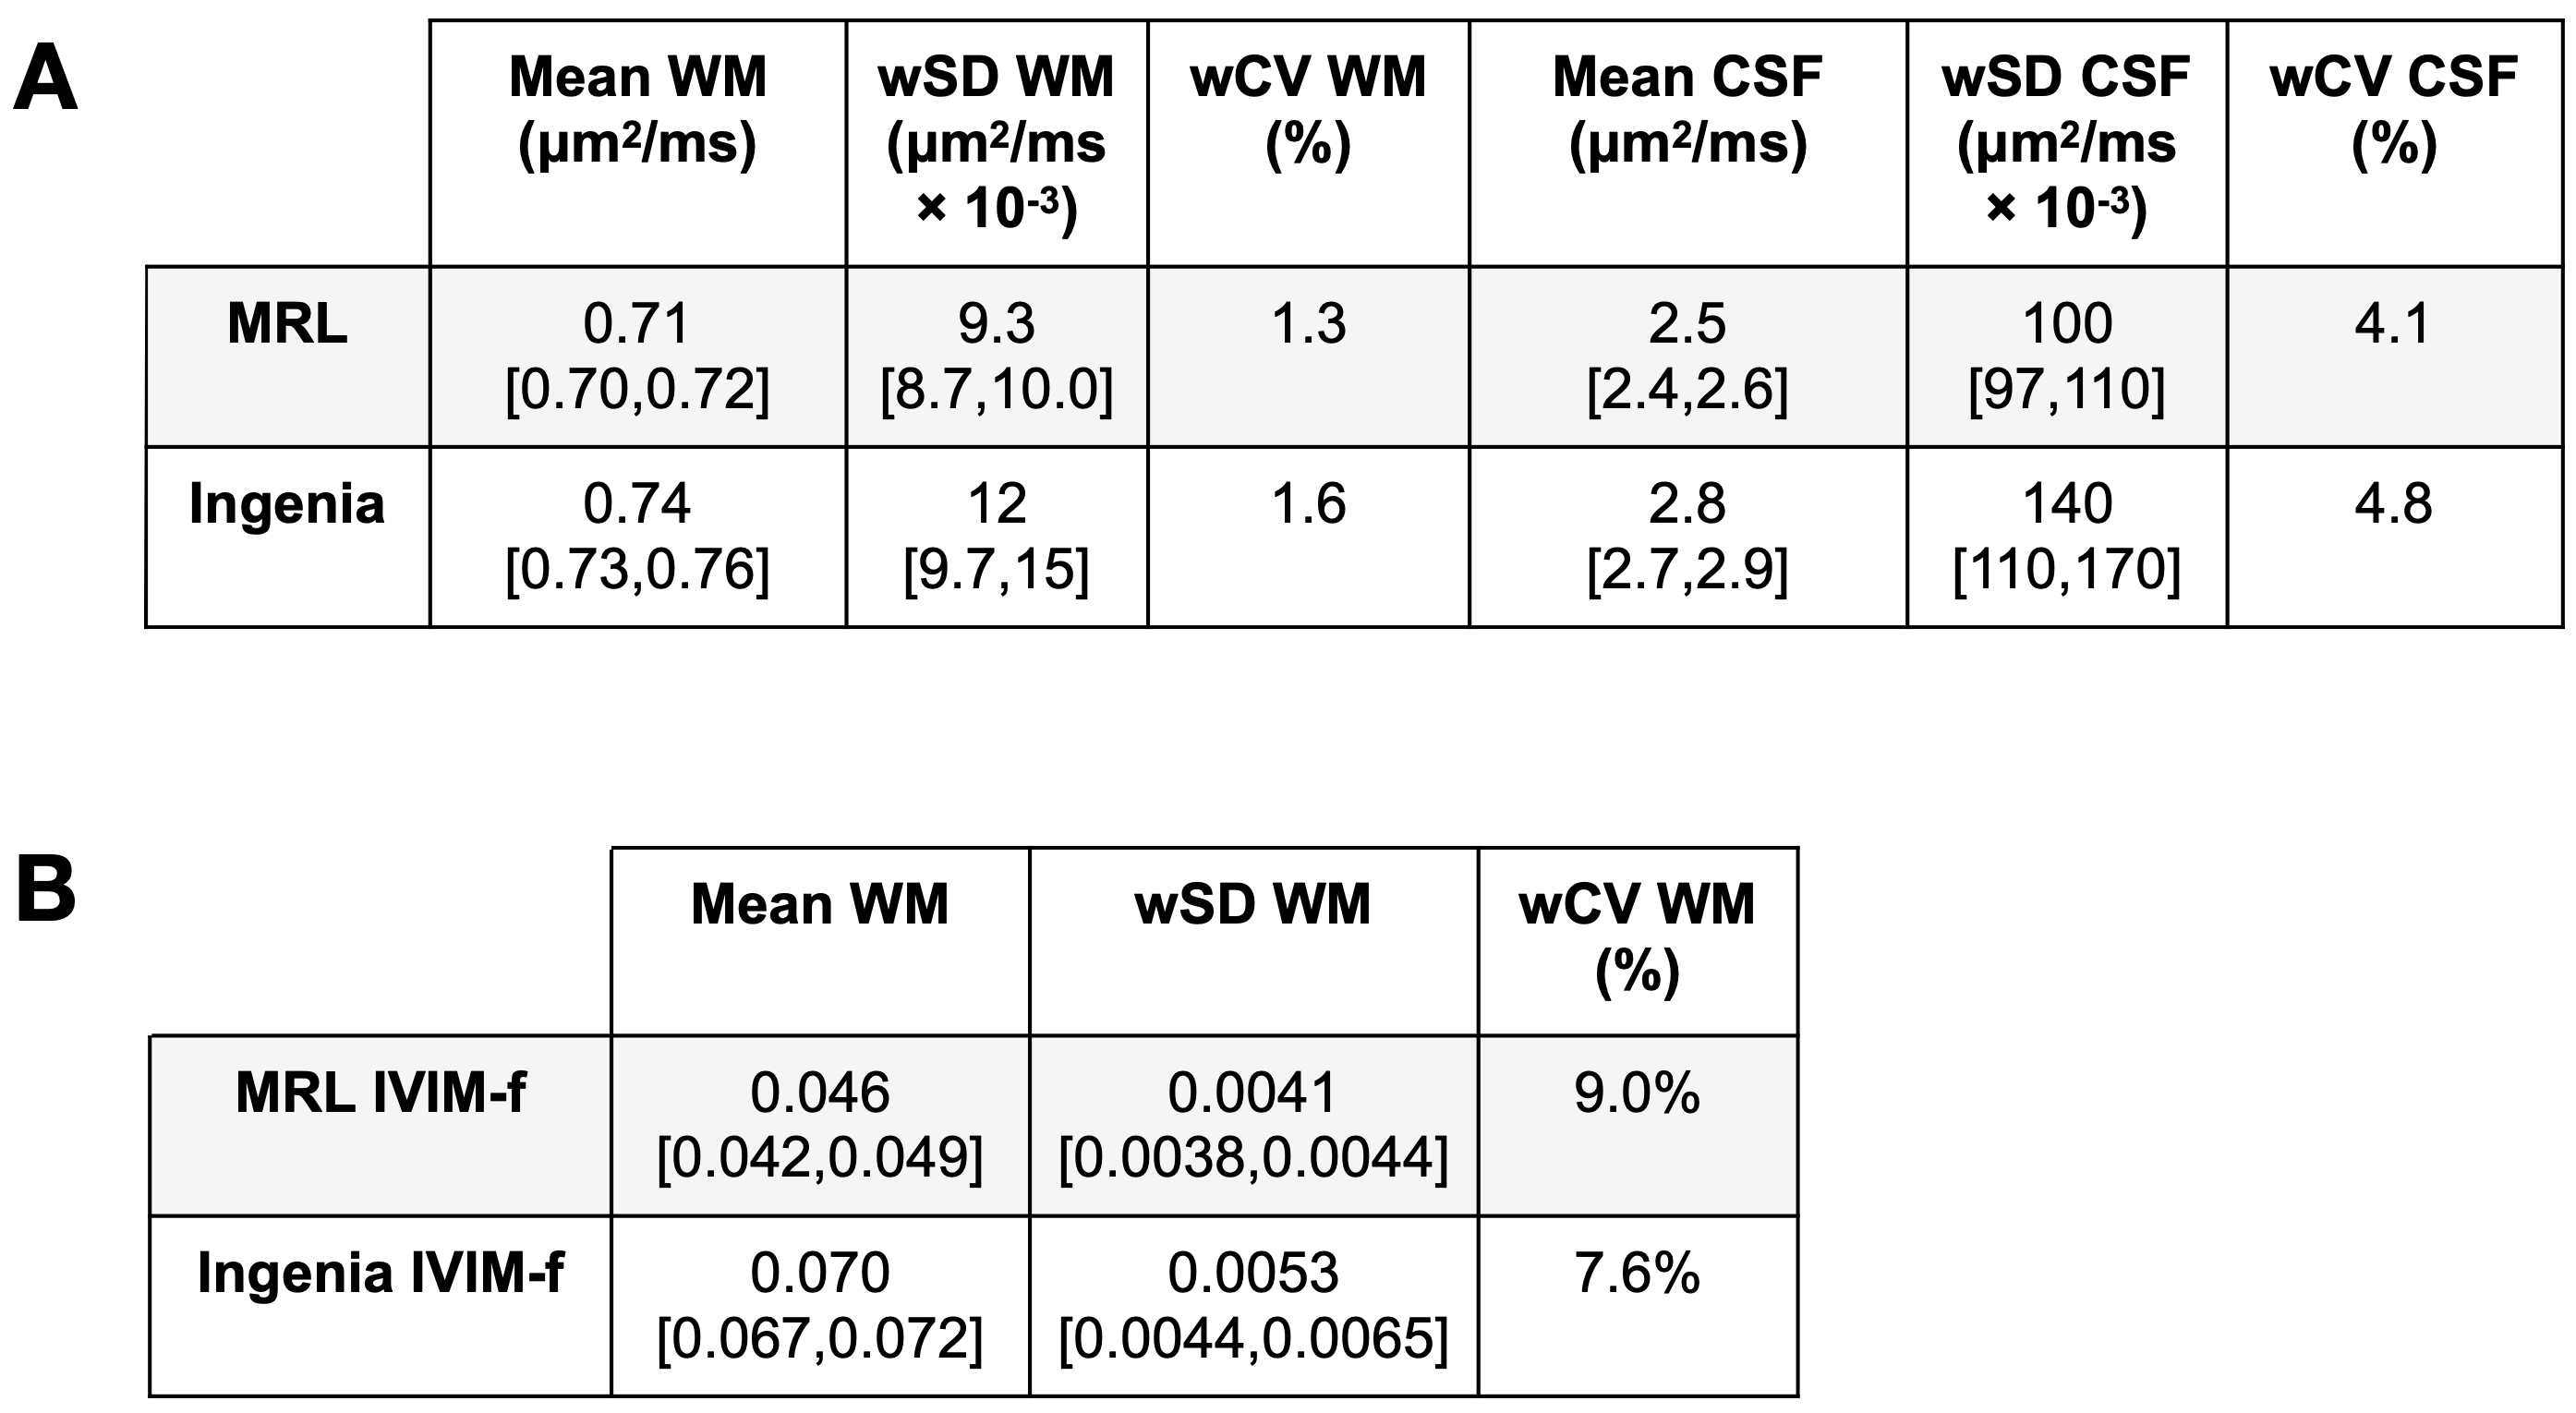
Figure 4 - Repeatability metric tables: (A) and (B) show the repeatability metrics for ADC and IVIM-f measurements on the MRL and the Ingenia. The estimate for each parameter is shown, with the 95% confidence interval in brackets where appropriate.
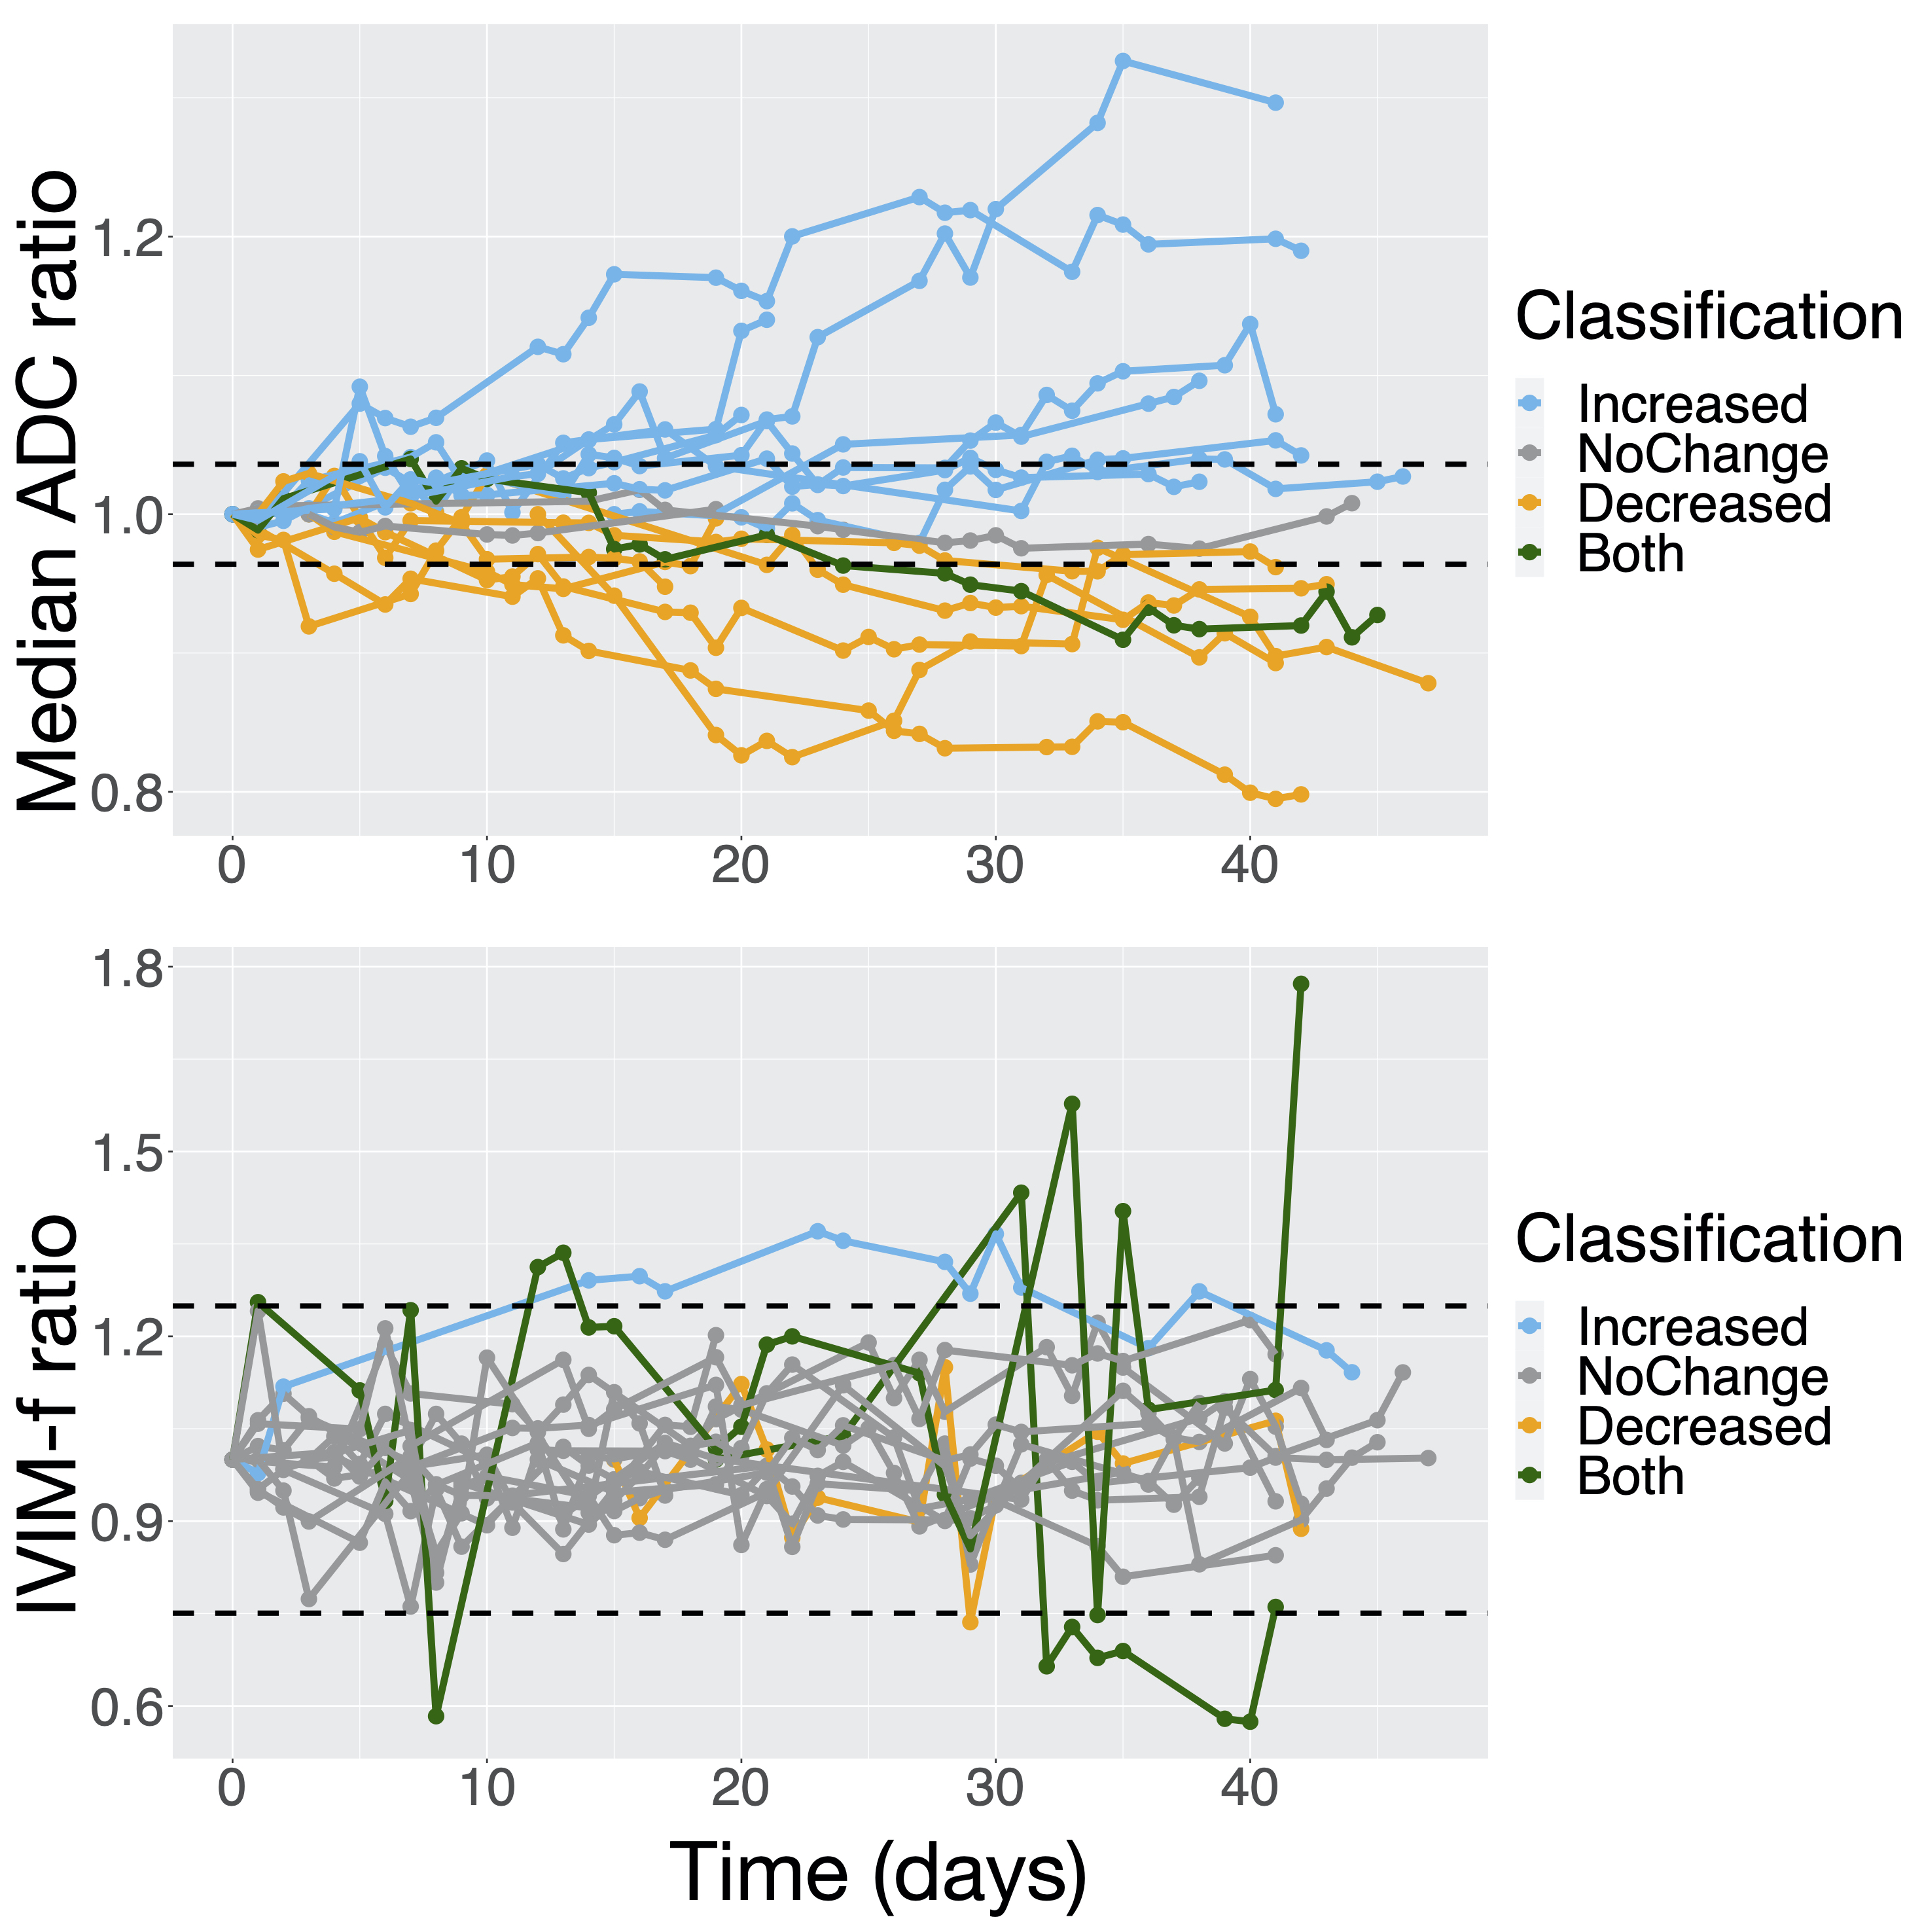
Figure 5 – ADC and IVIM-f measurements in the GTV during radiotherapy: (A) and (B) show the median ADC and IVIM-f ratio (value at a session normalized by baseline value) over the GTV as a function of time from the first fraction. The thresholds for statistically significant change (100% ± $$$\text{%RC}$$$) are shown as dashed lines: the classification is based on whether a change was detected at any session.