1713
IVIM quantification and b-value optimization using deep neural network1KAIST, Daejeon, Korea, Republic of
Synopsis
Many studies have been performed to show that IVIM could be used as a biomarker for various diseases(1-5). Since IVIM is formulated by a biexponential model, it is difficult to quantify the IVIM parameters. Researchers have tried to solve the inverse problems of the biexponential model using two approaches:improving fitting method and selecting optimized b-values(6-8). The trained DNN and the optimized b-values by the proposed method quantified IVIM parameters more accurately than combination of the conventional b-value optimization schemes with DNN fitting method. The optimized b-values by the proposed method showed superior performance even when combined with other fitting methods.
Purpose
Although lots of studies on IVIM have been conducted on various organs and various diseases, researches on how to select the optimal b-values is still ongoing. In this study, we introduce a deep neural network method to optimize b-values and train a deep neural network simultaneously for quantification of IVIM parameters.Methods
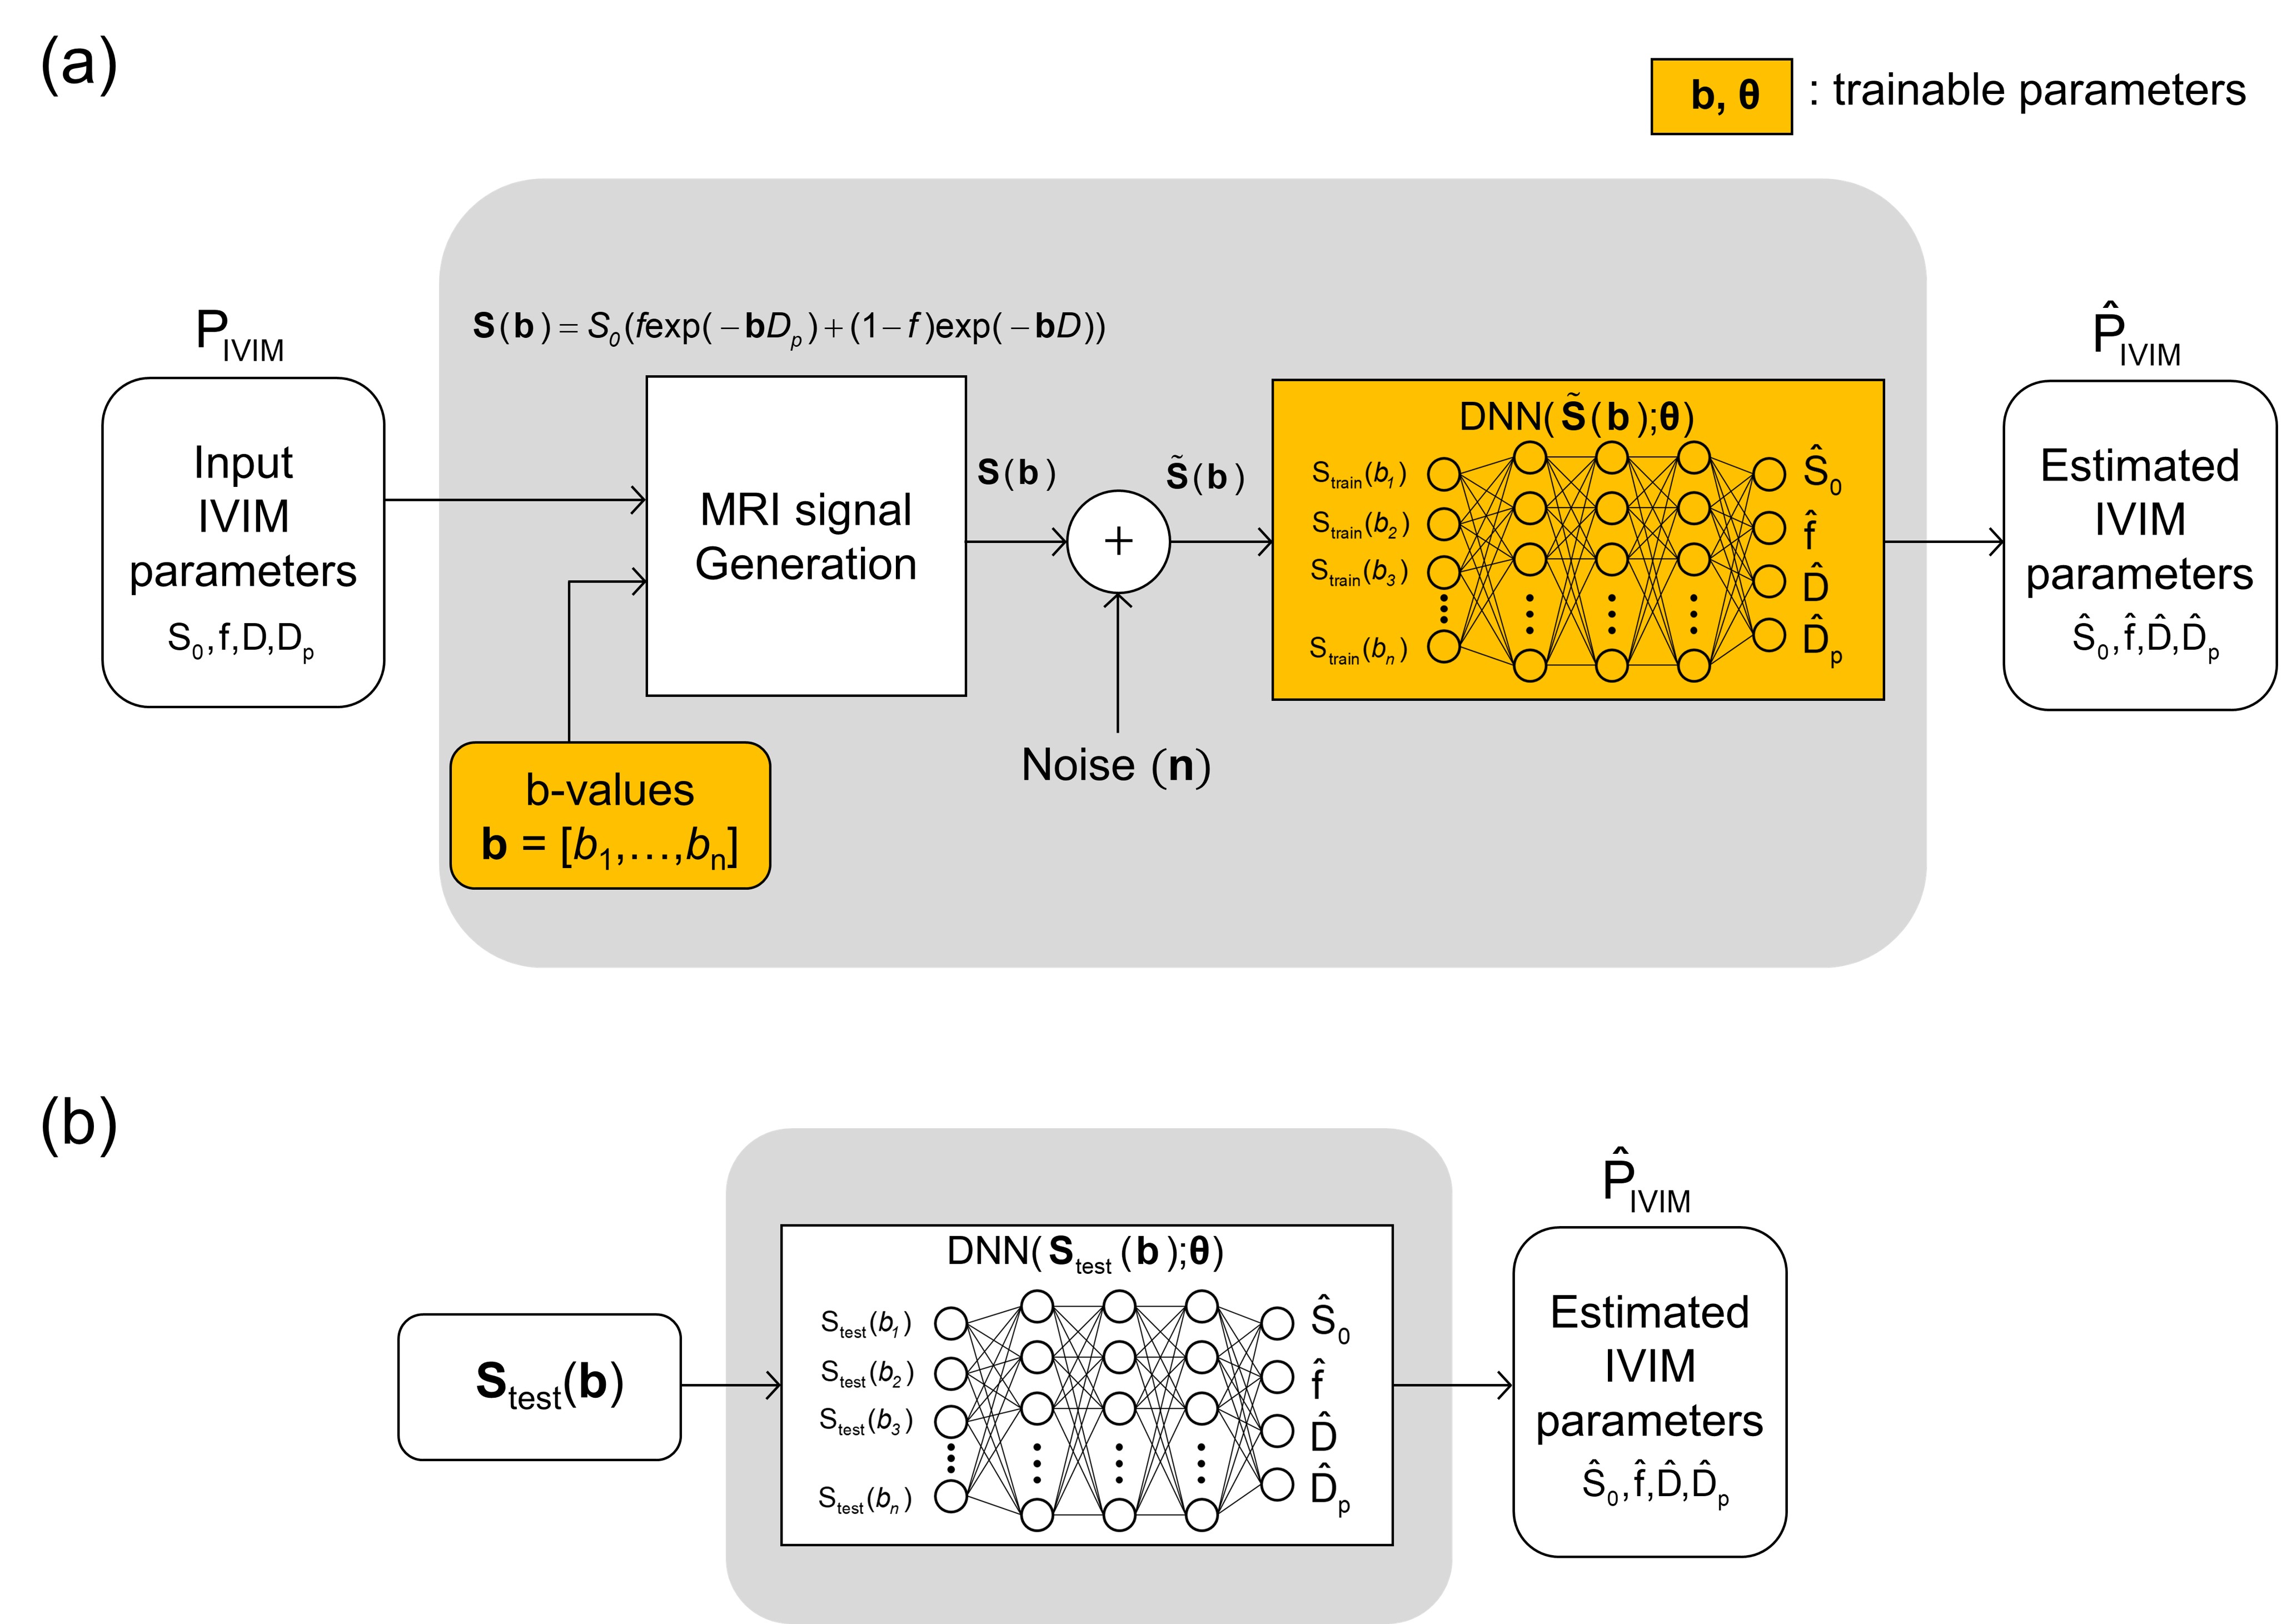
Figure 1 shows the overall framework of the proposed method. The proposed method consists of an MRI signal generation part and an IVIM parameter quantification part. Figure 1(a) shows the training phase and Figure 1(b) shows the test phase. In the training phase, MRI signals are formulated by the biexponential model of IVIM using b-values and IVIM parameters. The biexponential model of IVIM is described as follows.$$S(b_i)=S_0\cdot(f\cdot exp(-bD_p)+(1-f)\cdot exp(-b_i D))$$
where $$$S(b_i)$$$ is the diffusion-weighted MRI signal for the b-value of $$$b_i$$$, $$$S_0$$$ is the MRI signal when the b-value is zero, $$$f$$$ is the perfusion fraction, $$$D_p$$$ is the perfusion coefficient, and $$$D$$$ is the diffusion coefficient.
Rician noise is added to the generated diffusion-weighted MRI signals as follows.
$$\tilde{S}(b_i) = \sqrt{(S(b_i)+n_1(b_i))^2 +n_2(b_i)^2}$$
where $$$n_1(b_i)$$$ and $$$n_2(b_i)$$$ are the two independent Gaussian noise components. The deep neural network estimates IVIM parameters from the noise-corrupted MRI signals. The b-values ($$$b_i$$$) and the network parameters ($$$\theta_j$$$) in the proposed method are optimized simultaneously using the derivatives of the loss function ($$$\frac{\partial L}{\partial b_i}$$$, $$$\frac{\partial L}{\partial \theta_j}$$$), where L is the loss function defined by the sum of the mean squared errors between the estimates and the ground truth.
Comparison methods
Since the proposed method performs two different tasks, training of deep neural network and optimizing b-values, we compared the proposed method with combinations of conventional fitting methods and conventional b-value selection methods.We compared the proposed method with two conventional b-value optimization schemes (Jalnefjord’s method(6) and Zhang’s method(7)) and the uniformly sampling scheme. Jalnefjord’s b-value optimization scheme focused on the simplified IVIM model as follows.
$$S(b_i)=S_0\cdot((1-f)\cdot exp(-b_i D)+f\cdot \delta(b_i)) $$
where $$$\delta$$$ is the discrete delta function. Zhang’s b-value optimization scheme minimized the error propagation factor.
In the proposed method, the deep neural network is trained, and b-values are optimized at the same time. However, Zhang’s method, Jalnefjord’s method, and the uniformly sampling scheme do not train the network and only select the b-values. Therefore, the quantification DNN for Zhang’s method, Jalnefjord’s method, and the uniformly sampling scheme are trained separately.
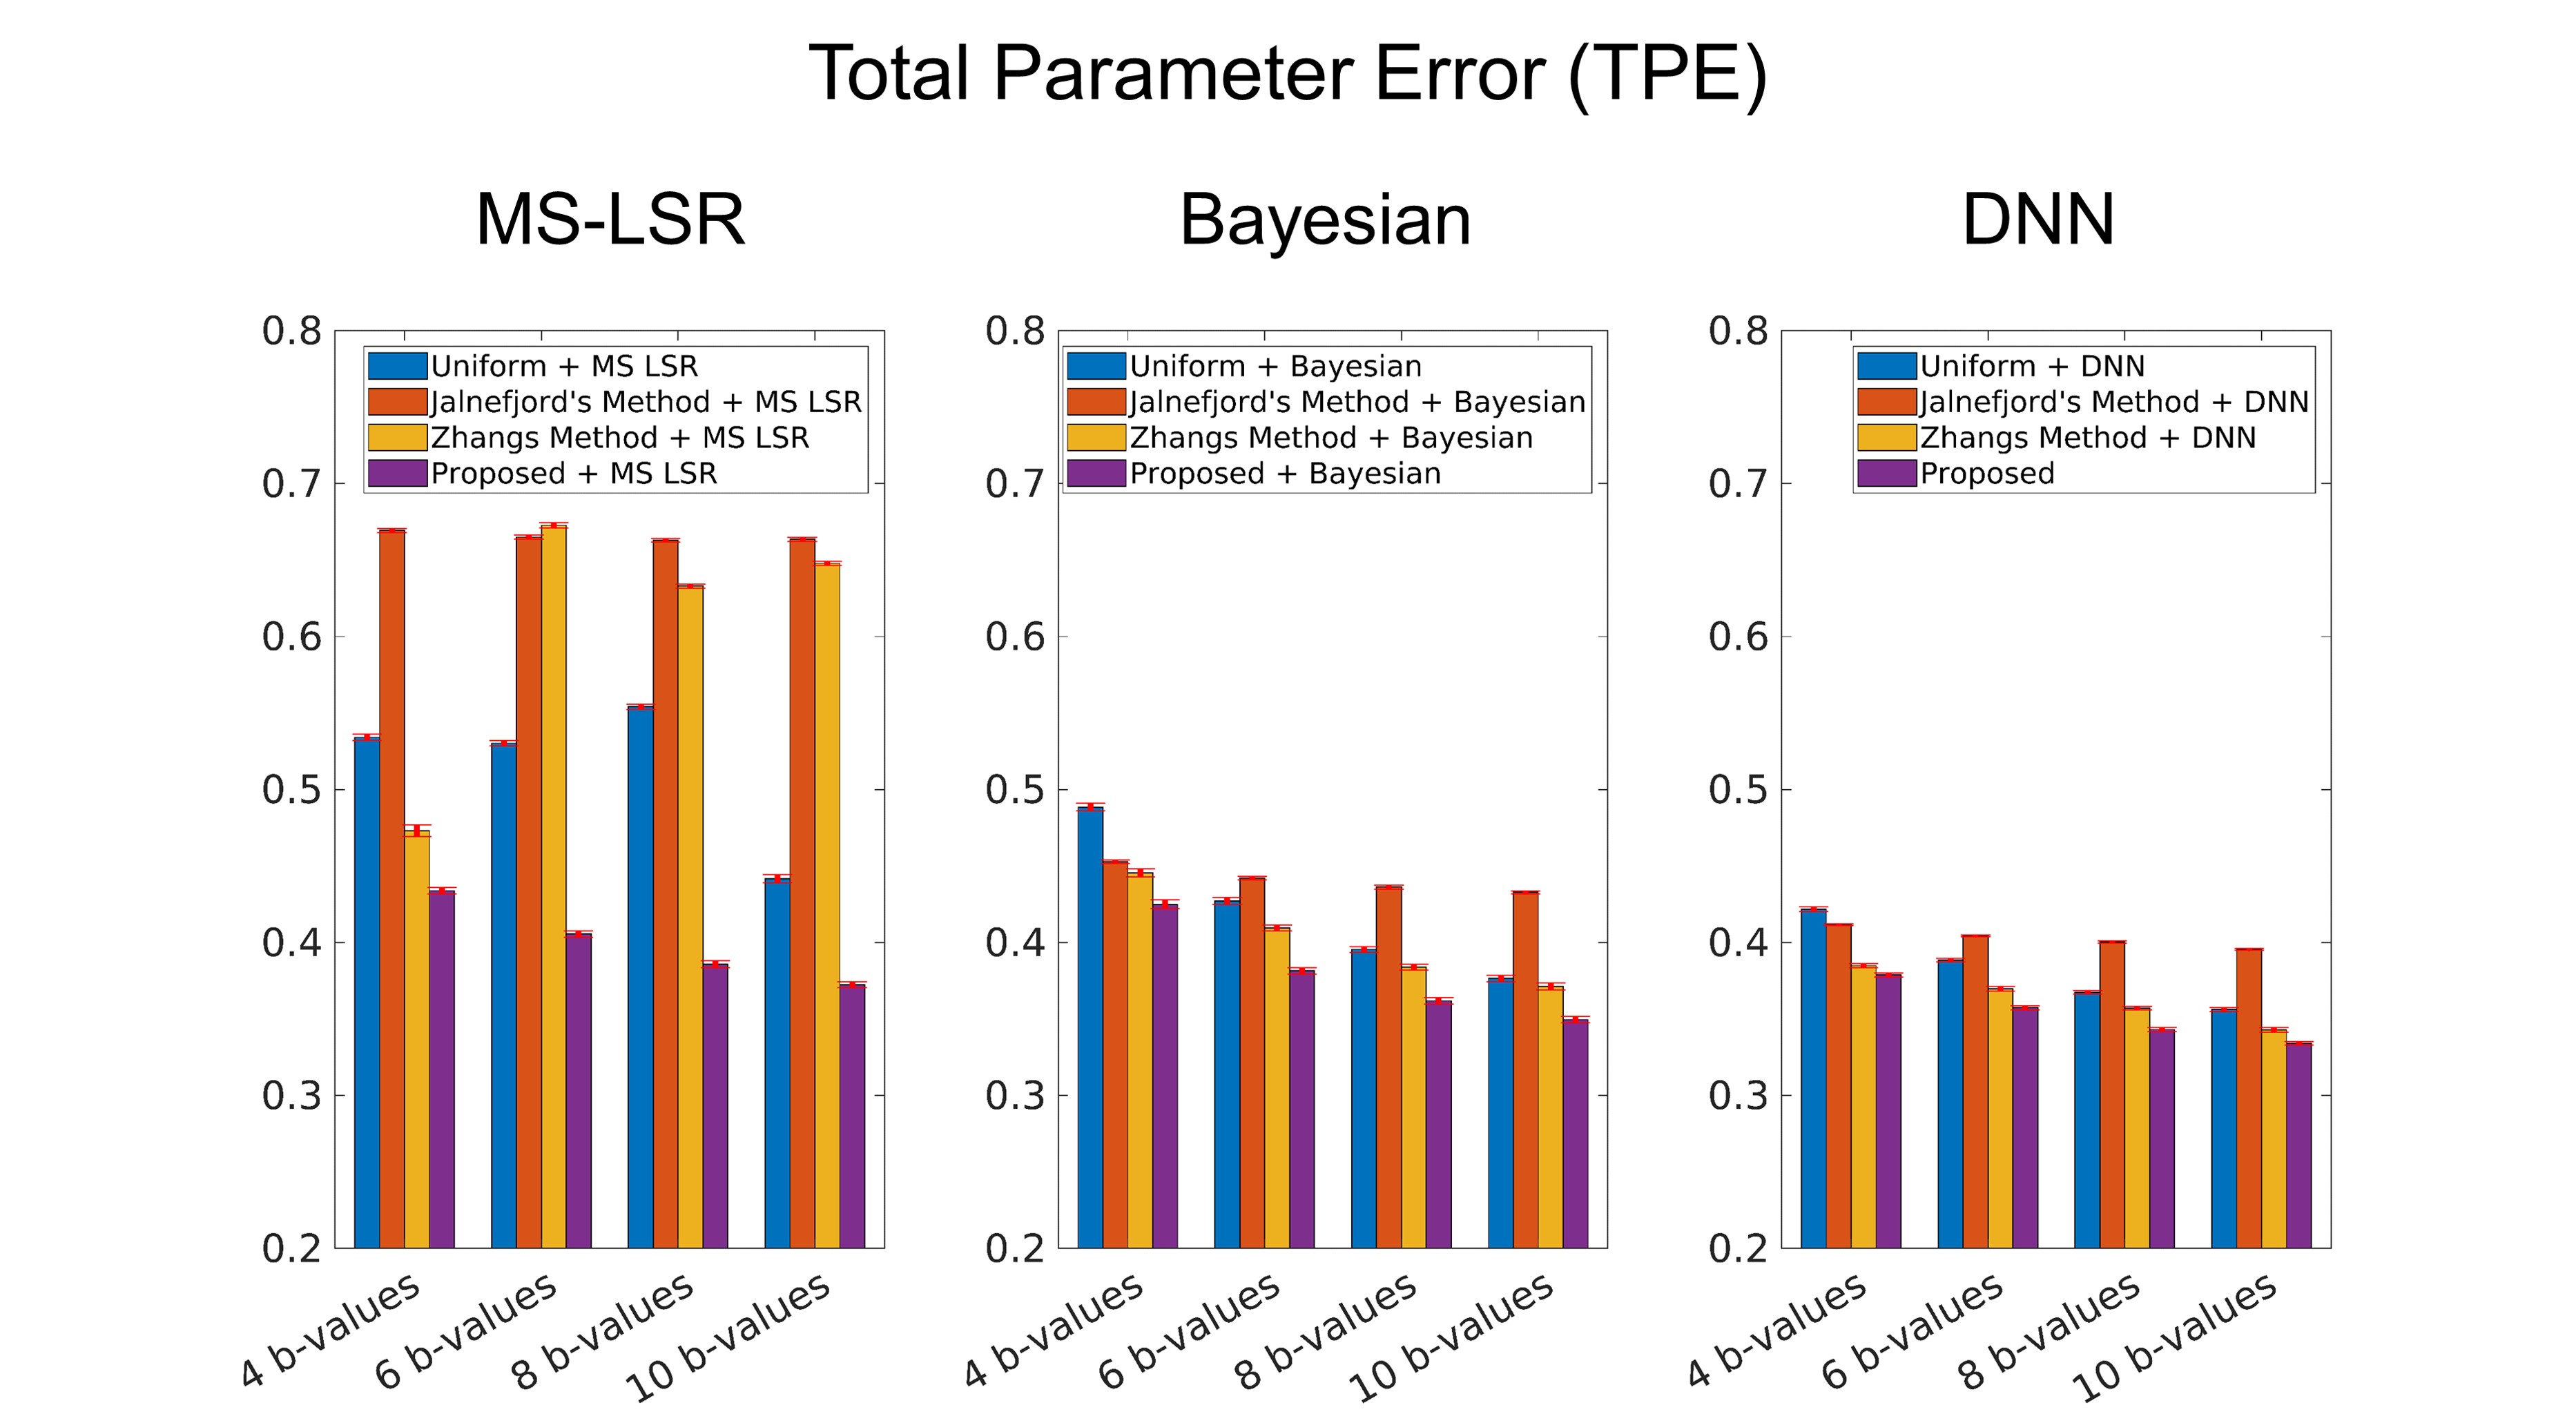
Total Parameter Error (TPE) is defined to evaluate the overall estimation performance of all three IVIM parameters, as follows,
$$ TPE = \frac{1/N\sum_{i=1}^N|f_i - \hat{f_i}|}{Range(f)}+\frac{1/N\sum_{i=1}^N|D_i - \hat{D_i}|}{Range(D)}+\frac{1/N\sum_{i=1}^N|D_{p \space i} - \hat{D_{p \space i}}|}{Range(D_{p})}$$
where $$$Range(x)$$$ denotes the range of the parameter, $$$x$$$.
Simulation
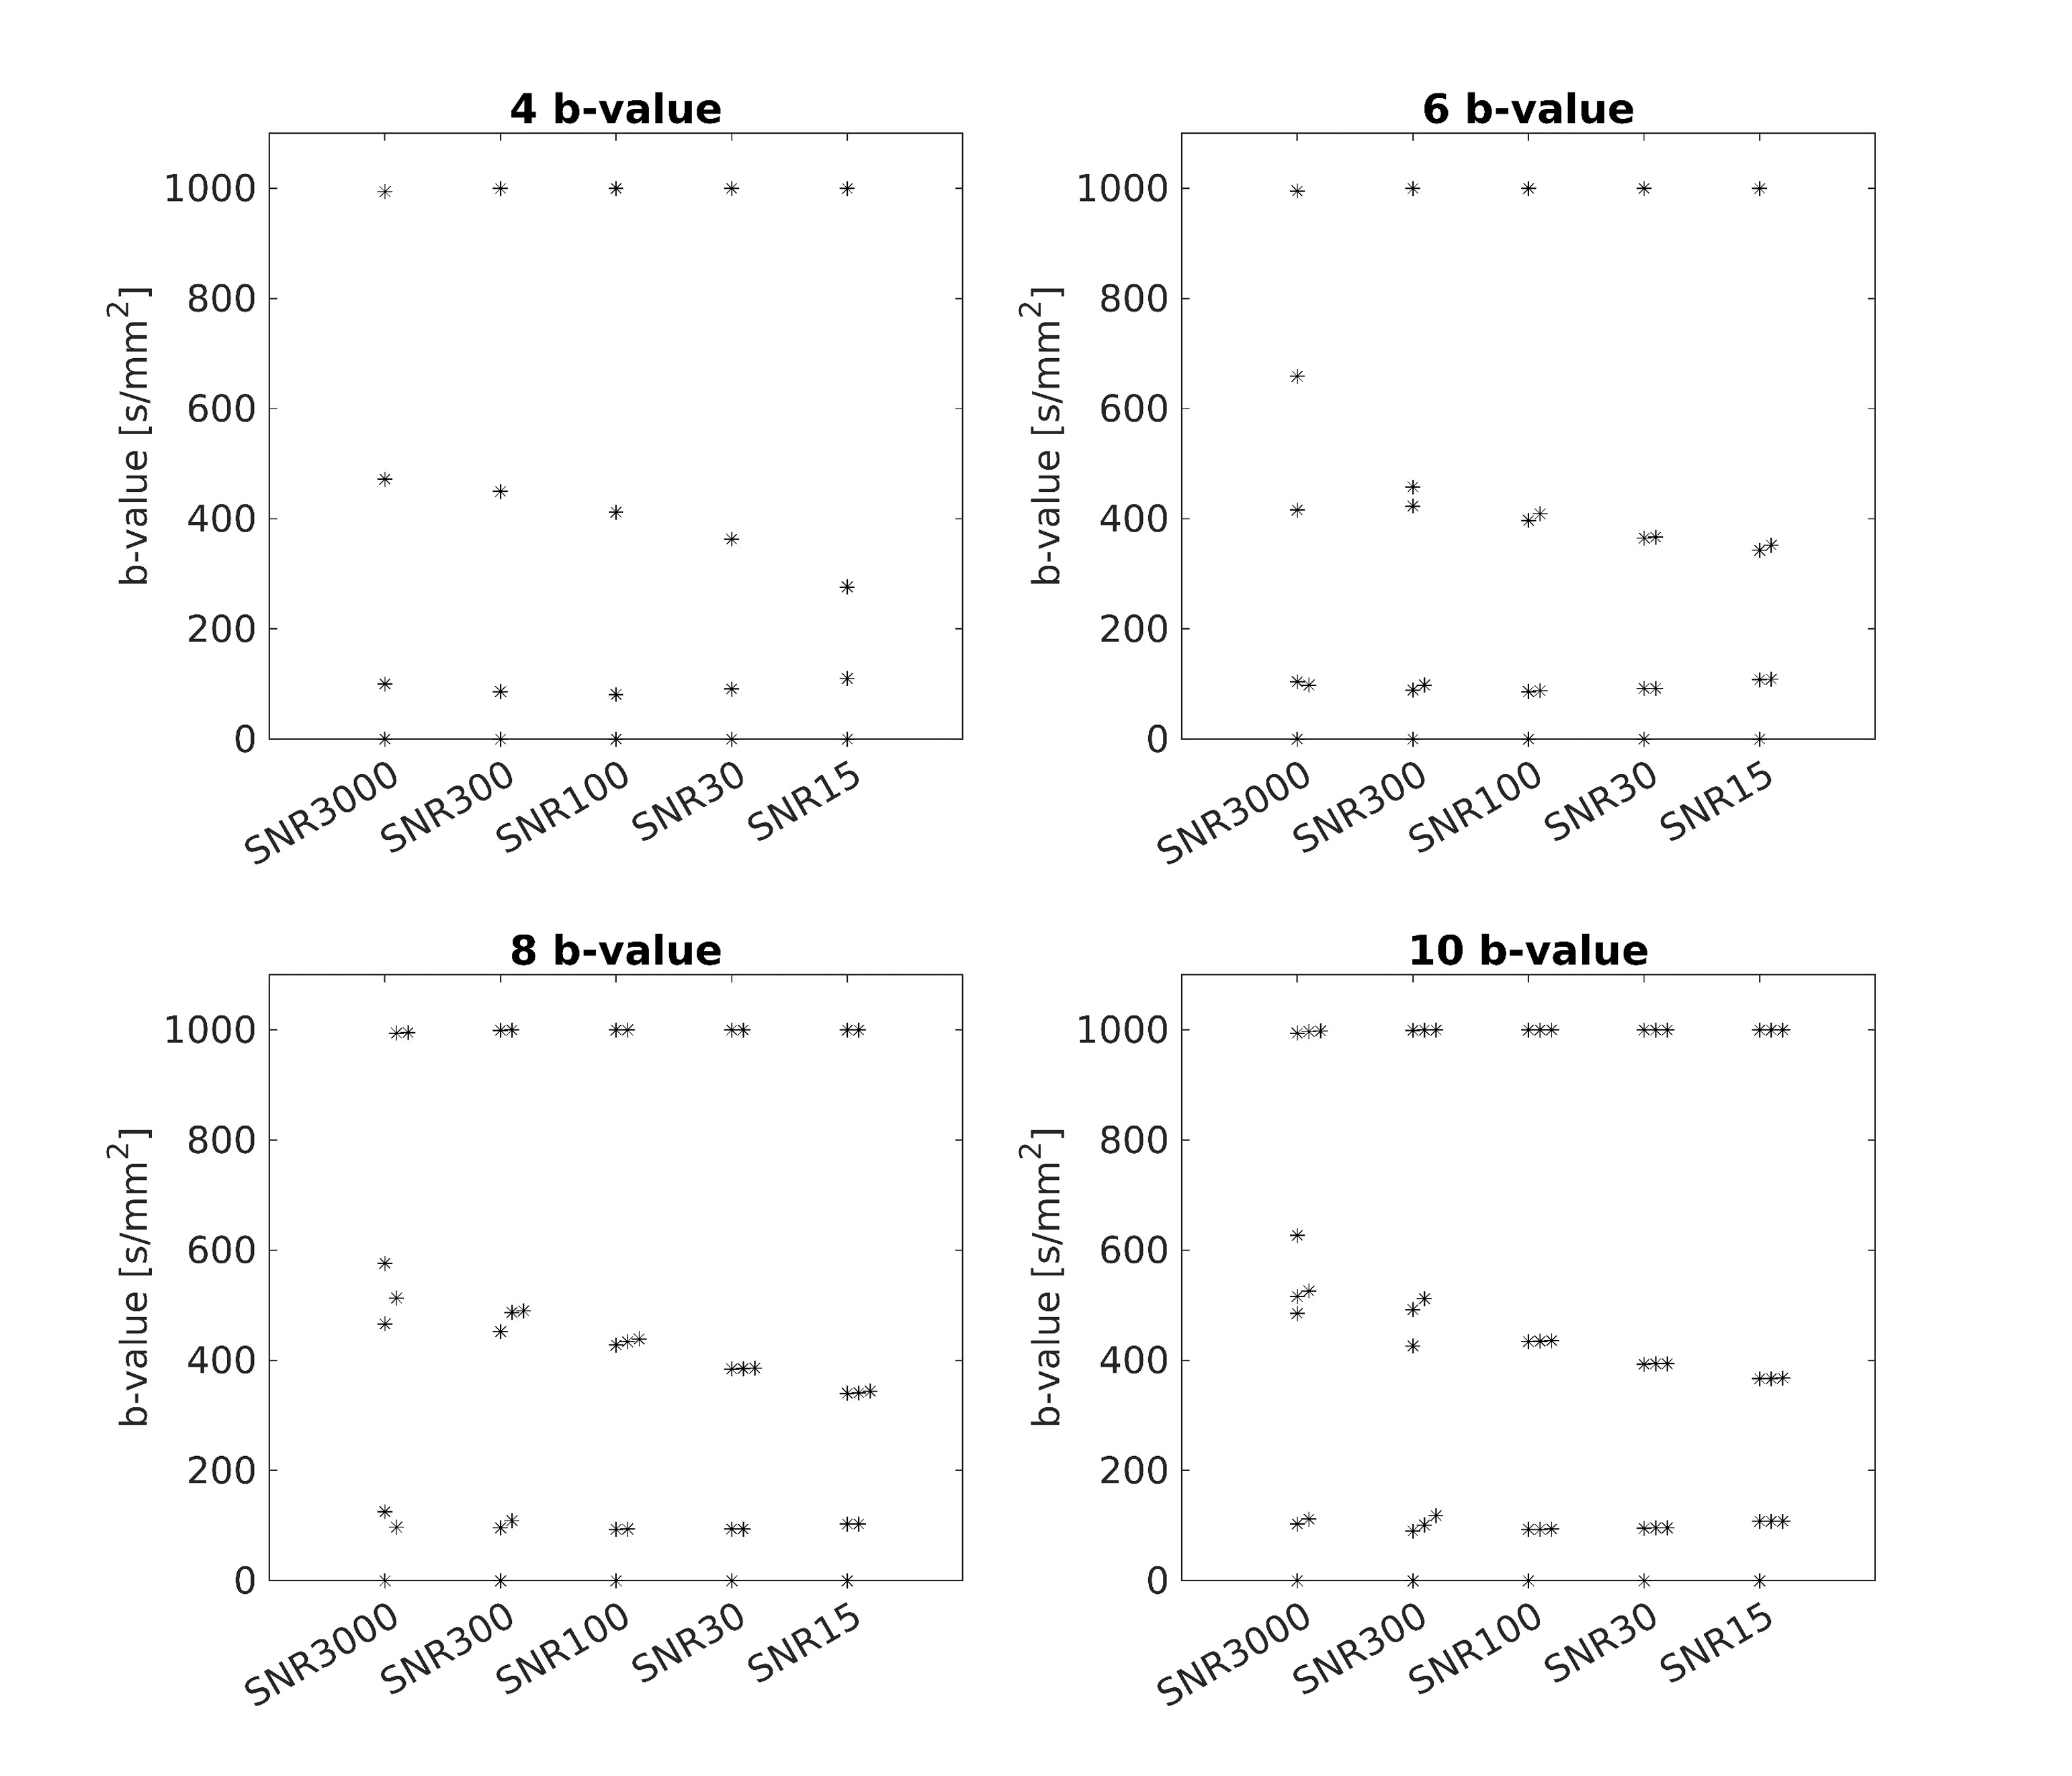
To investigate how the SNR of the MRI signal affected optimization of b-values, $$$10^6$$$ MRI signals were generated with $$$10^6$$$ IVIM parameter sets, respectively, and Rician noise was added to the MRI signal, where five different training MRI signal sets were generated with SNRs of 3000, 300, 100, 30, and 15, respectively. For five different training datasets, five b-values sets were optimized and five DNNs were trained, respectively. 8,000 test MRI signals with an SNR of 100 were used to evaluate the quantification errors. The 8,000 test MRI signals were generated for 8,000 IVIM parameter sets which consist of 20 uniform samplings for each of three parameters ($$$f \in [0,0.2],\space D \in[0,1.8\times10^-3]mm^2/s, \space D_p \in [0,20 \times10^-3] mm^2/s$$$).In-vivo experiment
MRI experiments were performed on five healthy volunteers on a 3 Tesla MRI scanner (Verio, Siemens Healthcare, Germany) with a 32-channel head coil. In vivo experiments were conducted with approval of the institutional review board. A twice-refocused spin-echo EPI sequence was used for the experiments with the imaging parameters as TR = 3000ms; TE = 92ms; number of averages = 1; FOV = 230mm$$$\times$$$230mm; matrix size = 128$$$\times$$$128; partial Fourier reduction factor = 5/8; slice thickness = 4mm; and bandwidth = 1502Hz/pixel. The diffusion weighted images were acquired for the four sets of optimized b-values ( $$$n$$$= 10) from the proposed method, Jalnefjord’s method, Zhang’s method, and uniform sampling, respectively.Results
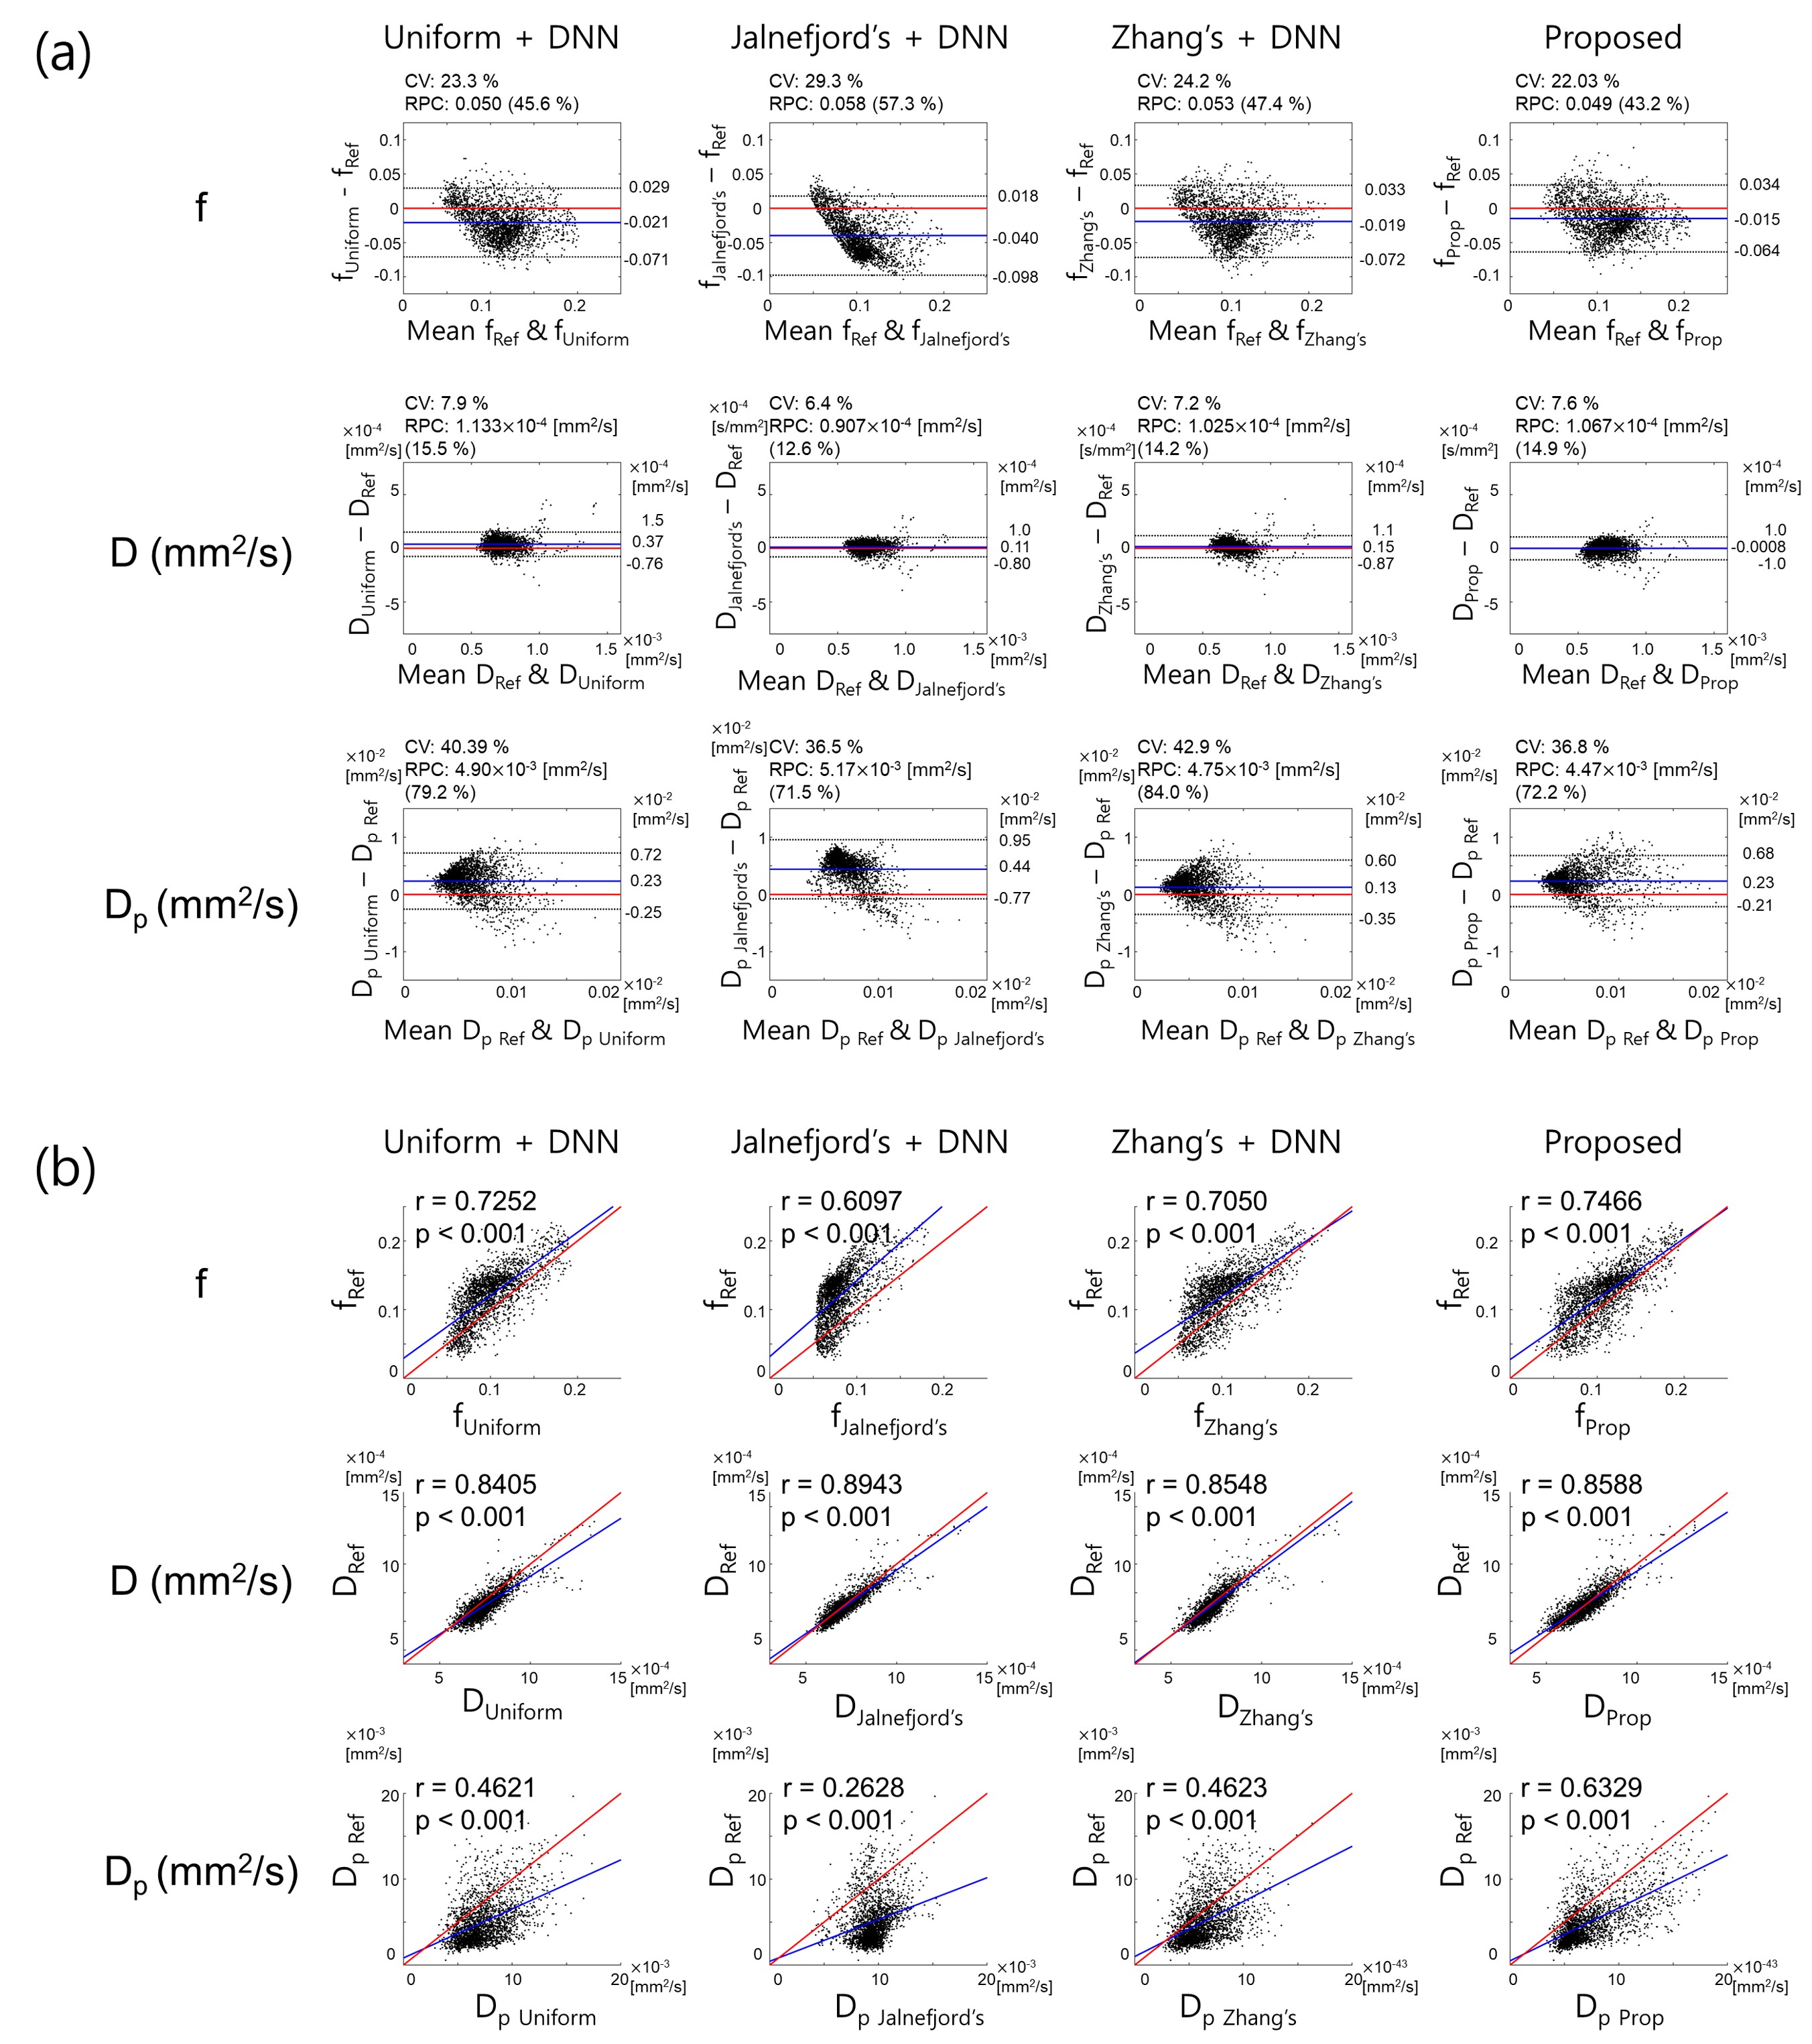
Figure 2 shows the b-values ( $$$n$$$=4, 6, 8, 10) optimized by the proposed method. The optimized b-values are different according to SNR. As shown in Figure 3, the TPE was the lowest when the proposed network was used to quantify the IVIM parameters, and the b-values optimized by the proposed method were used to obtain the diffusion-weighted images. Figure 4 shows that the IVIM parameters estimated by the proposed method has the highest agreement with the reference IVIM parameters.Discussion & Conclusion
In the paper, the simulation results and in-vivo experiment results showed that the b-values optimized by the proposed DNN-based method improved the quantification accuracy of the IVIM parameters. Furthermore, the b-values were optimized and the network was trained simultaneously in the proposed method. The optimal b-values for IVIM quantification using deep neural network were affected by SNR, which meant SNR should be considered when optimizing b-values for IVIM parameter quantification using DNN.Acknowledgements
This research was partly supported by a grant of the Korea Health Technology R&D Project through the Korea Health Industry Development Institute (KHIDI), funded by the Ministry of Health & Welfare, Republic of Korea (grant number: HI14C1135). This work was also partly supported by Institute for Information & communications Technology Planning & Evaluation(IITP) grant funded by the Korea government(MSIT) (No.2017-0-01779, A machine learning and statistical inference framework for explainable artificial intelligence).References
1. Le Bihan D, Breton E, Lallemand D, Aubin M, Vignaud J, Laval-Jeantet M. Separation of diffusion and perfusion in intravoxel incoherent motion MR imaging. Radiology 1988;168(2):497-505.
2. Luciani A, Vignaud A, Cavet M, Tran Van Nhieu J, Mallat A, Ruel L, Laurent A, Deux J-F, Brugieres P, Rahmouni A. Liver cirrhosis: intravoxel incoherent motion MR imaging—pilot study. Radiology 2008;249(3):891-899.
3. Federau C, Cerny M, Roux M, Mosimann PJ, Maeder P, Meuli R, Wintermark M. IVIM perfusion fraction is prognostic for survival in brain glioma. Clinical neuroradiology 2017;27(4):485-492.
4. Federau C, O'Brien K, Meuli R, Hagmann P, Maeder P. Measuring brain perfusion with intravoxel incoherent motion (IVIM): initial clinical experience. Journal of Magnetic Resonance Imaging 2014;39(3):624-632.
5. Selby NM, Blankestijn PJ, Boor P, Combe C, Eckardt K-U, Eikefjord E, Garcia-Fernandez N, Golay X, Gordon I, Grenier N. Magnetic resonance imaging biomarkers for chronic kidney disease: a position paper from the European Cooperation in Science and Technology Action PARENCHIMA. Nephrology Dialysis Transplantation 2018;33(suppl_2):ii4-ii14.
6. Jalnefjord O, Montelius M, Starck G, Ljungberg M. Optimization of b‐value schemes for estimation of the diffusion coefficient and the perfusion fraction with segmented intravoxel incoherent motion model fitting. Magnetic resonance in medicine 2019;82(4):1541-1552.
7. Zhang JL, Sigmund EE, Rusinek H, Chandarana H, Storey P, Chen Q, Lee VS. Optimization of b‐value sampling for diffusion‐weighted imaging of the kidney. Magnetic resonance in medicine 2012;67(1):89-97.
8. Cho GY, Moy L, Zhang JL, Baete S, Lattanzi R, Moccaldi M, Babb JS, Kim S, Sodickson DK, Sigmund EE. Comparison of fitting methods and b‐value sampling strategies for intravoxel incoherent motion in breast cancer. Magnetic resonance in medicine 2015;74(4):1077-1085.
Figures