1709
Widespread effect of age related macular degeneration on brain structural integrity.1BIAC, Duke School of Medicine, Durham, NC, United States, 2Duke Radiology, Duke School of Medicine, Durham, NC, United States, 3Duke Neurology, Duke School of Medicine, Durham, NC, United States, 4School of Psychology, Shanghai University of Sport, Shanghai, China, 5Statistics, Duke University, Durham, NC, United States, 6Trinity College of Arts & Sciences, Duke University, Durham, NC, United States, 7Geriatrics, Duke School of Medicine, Durham, NC, United States
Synopsis
Age-related macular degeneration (AMD) has been associated with brain degeneration, particularly in the cortical regions of the brain. Our study involved the comparison of subjects with AMD to subjects, with both an initial scan at the beginning of the study, and a secondary one two years later. Using anatomical and diffusion acquisitions, we ascertained that there was a marked decrease in cortical volumetry and fractional anisotropy (FA), and that it evolved very rapidly in the case of FA. A PCA run on the connectivity matrices also identified the connections that were most affected.
Introduction
Age-related macular degeneration (AMD) is a debilitating eye disease that can blur vision, and affects older adults with increasing incidence (30% of people >70). AMD not only causes visual impairment but sensory deprivation, and may contribute to brain degeneration[1], with an additive downstream effects superimposed onto the normal pattern of age-related neural decline. In this study we have investigated brain-wide morphometric and microstructural changes based on longitudinal diffusion weighted imaging (DWI) in age-related macular degeneration.Methods
Our study includes 3T MR images from 39 AMD patients (26 females, ages 62-94, mean age = 75.8) and 33 controls (20 females, ages 56-85, mean age = 74.1). We acquired anatomical and diffusion images from 72 subjects, 40 of which had acquisitions both in the initial period of acquisition and two years later, giving us a total of 112 different acquisitions all together. Anatomical images were acquired using a 3D fSPGR sequence (TR = 8.156 ms; TE= 3.18 ms; TI = 450 ms; FOV = 25.6 cm2; flip angle =12°; voxel size = 1 x 1 x 1 mm; 166 contiguous slices, sense factor = 2). DWI scans were acquired with TR = 9,000 ms; TE = 85.6 ms; FOV = 25.6 cm2; flip angle =90°; voxel size = 1 x 1 x 2 mm; 68 slices parallel to the AC-PC plane; 30 diffusion-weighted directions; b = 1000 s/mm2; 4 non-diffusion-weighted reference image. All T1 subject images were registered to the IIT human brain atlas using the SAMBA pipeline, with said registration then concurrently applied to the diffusion images. DWI images was reconstructed using a Q-ball constant Solid Angle Reconstruction [2], with the tractography results built using a deterministic maximum direction getter. The connectivity matrices were built by obtaining the endpoints of all tracts and their connections to the 84 gray matter regions described by the IIT atlas. Additionally, we applied a more inclusive method taking into account all cortical regions of interest crossed by tracts. Our data describes longitudinal change (Δ) from acquisitions taken at T1 and T2 (two years later). Lastly, we ran a Tensor Network PCA on the connectivity matrices in order to determine the longitudinal change (Δ) between these groups and which connections were most relevant in this distinction[3].Results
Our results describe longitudinal change in volume, fractional anisotropy (FA), and tractography via tensor network analysis. After the processing and registration of the anatomical data, the volume of the control subjects was compared with that of those with AMD through a voxel-based analysis (VBA) with a False Discovery Rate (FDR) of 0.05 (Fig 1). We found widespread volume decreases in AMD relative to matched controls. The same analysis on FA values demonstrated a more selective pattern of group differences, as can be seen in Fig 2. We found FA declines in visual, temporal, and occipital cortices, as well as a strong cluster of FA decline in anterior cingulate cortex. We also found that the rate of change in FA over two years for these subjects was significantly different between AMD and control groups. We next examined brain connectivity patterns using a tensor network PCA[4], over all initial acquisitions, and then two years later. The connections between regions of interest that showed the most change between AMD and control are shown in Table 1 and include multiple cortical parietal regions.Discussion
During our VBA volume comparison, the differences that most survived between the two groups by a wide margin were those voxels where Control-Vol > AMD-Vol as can be seen in Fig 1. This was true both when comparing the initial acquisitions and those taken two years later, however this effect was much more wide-spread and overall stronger two years later. FA was also higher in controls than AMD as seen in Fig 2, though this effect was less noticeable in the initial group. Two years later, however, the FA decrease in FA had grown much more significant, and the rate of change in FA was significantly higher in AMD subjects relative to normal aging controls. The PCA results underline multiple connections between Regions of Interest (ROI) that have links to visual information (in the case of the inferior-parietal cortex) and memory (rostral middle frontal, supramarginal,gyrus, and the superior frontal cortex).Conclusion
Our results demonstrate that a) diffuse volume atrophy and b) selective DWI-based measures both distinguish AMD from age matched controls using cortical connections, linking back to previous observed changes in cortical regions in individuals with AMD[5,6]. Our longitudinal tensor analysis reveals an even clearer pattern of AMD-related changes, such that tractography seeded in visual cortex demonstrates a much faster decline in white matter integrity in AMD, relative to age-matched controls. Identifying specific patterns of regional atrophy may offer windows for effective interventions to prevent or slow down further degeneration.Acknowledgements
R01AG043438
R01MH118927
References
[1] Kaarniranta, Kai, et al. "Age-related macular degeneration (AMD): Alzheimer's disease in the eye?." Journal of Alzheimer's Disease 24.4 (2011): 615-631.
[2] Tuch, David S. "Q‐ball imaging." Magnetic Resonance in Medicine: An Official Journal of the International Society for Magnetic Resonance in Medicine 52.6 (2004): 1358-1372.
[3] Garyfallidis, Eleftherios, et al. "Dipy, a library for the analysis of diffusion MRI data." Frontiers in neuroinformatics 8 (2014): 8.
[4] Zhang, Zhengwu, et al. "Tensor network factorizations: Relationships between brain structural connectomes and traits." Neuroimage 197 (2019): 330-343.
[5] Beer, Anton L., Tina Plank, and Mark W. Greenlee. "Aging and central vision loss: Relationship between the cortical macro-structure and micro-structure." NeuroImage 212 (2020): 116670.
[6] Boucard, Christine C., et al. "Changes in cortical grey matter density associated with long-standing retinal visual field defects." Brain 132.7 (2009): 1898-1906.
Figures
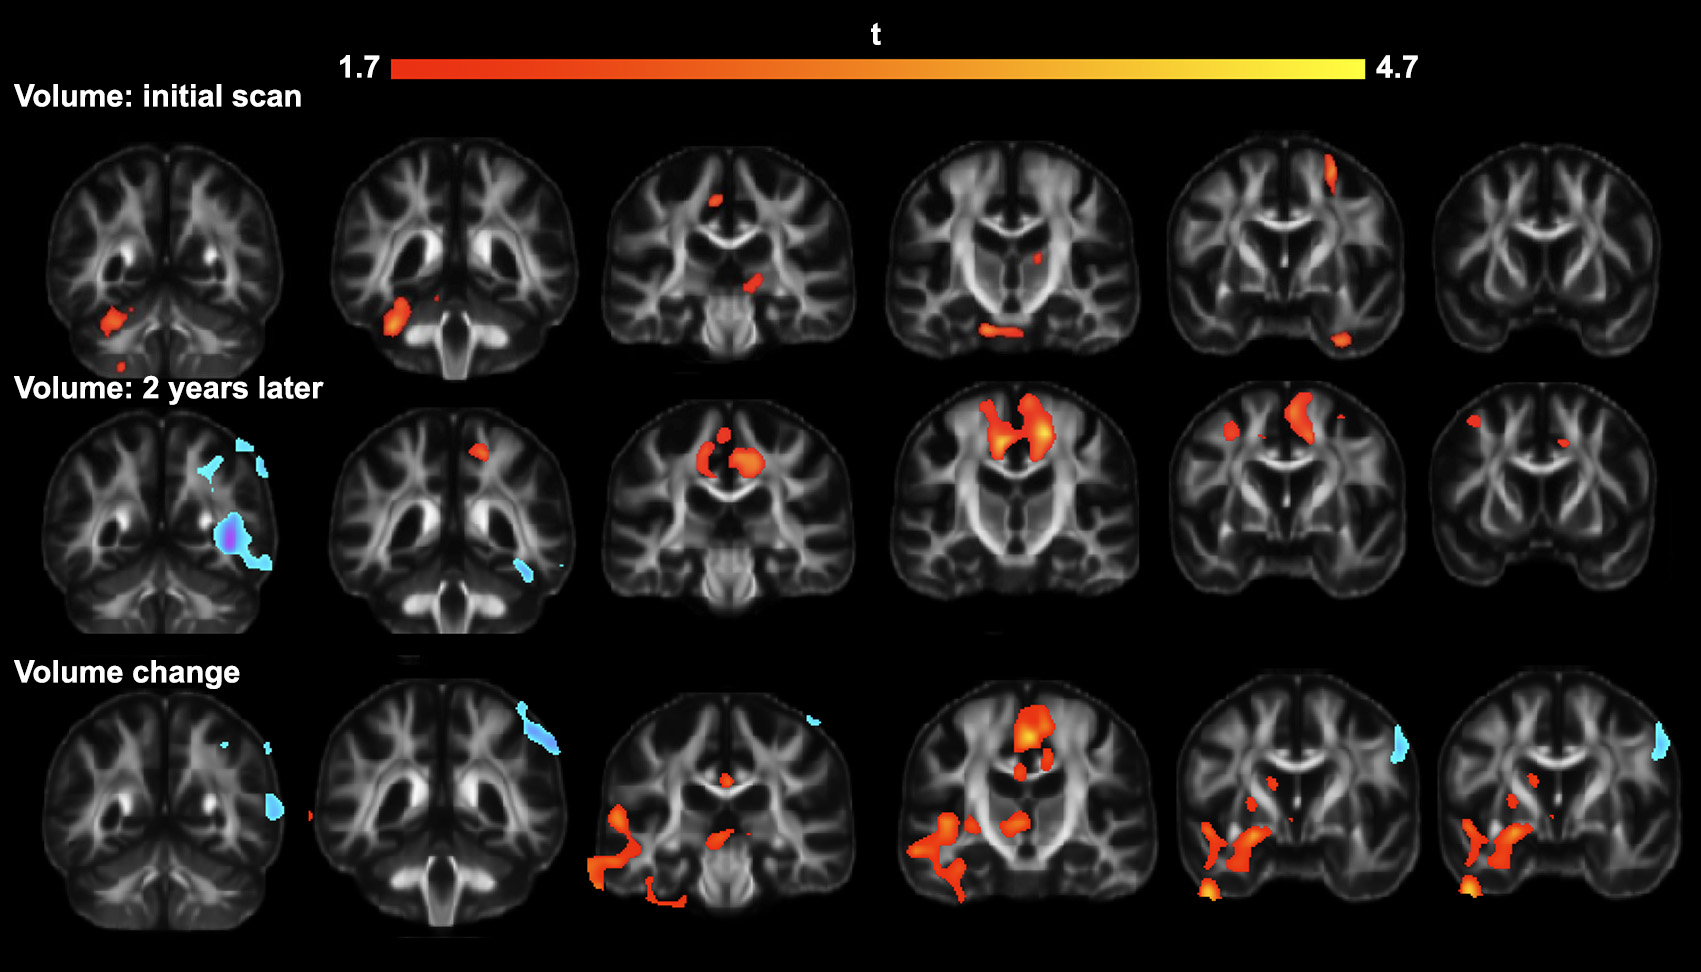
Top row: Results of VBA on anatomical images obtained upon initial scanning.
Middle row: Results of VBA on anatomical images obtained two years later.
Bottom row: Location of important volumetric changes in subjects in the two-year interval.
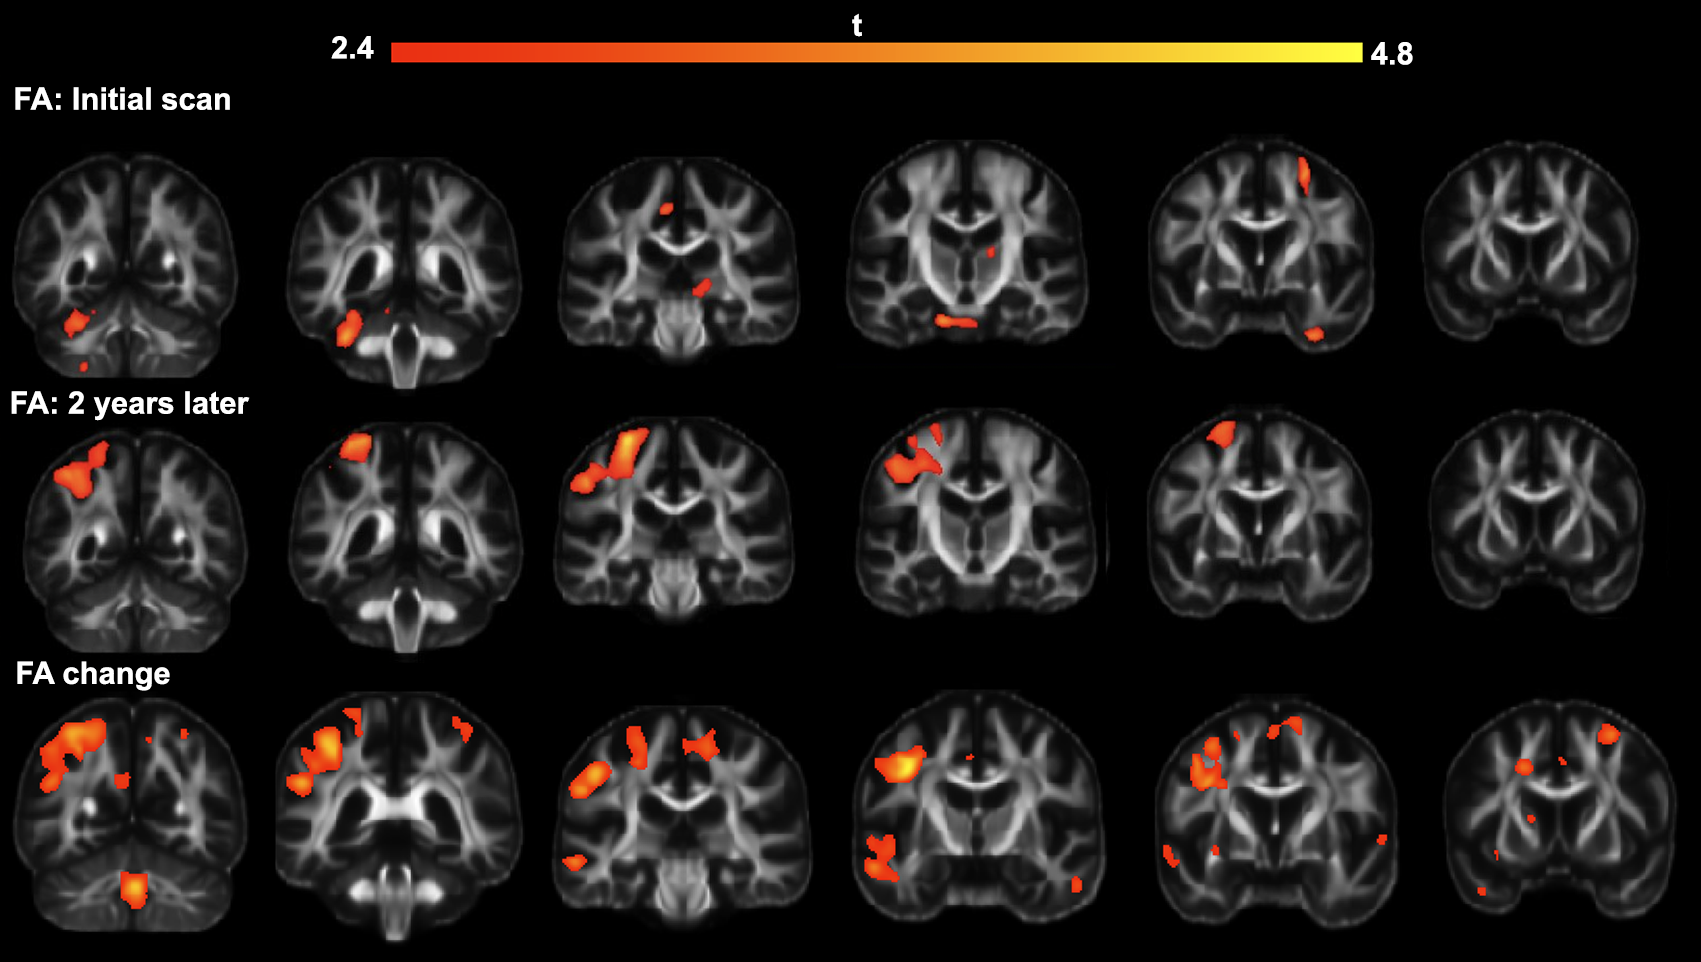
Top row: Results of VBA on anatomical images obtained upon initial scanning
Middle row: Results of VBA on anatomical images obtained two years later.
Bottom row: Location of important volumetric changes in subjects in the two-year interval.
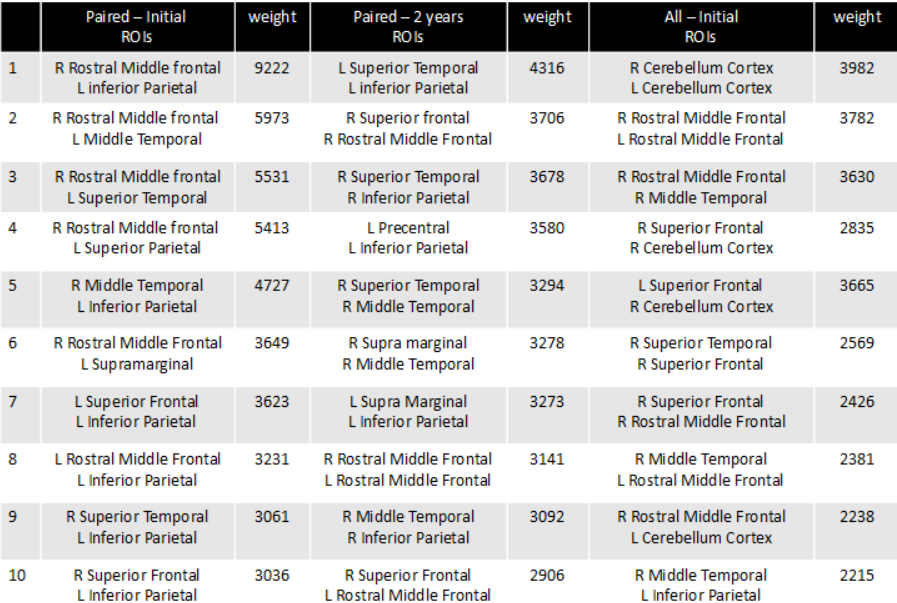
Summarizes the 10 connections that were most relevant in differentiating between control group and AMD group.