1702
Longitudinal Apparent Diffusion Coefficient Trajectory in Different Severity Outcome Following Experimental Neonatal Hypoxic Ischemia1National Yang Ming University, Taipei, Taiwan, 2Chang-Gung University, Taoyuan, Taiwan, 3Taipei Medical University, Taipei, Taiwan, 4National Cheng Kung University, Tainan, Taiwan
Synopsis
Temporal and regional profile of ADC-related MR characteristics after neonatal hypoxic ischemia between mild and severe outcome was delineated at 6 h, 24 h and 7 days after injury. Significant difference in ADC trajectories obtained early after HI are observed between outcome groups, suggesting that distinct ADC changes may be associated to tissue damage severity along the progress of HI.
Introduction
Neonatal hypoxic ischemia (HI) encephalopathy is the major cause of brain injury in newborns. Clinically, abnormal MR signals after birth have been proposed to correlate with the subsequent adverse outcomes.1 However, the particular patterns of MRI such as basal ganglia and thalamic (BGT) lesion, watershed pattern of injury, and bright brain may not appear at one week after birth until devastating.2 In this study, longitudinal MRI was performed to depict the distinct neuroimaging profiles in the Rice-Vannucci model with different severity of HI.3 We demonstrated that significant evolution of global and regional ADC profiles during HI progression between mild and severe outcome group, suggesting the early tissue change reflected by ADC characteristics may associate with the following HI severity.Methods
On postnatal day 10 (P 10), 16 Sprague-Dawley rat pups were anesthetized with 1-2% isoflurane for permanent ligation of the right common carotid artery to induce HI injury. After surgery, the pups returned to their dams for 1-hour recovery before 2.5 hours of hypoxia (8% oxygen balanced with nitrogen). Animal MR Imaging including diffusion and anatomical data were acquired within 6 h, at 24 h and 7 days after hypoxia on a Brucker 7T PharmaScan scanner, as described in the previous study.4 Animals after longitudinal MRI were used for outcome measurement defined as the ipsilateral cerebral hemispheric volume loss compared with the contralateral cerebral hemisphere by using Nissl staining on P 17.5 The ADC-deficit area was identified as regions showing ADC < 70% of the contralateral homologous brain.6-8 For region of interest (ROI) analysis, our interested brain area including the corpus callosum, cortex, thalamus, hippocampus, and striatum4 were delineated based on T2w images and atlas at different time points after HI. Differences in the deficit volumes, ADC value, hemispheric volume, and regional ADC change between mild and severe HI outcome group at multiple time points were compared using unpaired 2-way ANOVA, followed by post-hoc tests. Significant level was set at P<0.05. Error bars were STD.Results & Discussion
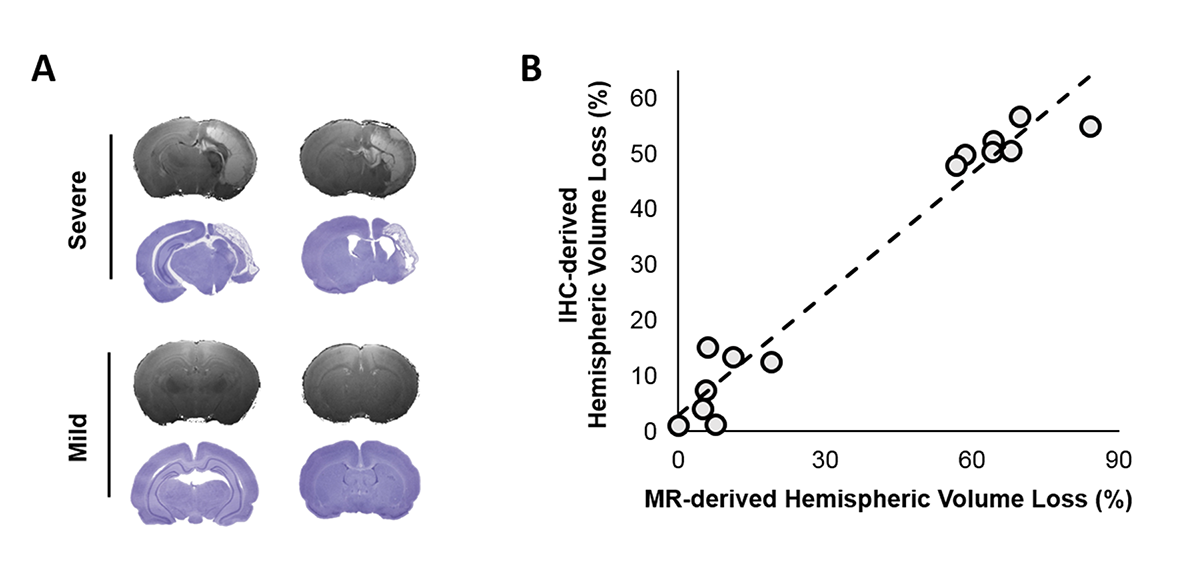
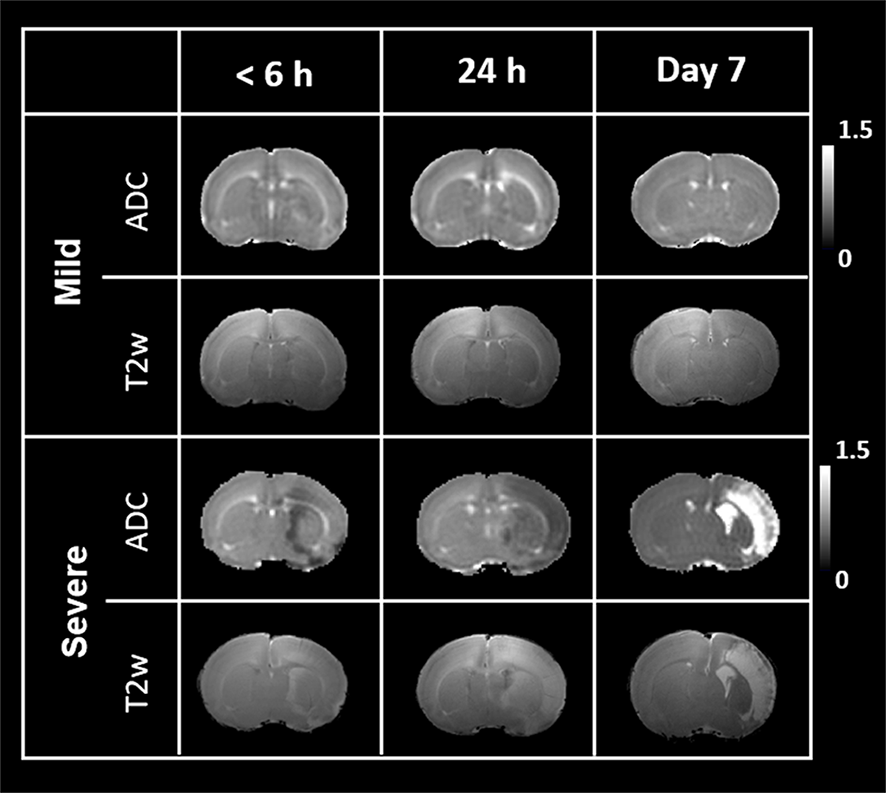
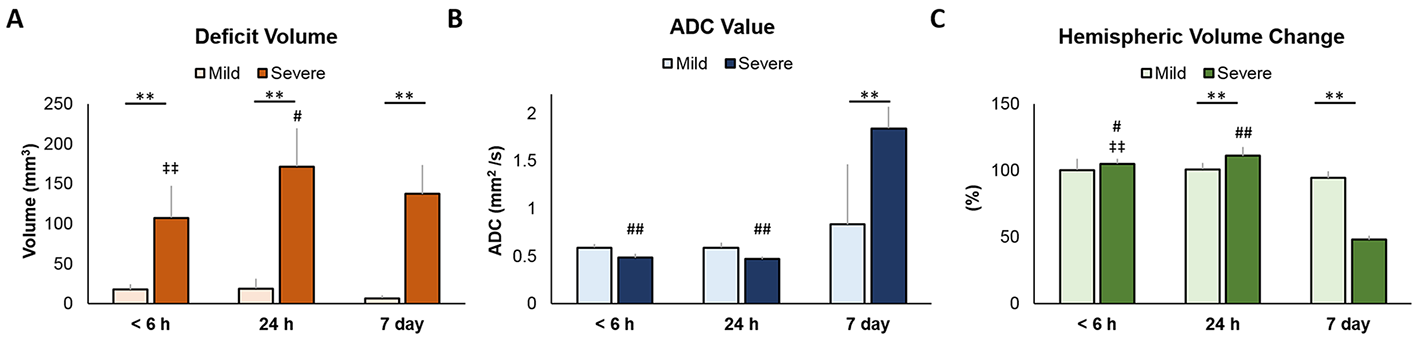
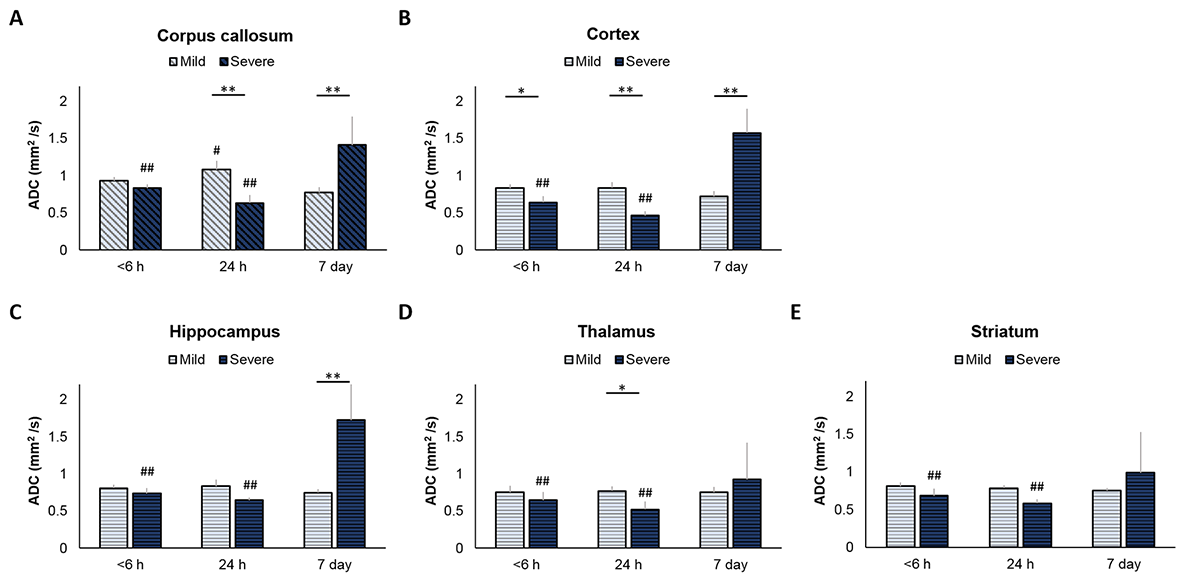
By using the Rice-Vannucci model, we observed that a broad spectrum of brain damage severity outcomes (Fig 1A) occurred even after the same duration of HI.9 Significant correlation between IHC- and MR-derived hemispheric volume loss (r=0.935, P<0.005) demonstrated the feasibility of T2w MR images in measuring the brain damage outcome at 7 days after HI (Fig 1B). Even though no change was observed in the mild outcome group within 6 h after HI, the hypointense signals of ADC deficit regions were seen in the ipsilateral cortex, subcortical hippocampus, and striatum areas in the severe outcome group, which further expanded and became more prominent at 24 h. At 7 days, edema transformation with hyperintensity in both T2w and ADC map developed in the severe outcome group (Fig 2). For quantitative comparison of MR characteristics between two outcome groups, we extracted the ADC deficit area with a 70 % threshold of the contralateral hemisphere. Significant increase in ADC deficit volume was observed in the severe group within 6 hours, at 24 hours, and 7 days after HI (Fig 3A), which is concordant with the findings of clinical studies revealing different brain injury patterns observed using DWI or DTI 2 days after HI.1, 10. Although significant increases in the ADC deficit volume was observed in the severe outcome group at 24 hours, the deficit volume decreased at 7 days. By contrast, the increase in ADC values (Fig 3B) was not significant until 7 days after HI. The ipsilateral cerebral hemispheric volume was increased significantly at 24 hours in the severe outcome group, which decreased at 7 days after HI (Fig 3C) due the edema transformation. To elucidate the changes in regional ADC value among three outcome groups after HI and eliminate the bias of ADC threshold, ROI analysis was performed in advance. Significant lower ADC value was observed in the corpus callosum at 24 h in the severe outcome group, which shows the higher ADC value at 7 days after HI (Fig 4A). Significant lower ADC value was observed in the ipsilateral cortex in the severe group within 6 hours and at 24 hours after HI, suggesting the vulnerability of cortical injury after HI; by contrast, significant higher ADC values was observed in the severe group at 7 days (Fig 4B). Significant lower ADC value in the severe outcome group was observed in the thalamus (Fig 4C) and the hippocampus (Fig 4D) at 24 h and 7 days, respectively. Within 24 h after HI, all the aforementioned brain regions and the ipsilateral striatum showing significant lower ADC value compared with that at 7 days in the severe group (Fig 4) may reflect the subsequent formation of porencephalic cysts.11, 12 In summary, the current study found that different ADC patterns and parameters depicted in the early period after neonatal HI are associated with different brain injury progression trajectories and brain damage severity outcomes. Future study will attempt to integrate multiple tensor metrics together with the regional and temporal information early after HI and build up a tentative outcome prediction model.Acknowledgements
This study was funded in part by Ministry of Science and Technology (MOST 109-2314-B-010-068 and MOST 109-2314-B-010-067-MY3), Taipei, Taiwan.References
1. Shankaran S, McDonald SA, Laptook AR, Hintz SR, Barnes PD, Das A et al. Neonatal Magnetic Resonance Imaging Pattern of Brain Injury as a Biomarker of Childhood Outcomes following a Trial of Hypothermia for Neonatal Hypoxic-Ischemic Encephalopathy. J Pediatr 2015; 167(5): 987-93 e3.
2. de Vries LS, Groenendaal F. Patterns of neonatal hypoxic-ischaemic brain injury. Neuroradiology 2010; 52(6): 555-66.
3. Rice JE, 3rd, Vannucci RC, Brierley JB. The influence of immaturity on hypoxic-ischemic brain damage in the rat. Ann Neurol 1981; 9(2): 131-41.
4. Kao YCJL, C.F.; Hsieh, B.Y.; Huang, C.C. Chen, C.Y. Early Changes in Diffusion Tensor Metrics between Different Final Damage Outcomes after Experimental Neonatal Hypoxic Ischemia. ISMRM Preceeding 2020.
5. Tu YF, Lu PJ, Huang CC, Ho CJ, Chou YP. Moderate dietary restriction reduces p53-mediated neurovascular damage and microglia activation after hypoxic ischemia in neonatal brain. Stroke 2012; 43(2): 491-8.
6. Chiu FY, Kuo DP, Chen YC, Kao YC, Chung HW, Chen CY. Diffusion Tensor-Derived Properties of Benign Oligemia, True "at Risk" Penumbra, and Infarct Core during the First Three Hours of Stroke Onset: A Rat Model. Korean J Radiol 2018; 19(6): 1161-1171.
7. Kao YJ, Oyarzabal EA, Zhang H, Faber JE, Shih YI. Role of Genetic Variation in Collateral Circulation in the Evolution of Acute Stroke: A Multimodal Magnetic Resonance Imaging Study. Stroke 2017; 48(3): 754-761.
8. Kuo DP, Lu CF, Liou M, Chen YC, Chung HW, Chen CY. Differentiation of the Infarct Core from Ischemic Penumbra within the First 4.5 Hours, Using Diffusion Tensor Imaging-Derived Metrics: A Rat Model. Korean J Radiol 2017; 18(2): 269-278.
9. Tu Y-F, Jiang S-T, Chow Y-H, Huang C-C, Ho C-J, Chou Y-P. Insulin Receptor Substrate-1 activation mediated p53 downregulation protects against Hypoxic-Ischemia in the neonatal brain. Molecular neurobiology 2015: 1-12.
10. Weeke LC, Groenendaal F, Mudigonda K, Blennow M, Lequin MH, Meiners LC et al. A Novel Magnetic Resonance Imaging Score Predicts Neurodevelopmental Outcome After Perinatal Asphyxia and Therapeutic Hypothermia. J Pediatr 2018; 192: 33-40 e2.
11. Ten VS, Wu EX, Tang H, Bradley-Moore M, Fedarau MV, Ratner VI et al. Late measures of brain injury after neonatal hypoxia-ischemia in mice. Stroke 2004; 35(9): 2183-8.
12. Tuor UI, Morgunov M, Sule M, Qiao M, Clark D, Rushforth D et al. Cellular correlates of longitudinal diffusion tensor imaging of axonal degeneration following hypoxic-ischemic cerebral infarction in neonatal rats. Neuroimage Clin 2014; 6: 32-42.
Figures