1700
Birth weight is associated with brain tissue volumes seven decades later but not age-associated changes to brain structure1Centre for Reproductive Health, University of Edinburgh, Edinburgh, United Kingdom, 2Centre for Clinical Brain Sciences, University of Edinburgh, Edinburgh, United Kingdom, 3Geriatric Medicine, Usher Institute, University of Edinburgh, Edinburgh, United Kingdom, 4Lothian Birth Cohorts, University of Edinburgh, Edinburgh, United Kingdom, 5Psychology, University of Edinburgh, Edinburgh, United Kingdom, 6Scottish Imaging Network, A Platform for Scientific Excellence Collaboration (SINAPSE), Edinburgh, United Kingdom
Synopsis
Birthweight is a commonly used indicator of fetal growth weight and has been associated with neuropsychiatric and neurological sequalae. However, little is known about how birth weight impacts the brain in later life. We found positive associations with total brain, grey matter and normal appearing white matter volumes in later life, but not with white matter microstructure or hyperintensities. This relationship is explained by larger head size, rather than by age-associated tissue atrophy, and is furthermore independent of body size. This suggests that larger birthweight is linked to increased brain tissue reserve, but not age-associated brain features.
Introduction
Birth weight, an indicator of fetal growth, is associated with cognitive outcomes in early life (which are predictive of cognitive ability in later life) and risk of metabolic and cardiovascular disease across the life course. Brain health in older age, indexed by MRI features, is associated with cognitive performance, but little is known about how variation in normal birth weight impacts on brain structure in later life. To test the hypothesis that birthweight is associated with brain macrostructure and white matter microstructure in older age, we linked these MRI features of brain structure at 73 years of age with perinatal data using a well-characterised single-year-of-birth cohort of healthy community dwelling-older adults (the Lothian Birth Cohort 1936, LBC1936). To understand how birth weight has an impact on brain structure we considered the potential roles of i) body size ii) age-related brain tissue atrophy, and iii) cardiovascular and metabolic disease, which is also linked to low birth weight and may mediate the relationship between birth weight and brain structure.Methods
Data were collected from the LBC1936, a longitudinal study of ageing comprising individuals who were born in 1936 of whom 137 participants had birthweight recorded (mean 3346g, range 1843 – 4423g) and brain structural and diffusion MRI in later life (mean 72.6 years) (1). Total brain (TB), grey matter (GM), normal appearing white matter (NAWM), white matter hyperintensity (WMH), and intracranial (ICV) volumes were obtained from structural MRI. A general factor of FA across 12 tracts (gFA) and peak width skeletonised mean diffusivity (PSMD) were derived from diffusion MRI (2). We conducted linear regression models of birthweight and brain image features, adjusted for age and sex using R 3.4.3 (R Core Team 2015); we report standardised regression coefficients. We further investigated the involvement of cardiovascular disease and risk factors. We assessed the role of atrophy by controlling for ICV in regressions (3). Cortical vertex-wise analyses across the average surface were performed with linear models to investigate birthweight in relation to cortical surface area (SA) using the SurfStat toolbox (http://www.math.mcgill.ca/keith/surfstat) for Matrix Laboratory R2012a (The MathWorks Inc., Natick, MA). All associations were corrected using the False Discovery Rate (FDR;(4)).Results
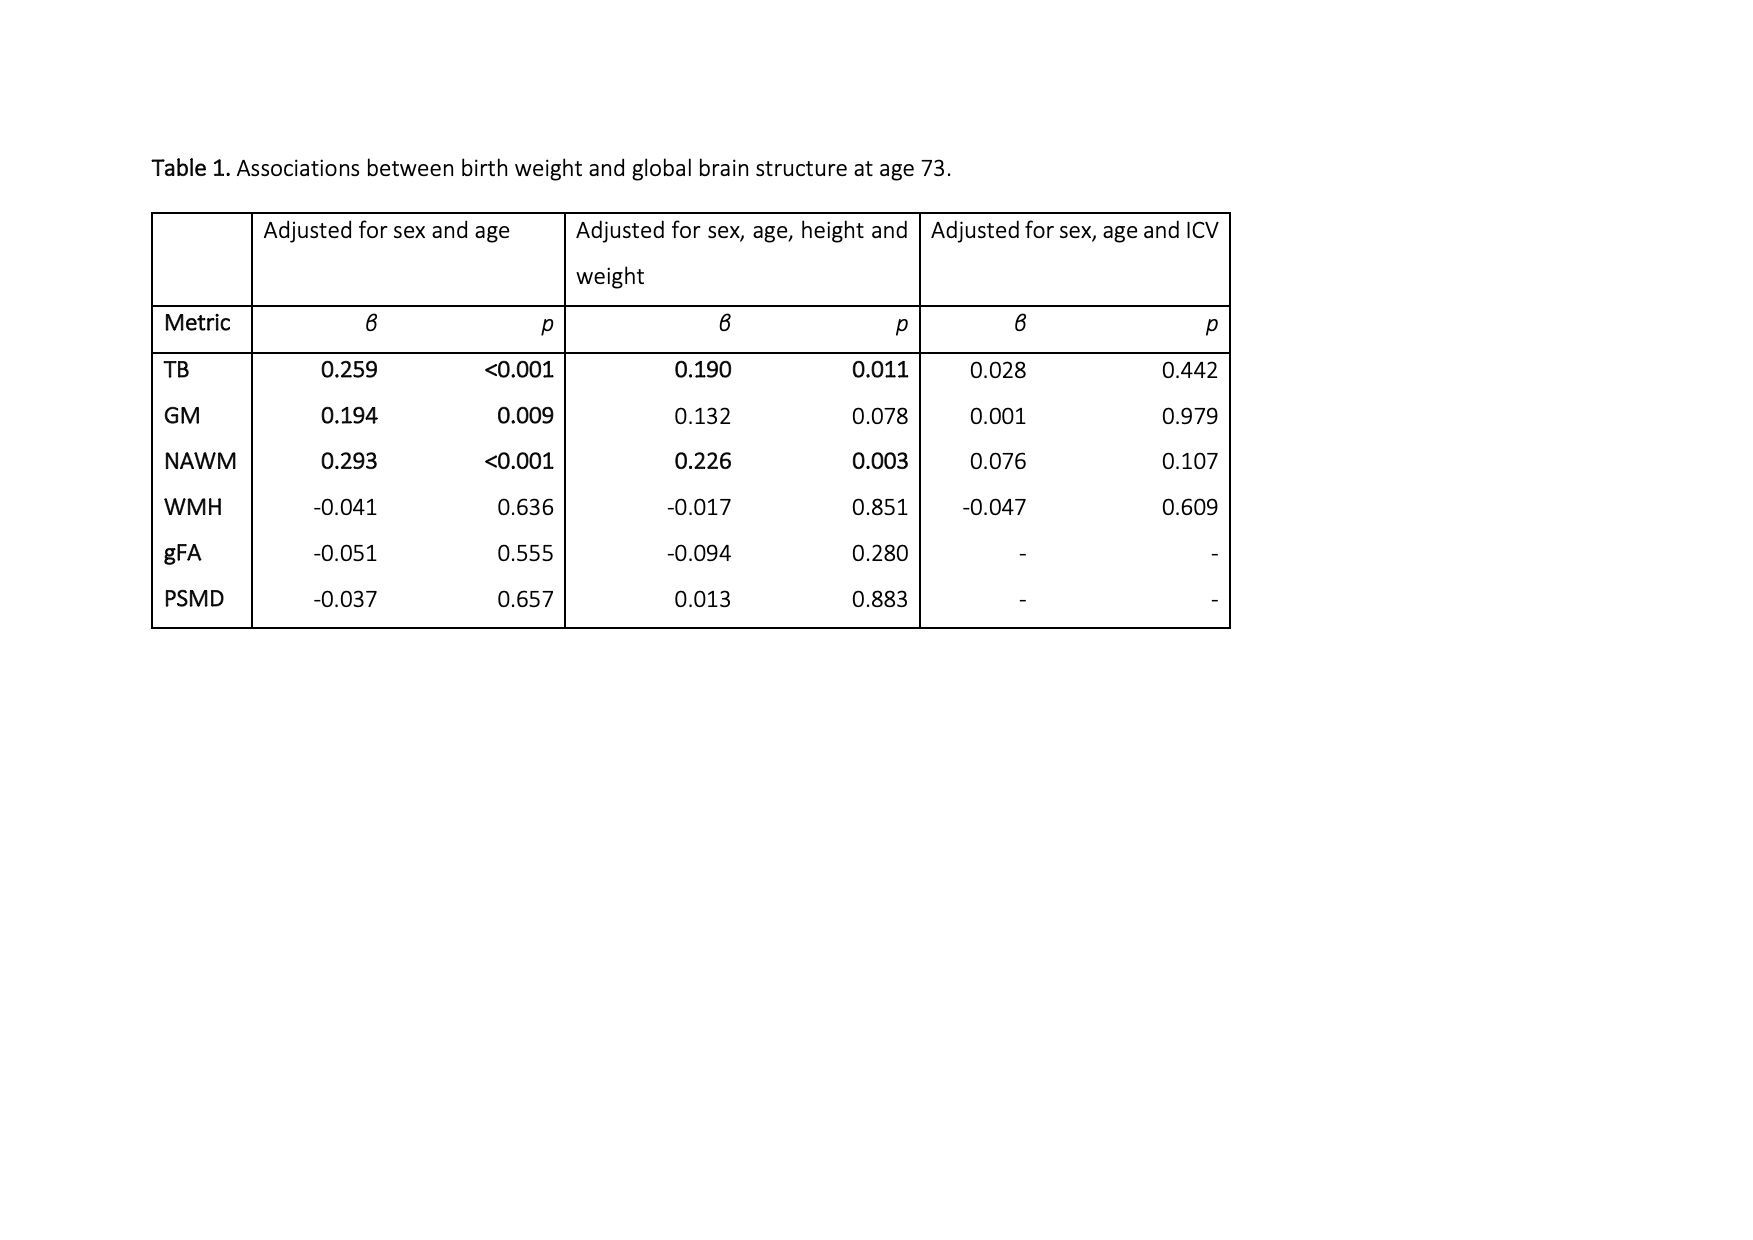
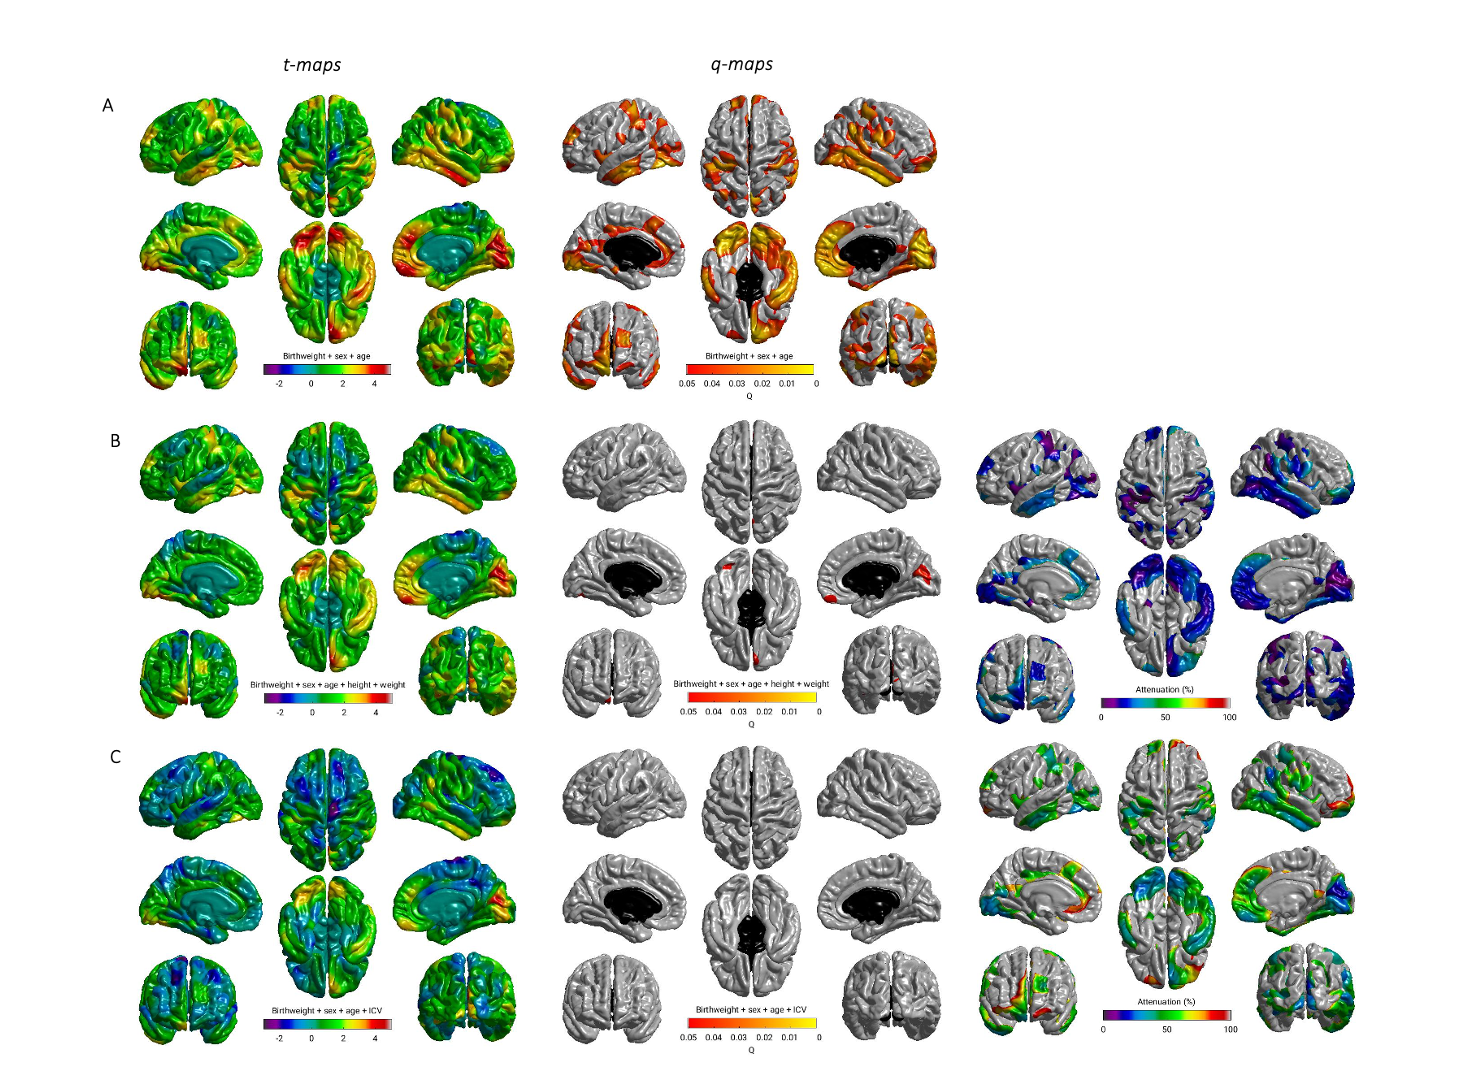
Birthweight was positively associated with TB, GM and NAWM volumes in later life (β ≥ 0.194; p≤0.009) but not WMH volume, gFA or PSMD (Table 1). Controlling for height and weight reduced the strength of the association between birthweight and brain volumes: GM was no longer significant (β =0.1321, p=0.0779) (effect size was attenuated by 31.9%), but associations for TB and NAWM remained significant (β =0.1896, p=0.0106; β = 0.2123, p=0.0068, respectively). When we included ICV as a covariate for all global volumetric measures, we found no significant associations between birth weight and brain volumes (β ≤|0.076|, p ≥ 0.107). When we corrected the associations between birth weight and global brain measures for cardiovascular risk factors and self-report history of cardiovascular disease (Table 2), the initial age- and sex- corrected findings were modestly attenuated by up to 8.5% but remained significant for TB (β = 0.245, p = 0.00170), GM (β = 0182, p = 0.0188 and NAWM (β = 0.268, p = 0.000754). Associations with WMH, gFA and PSMD remained small and non-significant (β ≤|0.05|, p ≥ 0.5). Cortical analyses showed positive associations between birthweight and SA on the bilateral temporal (inferior and middle), cingulate (anterior and posterior segments) and anterior frontal (inferior frontal and frontopolar), supramarginal and medial occipital cortices, as well as evidence for associations in the motor and somatosensory cortices and right-sided medial and lateral orbitofrontal, posterior fusiform, angular gyrus and supramarginal gyrus (Figure 1A). The regional patterning of associations was strikingly similar to those described in a cohort of adolescents and young adults (5). With the addition of ICV as a covariate the influence of birthweight on regional cortical SA was no longer significant. There were no significant associations between birth weight and cortical thickness or cortical volume.Discussion
Larger birthweight is positively associated with TB, GM and NAWM volume, but not differences in white matter microstructure or WMH volume; this was not explained by larger body size, or by cardiovascular disease risk or history. Regional cortical associations are likely explained by ICV, suggesting that the results are not explained by differential susceptibility to brain atrophy.Conclusion
These results might indicate that larger birthweight is linked to increased brain tissue reserve in later life, rather than a resilience to age-related changes in brain structure, such as tissue atrophy or WMH volume.Acknowledgements
ENWW is supported by the Wellcome Trust Translational Neuroscience PhD fellowship programme at the University of Edinburgh (203769/Z/16/A). The Lothian Birth Cohorts group is funded by Age UK (Disconnected Mind grant) and the Medical Research Council (G0701120, G1001245, MR/M013111/1, MR/R024065/1). SRC, MEB and IJD were also supported by a National Institutes of Health (NIH) research grant R01AG054628 Magnetic Resonance Image acquisition and analyses were conducted at the Brain Research Imaging Centre, Neuroimaging Sciences, University of Edinburgh (www.bric.ed.ac.uk) which is part of SINAPSE (Scottish Imaging Network—A Platform for Scientific Excellence) collaboration (www.sinapse.ac.uk) funded by the Scottish Funding Council and the Chief Scientist Office. We thank the Lothian Birth Cohort 1936 participants who took part in this study, the Lothian Birth Cohort 1936 research team members, and radiographers at the Brain Research Imaging Centre.References
1. A. M. Taylor, A. Pattie, I. J. Deary, Cohort Profile Update: The Lothian Birth Cohorts of 1921 and 1936. Int. J. Epidemiol. 47 (2018).
2. J. M. Wardlaw, et al., Brain aging, cognition in youth and old age and vascular disease in the Lothian Birth Cohort 1936: Rationale, design and methodology of the imaging protocol. Int. J. Stroke 6, 547–559 (2011).
3. N. A. Royle, et al., Estimated maximal and current brain volume predict cognitive ability in old age. Neurobiol. Aging 34, 2726–2733 (2013).
4. Y. Benjamini, Y. Hochberg, Controlling the False Discovery Rate : A Practical and Powerful Approach to Multiple Testing. J. R. Stat. Soc. Ser. B (Statistical Methodol. 57, 289–300 (2007).
5. K. B. Walhovd, et al., Long-term influence of normal variation in neonatal characteristics on human brain development. Proc. Natl. Acad. Sci. U. S. A. 109, 20089–20094 (2012).
Figures