1698
The effect of image pre-processing pipelines on age associations of diffusion and kurtosis in white matter1Radiology, NYU School Of Medicine, New York, NY, United States
Synopsis
Diffusion MRI is prone to various artifacts such as noise, eddy current artifacts, and Gibbs ringing. This study compares diffusion tensor imaging (DTI) and diffusional kurtosis imaging (DKI) parameter estimates among healthy subjects in their 20s to 80s using a minimal diffusion pre-processing approach from Human Connectome Project (HCP) and two DESIGNER (Diffusion parameter EStImation with Gibbs and NoisE Removal) pipelines, which corrects for additional imaging artifacts HCP pipeline does not account for. Our results show that preprocessing quantitatively impacts parameter estimation as well as alters observed age correlations.
Introduction
Diffusion MRI (dMRI) probes brain microstructure non-invasively and offers quantitative biomarkers that are of interest to study in development and disease. To provide reliable diffusion parameter estimates, dMRI pre-processing is required and various pipelines have been proposed1,2,3 to correct for typical artifacts including distortion from EPI, eddy currents, and Gibbs ringing and thermal noise. Such pipelines differ in terms of algorithmic methods and it remains unclear how these differences manifest in dMRI parameters and, ultimately, impact population-wise statistical findings.In this work, we focus on targeted methods for noise reduction using eigenvalue shrinkage4, and Gibbs5,6 removal. Here we study DTI and DKI parameters in white matter of 89 subjects to evaluate the impact of three integrated pipelines (Figure 1) on parameter estimation and on age associations, a well-studied biological effect7,8,9.
Methods
A retrospective IRB-approved study included a cohort of 89 control subjects (61 females) with ages ranging from 23- to 85-year-old, selected out of a total dataset of 3754 subjects who presented for clinical MRI on a Magnetom Prisma 3T (N=39) or Skyra 3T (N=50). dMRI was acquired as follows: 5 b = 0 images, b = 250 s/mm2 – 4 directions, b = 1000 s/mm2 – 20 directions, b = 2000 s/mm2 – 60 directions, TE = 70ms (N=13) or 95ms (N=76), TR = 3.7s, 50 slices, resolution = 1.7x1.7x3mm3, 6/8 Partial Fourier. One b = 0 image was acquired with reverse phase-encoding direction for EPI distortion correction10,11.dMRI were pre-processed using three different pipelines:
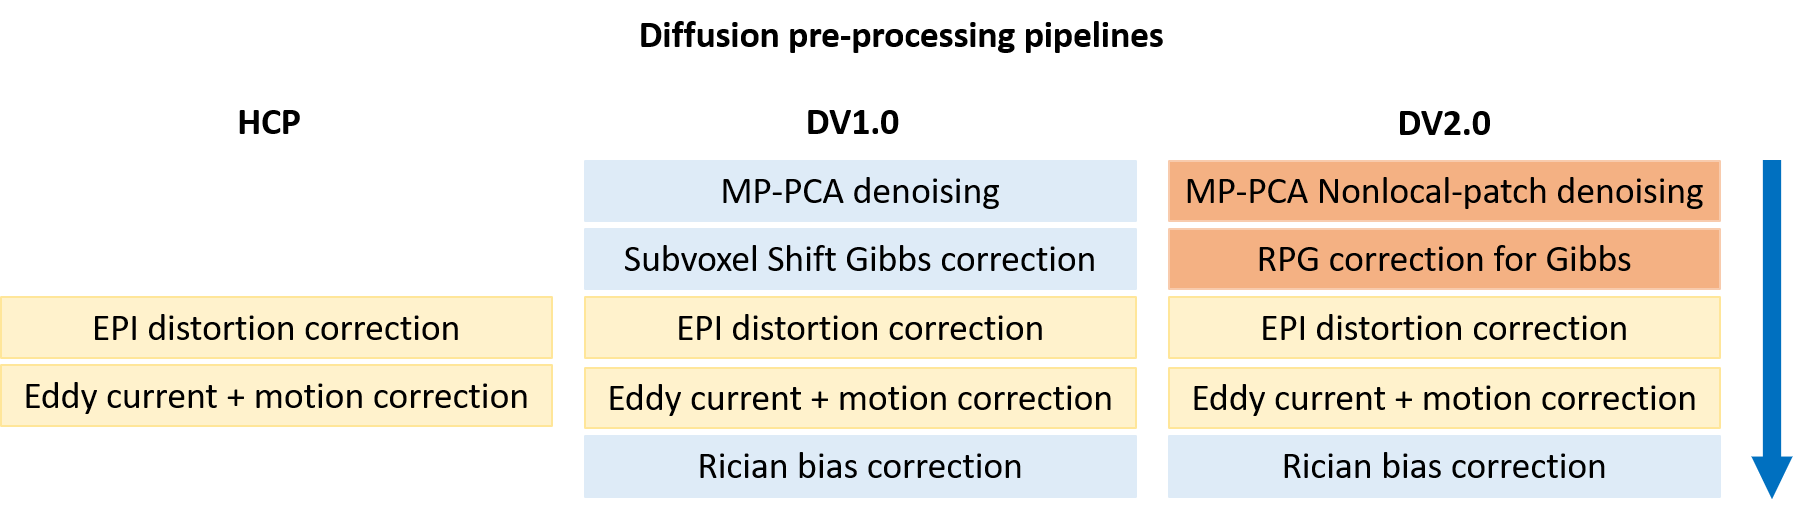
- Human Connectome Project (HCP)1, a standard processing pipeline which targets eddy current, EPI distortion, and motion correction;
- DESIGNER (DV1.0)2, a processing pipeline involving the same correction as HCP pipeline along with Gibbs correction6, denoising12, and Rician bias correction13.
- DESIGNER (DV2.0) pipeline, a further development of DESIGNER (DV1.0) that integrates recent developments in Gibbs correction and denoising: (a) RPG (Removal of Partial-fourier induced Gibbs ringing)5 and (b) MP-PCA nonlocal-patch denoising with eigenvalue shrinkage4.
Results
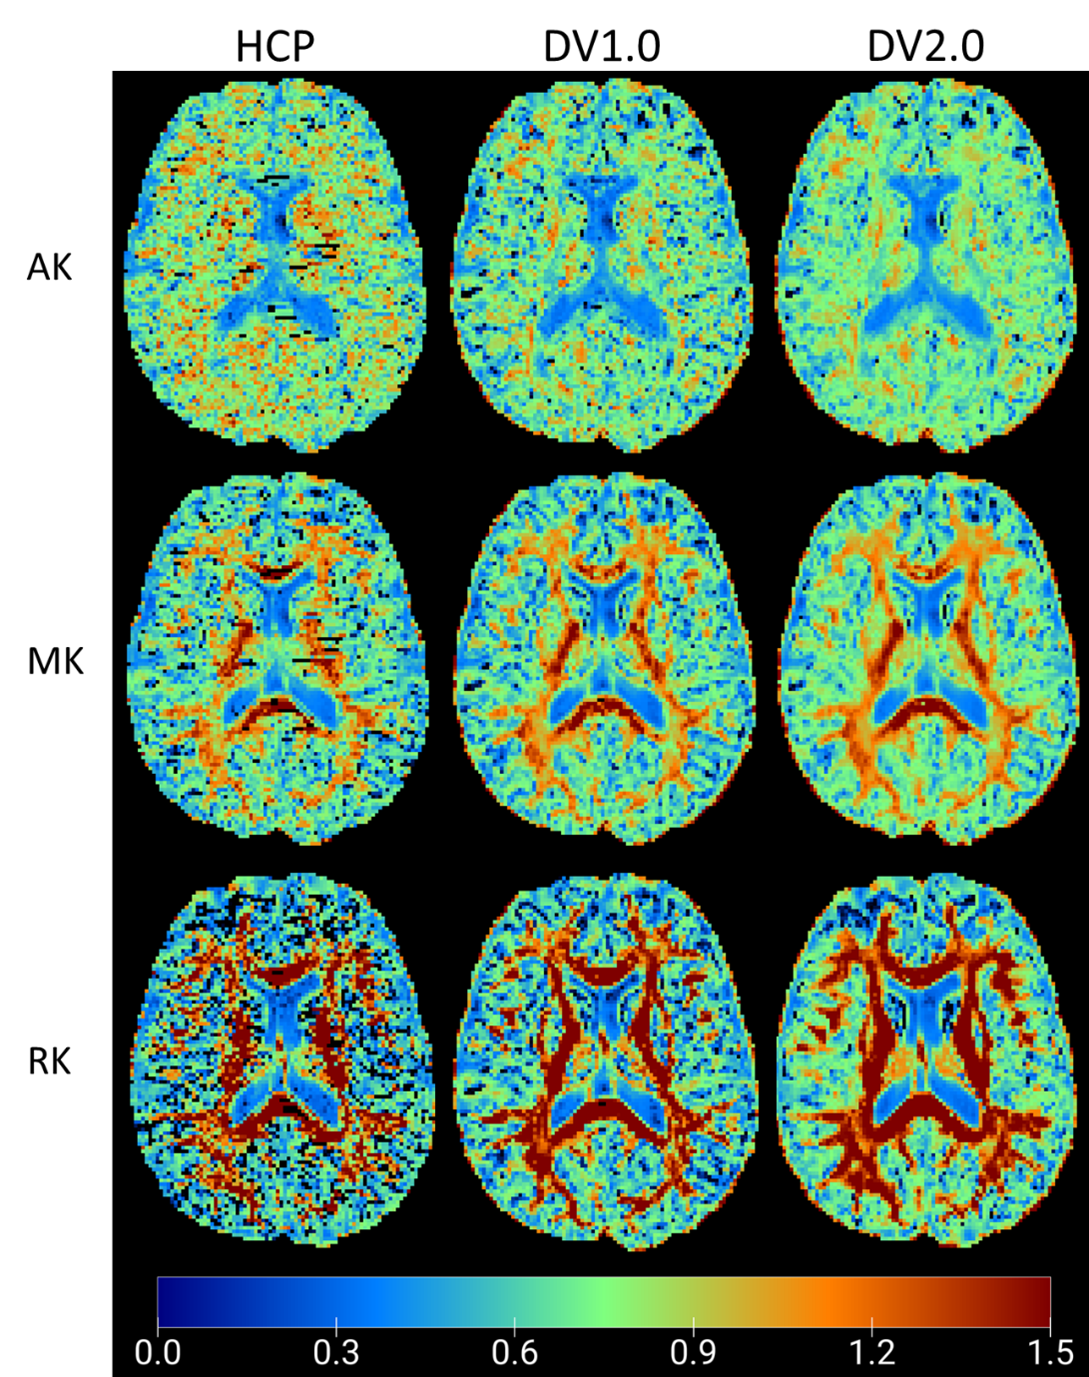
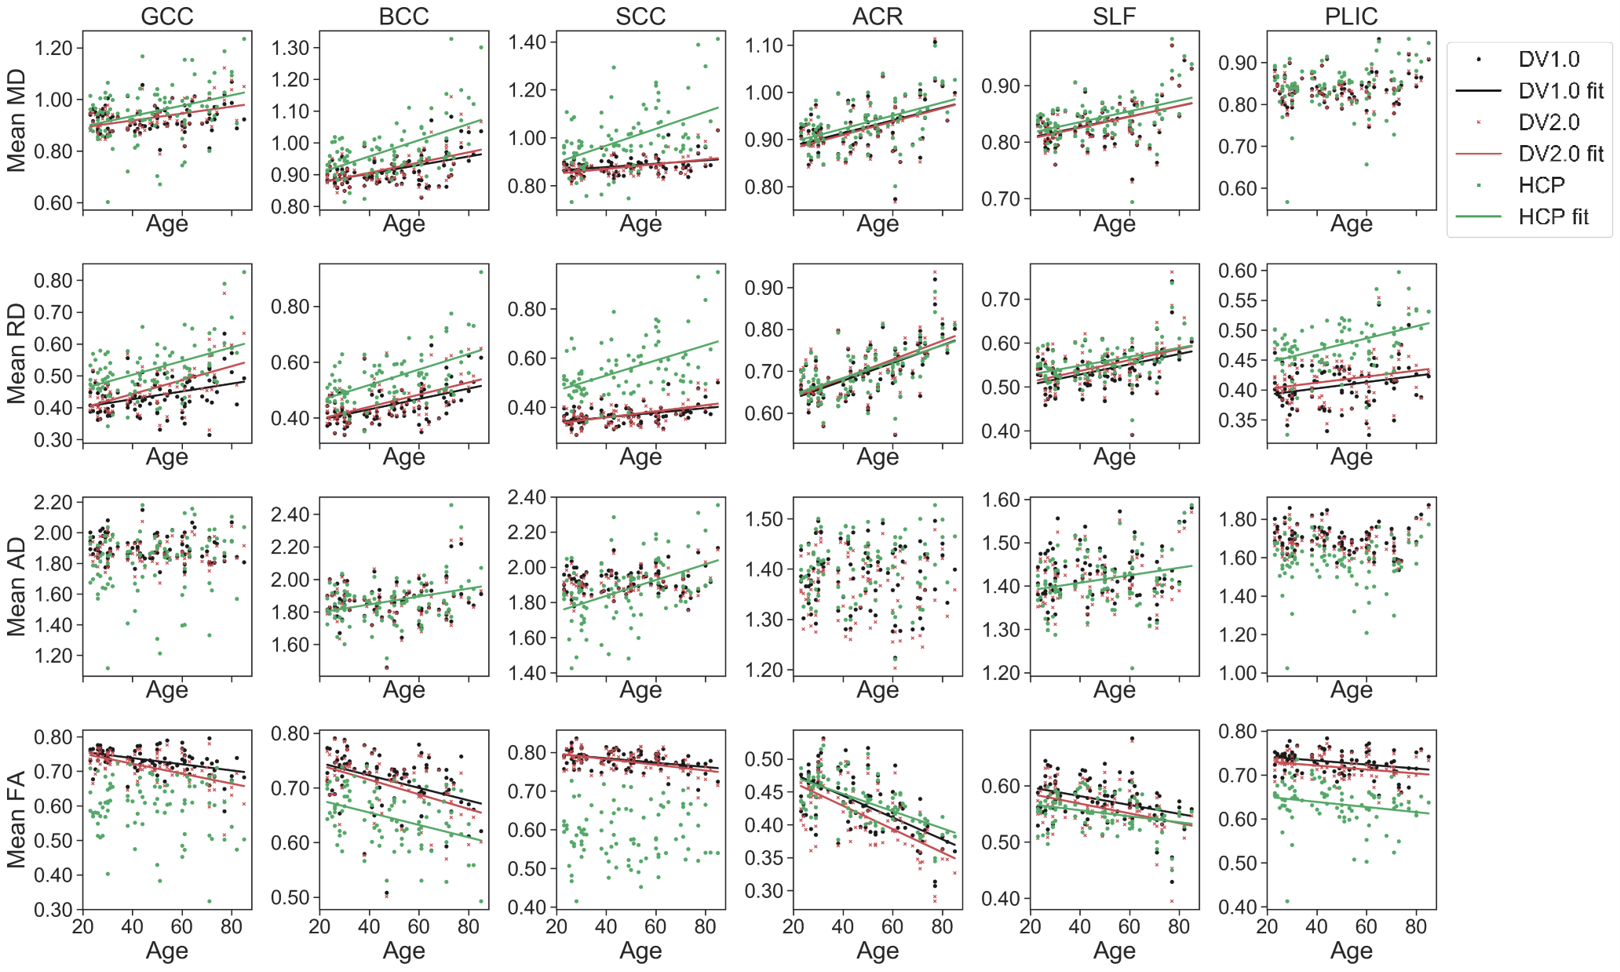
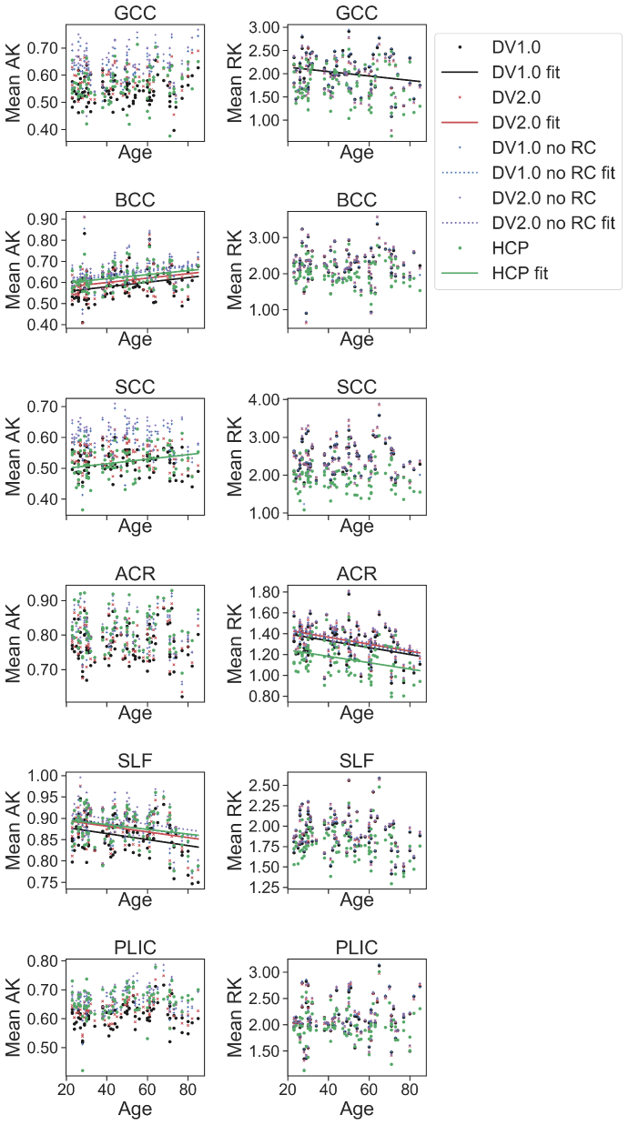
Figure 2 shows example parametric maps of AK, MK, and RK for a 27-year-old male. The HCP-derived kurtosis maps appear most noisy with notable black voxels neighboring corpus callosum (CC) and cerebrospinal fluid (CSF) boundary, while the DV2.0-derived kurtosis maps have the least black voxels. In Figure 3, noticeably higher MD, RD, and lower FA is observed in CC and PLIC using HCP pipeline compared to DV1.0 and DV2.0 pipeline, while this is not the case for the ACR and the SLF. Figure 4 shows notably lower MK and RK using HCP in comparison to DV1.0 and DV2.0 pipeline. Additionally, as shown in Figure 5, we observed significantly decreased AK with Rician bias correction, while there was not much effect in other metrics. As for observed correlations with age: all significant correlations were consistent across all pipelines and expected, except for positive correlation between AD and age in splenium and body CC and SLF only being observed for HCP.Discussion and Conclusion
Our results illustrate how preprocessing affects diffusion parameter estimation quantitatively, as well as change the outcome of observed statistically significant trends. At the level of parametric maps, the DV2.0 pipeline appears most robust with the least outliers. This improvement, particularly in the AK, can be explained by the targeted removal of Gibbs ringing, particularly near sharp edges such as CC/CSF boundary, even in case of Partial Fourier.At the population level, Gibbs ringing may also explain the biases in both DTI and DKI metrics in CC and PLIC (Figure 3-4), while the (opposite) effect of Rician bias is much smaller and only noticeable in the AK (Figure 5). Consistent among all pipelines, positive correlations in RD, MD and negative correlations in FA are observed with increasing age, which agrees with previous studies on aging using DTI/DKI7,8,9. Remarkably, positive correlations of AD increasing with age are observed in CC for HCP only, which seem spurious and related to increased Gibbs ringing, potentially due to age-related atrophy. On the other hand, differences between DV1.0 and DV2.0 are much smaller, yet also systematic, potentially due to further differences in Gibbs correction5,6 and improved denoising4.
Future work will explore reproducibility of these results, comparing DV1.0 and DV2.0 with the same denoising or Gibbs correction method to distinguish Gibbs correction effects from denoising effects, and studying correlation effects in grey matter regions.
Acknowledgements
Research was supported by the National Institute of Neurological Disorders and Stroke of the NIH under awards R01 NS088040 and R01 EB027075, and by the Hirschl foundation and was performed at the Center of Advanced Imaging Innovation and Research (CAI2R, www.cai2r.net), a Biomedical Technology Research Center supported by NIBIB with the award P41 EB017183.
References
- Glasser MF, Sotiropoulos SN, Wilson JA, Coalson TS, Fischl B, Andersson JL, Xu J, Jbabdi S, Webster M, Polimeni JR, Van Essen DC, Jenkinson M; WU-Minn HCP Consortium. The minimal preprocessing pipelines for the Human Connectome Project. Neuroimage. 2013 Oct 15;80:105-24. doi: 10.1016/j.neuroimage.2013.04.127. Epub 2013 May 11. PMID: 23668970; PMCID: PMC3720813.
- Ades-Aron, B., Veraart, J., Kochunov, P., McGuire, S., Sherman, P., Kellner, E., Novikov, D. S., & Fieremans, E. (2018). Evaluation of the accuracy and precision of the diffusion parameter EStImation with Gibbs and NoisE removal pipeline. NeuroImage, 183, 532–543. https://doi.org/10.1016/j.neuroimage.2018.07.066
- Pierpaoli C, Irfanoglu LW,MO, Barnett A, Basser P, Chang L-C, Koay C, Pajevic S, Rohde G, Sarlls J, and Wu M, 2010. TORTOISE: an integrated software package for processing of diffusion MRI data ISMRM, Stockholm, Sweden.
- M. Gavish and D. L. Donoho, "Optimal Shrinkage of Singular Values," in IEEE Transactions on Information Theory, vol. 63, no. 4, pp. 2137-2152, April 2017, doi: 10.1109/TIT.2017.2653801.5.
- Lee, H. H., Novikov, D. S., & Fieremans, E. Removal of Partial Fourier-Induced Gibbs (RPG) Ringing artifacts in MRI. Magnetic Resonance in Medicine. 2020. Under review.
- Kellner E, Dhital B, Kiselev VG, Reisert M. Gibbs-ringing artifact removal based on local subvoxel-shifts. Magn Reson Med. 2016 Nov;76(5):1574-1581. doi: 10.1002/mrm.26054. Epub 2015 Nov 24. PMID: 26745823.
- Maximov, II, Alnæs, D, Westlye, LT. Towards an optimised processing pipeline for diffusion magnetic resonance imaging data: Effects of artefact corrections on diffusion metrics and their age associations in UK Biobank. Hum Brain Mapp. 2019; 40: 4146– 4162. https://doi.org/10.1002/hbm.24691
- Falangola, M. F., Jensen, J. H., Babb, J. S., Hu, C., Castellanos, F. X., Di Martino, A., Ferris, S. H., & Helpern, J. A. (2008). Age-related non-Gaussian diffusion patterns in the prefrontal brain. Journal of magnetic resonance imaging : JMRI, 28(6), 1345–1350. https://doi.org/10.1002/jmri.21604
- Beck D, de Lange AG, Maximov II, Richard G, Andreassen OA, Nordvik JE, Westlye LT. White matter microstructure across the adult lifespan: A mixed longitudinal and cross-sectional study using advanced diffusion models and brain-age prediction. Neuroimage. 2020 Oct 9;224:117441. doi: 10.1016/j.neuroimage.2020.117441. Epub ahead of print. PMID: 33039618.
- J.L.R. Andersson, S. Skare, J. Ashburner. How to correct susceptibility distortions in spin-echo echo-planar images: application to diffusion tensor imaging. NeuroImage, 20(2):870-888, 2003.
- S.M. Smith, M. Jenkinson, M.W. Woolrich, C.F. Beckmann, T.E.J. Behrens, H. Johansen-Berg, P.R. Bannister, M. De Luca, I. Drobnjak, D.E. Flitney, R. Niazy, J. Saunders, J. Vickers, Y. Zhang, N. De Stefano, J.M. Brady, and P.M. Matthews. Advances in functional and structural MR image analysis and implementation as FSL. NeuroImage, 23(S1):208-219, 2004.
- Veraart, J., Novikov, D. S., Christiaens, D., Ades-Aron, B., Sijbers, J., & Fieremans, E. (2016). Denoising of diffusion MRI using random matrix theory. NeuroImage, 142, 394–406. https://doi.org/10.1016/j.neuroimage.2016.08.016
- Koay CG, Basser PJ, 2006. Analytically exact correction scheme for signal extraction from noisy magnitude MR signals. Journal of Magnetic Resonance 179, 317–322.
- J. Veraart, J. Sijbers, S. Sunaert, A. Leemans, B. Jeurissen, Weighted linear least squares estimation of diffusion MRI parameters: strengths, limitations, and pitfalls. NeuroImage 81, 335-346 (2013).
- Hua et al., Tract probability maps in stereotaxic spaces: analysis of white matter anatomy and tract-specific quantification. NeuroImage, 39(1):336-347 (2008)
- Andersson JLR, Jenkinson M, Smith S (2010) Non-linear registration, aka spatial normalisation.
- M.W. Woolrich, S. Jbabdi, B. Patenaude, M. Chappell, S. Makni, T. Behrens, C. Beckmann, M. Jenkinson, S.M. Smith. Bayesian analysis of neuroimaging data in FSL. NeuroImage, 45:S173-86, 2009
Figures