1695
Early prediction of cognitive deficits in very preterm infants using graph convolutional networks with brain structural connectome1Imaging Research Center, Department of Radiology, Cincinnati Children's Hospital Medical Center, Cincinnati, OH, United States, 2Department of Electrical Engineering and Computer Science, University of Cincinnati, Cincinnati, OH, United States, 3Deep MRI Imaging Inc., Lewes, DE, United States, 4The Perinatal Institute and Section of Neonatology, Perinatal and Pulmonary Biology, Cincinnati Children's Hospital Medical Center, Cincinnati, OH, United States, 5Department of Pediatrics, University of Cincinnati College of Medicine, Cincinnati, OH, United States
Synopsis
Up to 40% of very preterm infants (≤32 weeks’ gestational age) are identified with cognitive deficits at 2 years of age. Reproducible approaches that serve as neonatal prognostic tools are urgently needed for early treatment decision. We developed a graph convolutional network model to learn the latent topological features of brain structural connectome obtained at term-equivalent age for predicting cognitive deficits at 2 years corrected age in very preterm infants. The proposed model was able to identify infants at high-risk of cognitive deficits with a balanced accuracy of 78.5% and an area under the receiver operating characteristic curve of 0.78.
Introduction
A high prevalence of long-term cognitive deficit is well-established in very preterm infants (≤32 weeks’ gestational age), with 35-40% of this population identified with a deficit at 2 years of age.1,2 Yet, no robust prognostic screening technique is available following neonatal intensive care stay. Reproducible approaches that serve as neonatal prognostic tools are urgently needed for early treatment decision during the optimal neuroplasticity window when intervention is likely to be most effective. The human brain is a highly interconnected network with coordinated information transfer among individual brain regions.3 Diffusion tensor imaging (DTI) has been applied to construct such network representations of the brain, referred to as the brain structural connectome.4 Brain connectome has been acknowledged to play an important role in understanding human cognitive functions.5,6 Deep learning techniques, such as deep neural networks (DNN) and convolutional neural networks (CNN) have been utilized with brain structural connectome data in predicting later cognitive deficits for neonates.7-9 Recently, graph convolutional networks (GCN) models have shown great promise in learning latent topological features from data with graph/network structure,10 and has been successfully applied to enhance diagnosis of autism spectrum disorder and Alzheimer's disease.11,12 In this work, we developed a GCN model to predict cognitive deficits at 2 years corrected age using brain structural connectome obtained at term-equivalent age in very preterm infants.Methods
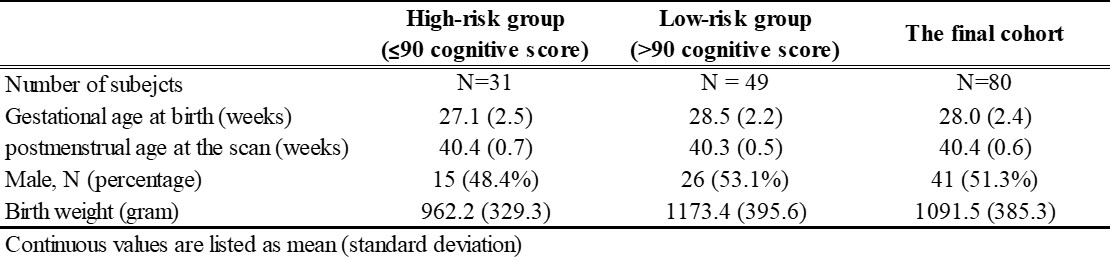
We prospectively enrolled a cohort of 110 very preterm infants from four NICUs. The Nationwide Children's Hospital (NCH) Institutional Review Board approved this study and written parental informed consent was obtained for every subject. Subjects were scanned on a 3T scanner (Skyra; Siemens Healthcare) at NCH using a 32-channel head coil. DTI was acquired with echo-planar imaging using the following parameters: b value: b800/b2000; repetition time (TR) = 6972/5073 ms; echo time (TE) = 88 ms; resolution = 2.0 × 2.0 mm2; slice thickness = 2.25 mm; 30 non-colinear diffusion-weighted directions. High-resolution T2-weighted anatomical images: TR/TE = 9500/147 ms, flip angle = 150°, resolution: 1.0 × 1.0 × 1.0 mm3.All subjects received standardized Bayley Scales of Infant and Toddler Development III test at 2 years corrected age. The Bayley-III cognitive scores are on a scale of 40 to 160. After excluding subjects with excessive motion imaging data and missing follow-up scores, the final study sample included 80 very preterm infants. A cutoff value of 90 was utilized to dichotomize the cohort into two groups: at high-risk (31 subjects) vs. at low-risk (49 subjects) to develop moderate/severe cognitive deficits. Detailed demographics of the subjects are listed in Table 1.
The obtained DTI data were preprocessed using FMRIB’s Diffusion Toolbox and UCLA Multimodal Connectivity Package.13 Briefly, head motion and eddy current artifacts were mitigated by aligning all images to their B0 image. The whole brain structural connectome was constructed based on 90 regions of interest (ROIs) defined from a neonatal Automated Anatomical Labeling atlas.14 The structural connectivities between each pair of ROIs were calculated as the mean fractional anisotropy of each voxel intersecting the tract and then averaged over all tracts between the two ROIs, resulting in a 90 × 90 symmetric adjacency matrix.
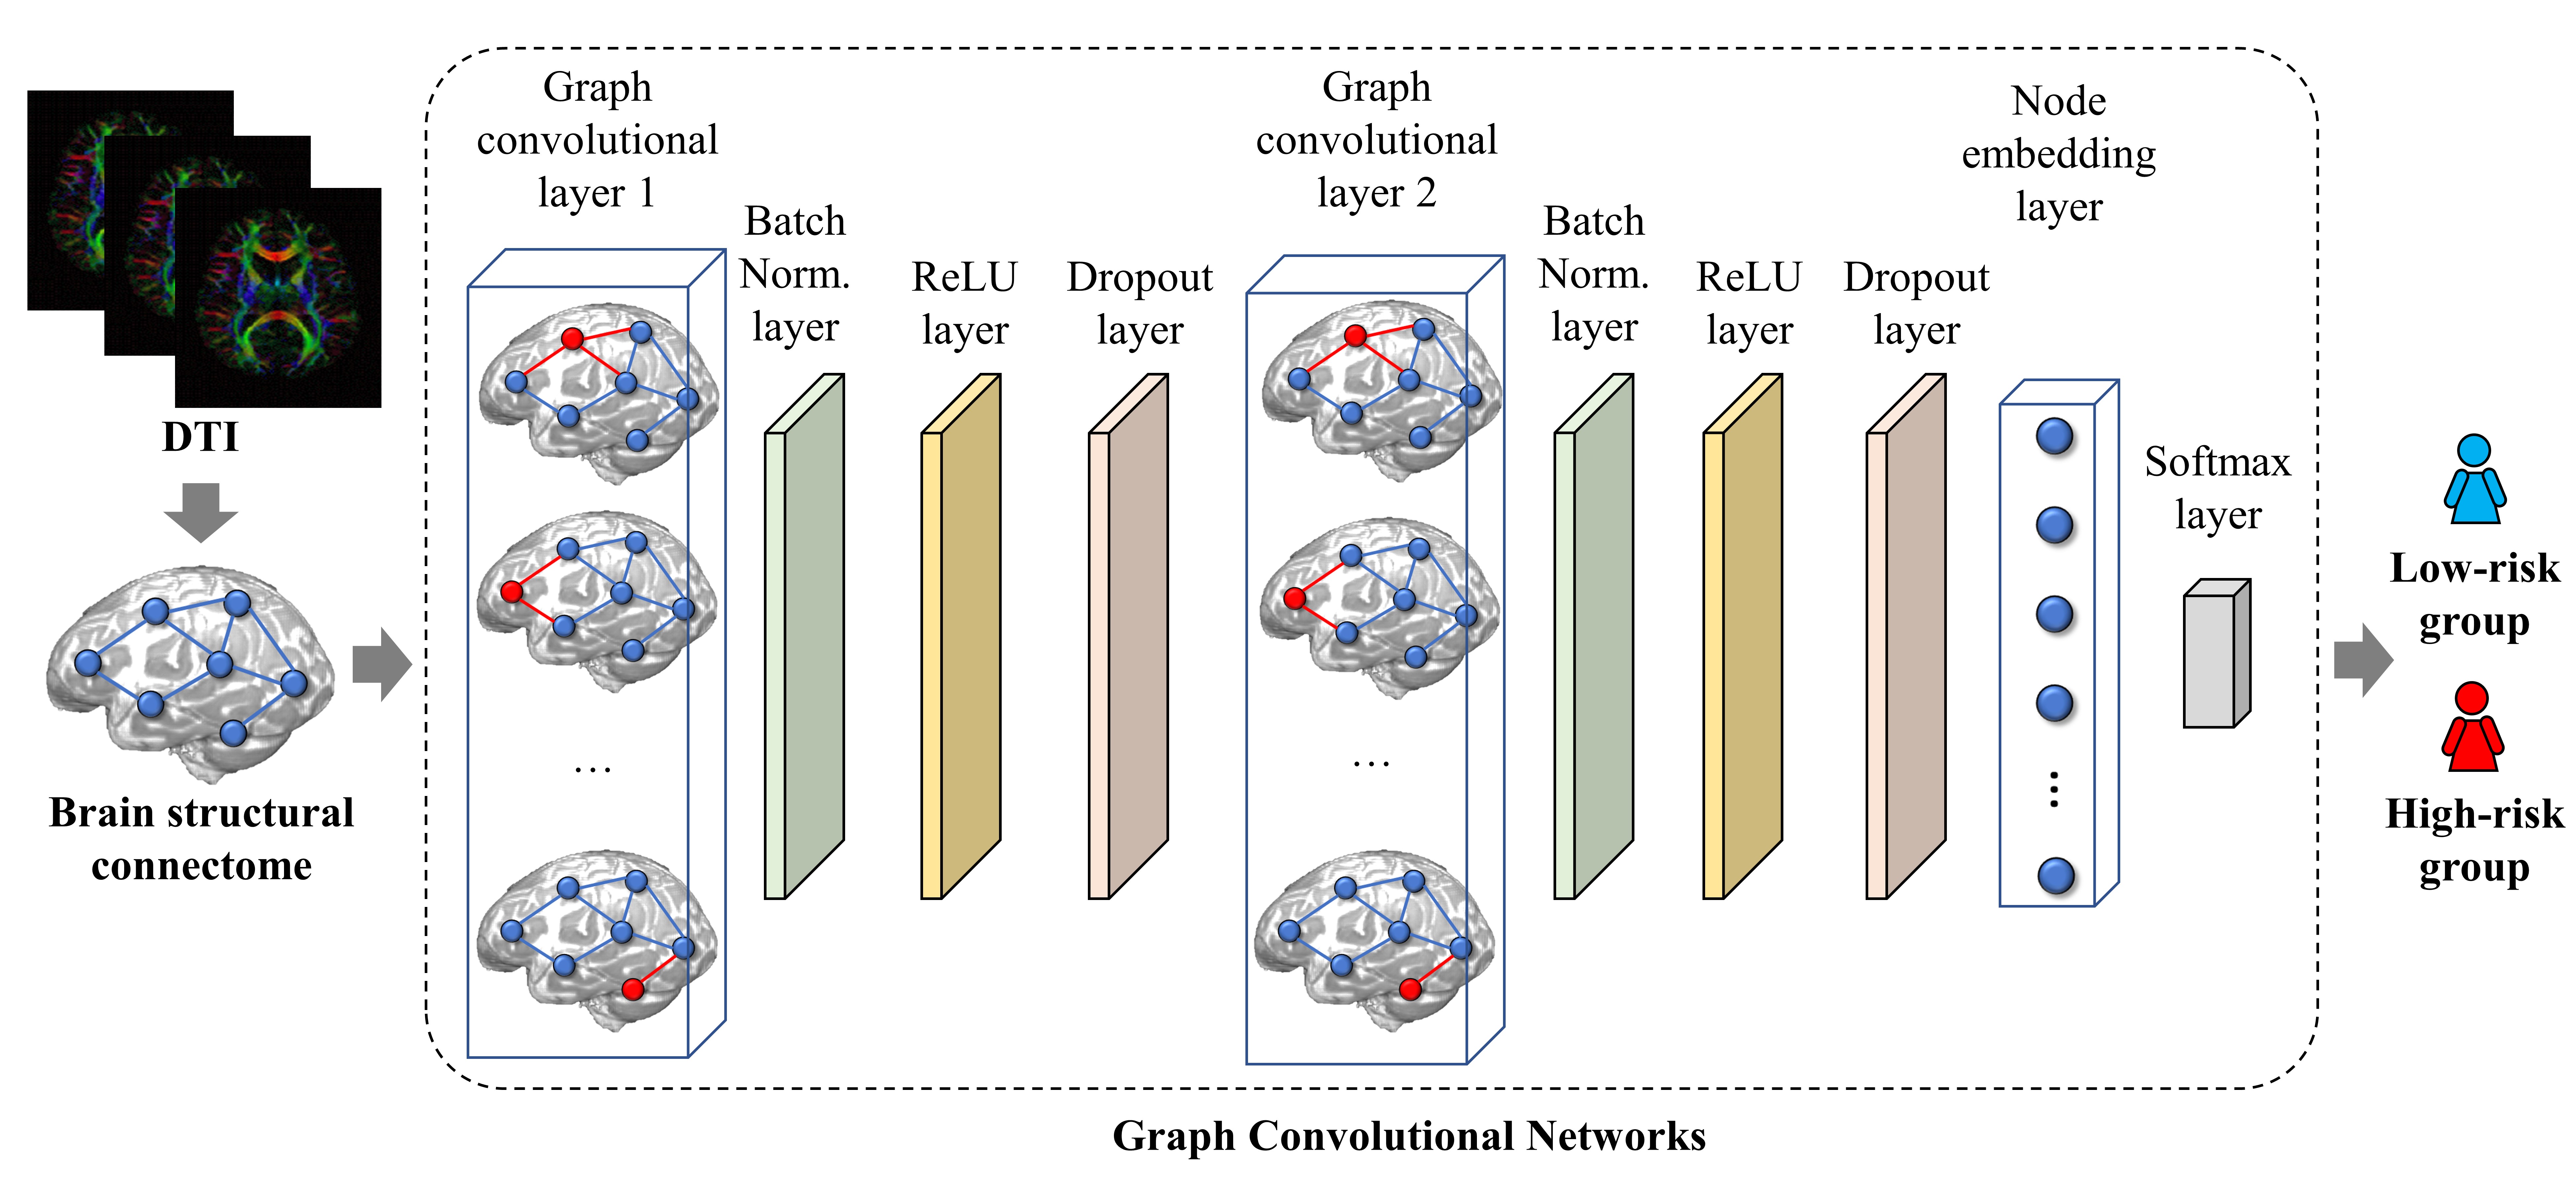
Figure 1 demonstrates the schematic diagram of the GCN model. The first layer in our model is a graph convolutional layer10 with 32 filters. Next, we designed a batch normalization layer to scale hidden unit shifts across hidden layers and speed up the training process. This is followed by a rectified linear unit (ReLU) layer and a dropout layer. We then appended a graph convolutional layer with 8 filters, batch normalization layer, ReLU layer, and dropout layer to the model. An average pooling layer was used as a node embedding layer to encode the node embedding matrix as a one-dimensional vector. Finally, a softmax layer is used as the output of the model. We evaluated the prediction performance through 5-fold cross-validation using the following metrics: balanced accuracy, sensitivity, specificity, and area under the receiver operating characteristic curve (AUC) for risk stratification. This process was repeated 50 times. We utilized the synthetic minority over-sampling technique15 to balance and augment the training data with a factor of 10 to mitigate the imbalanced dataset issue.
Results
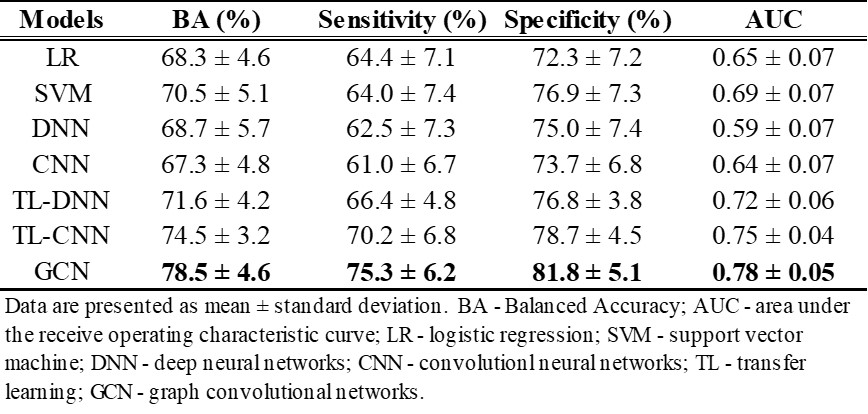
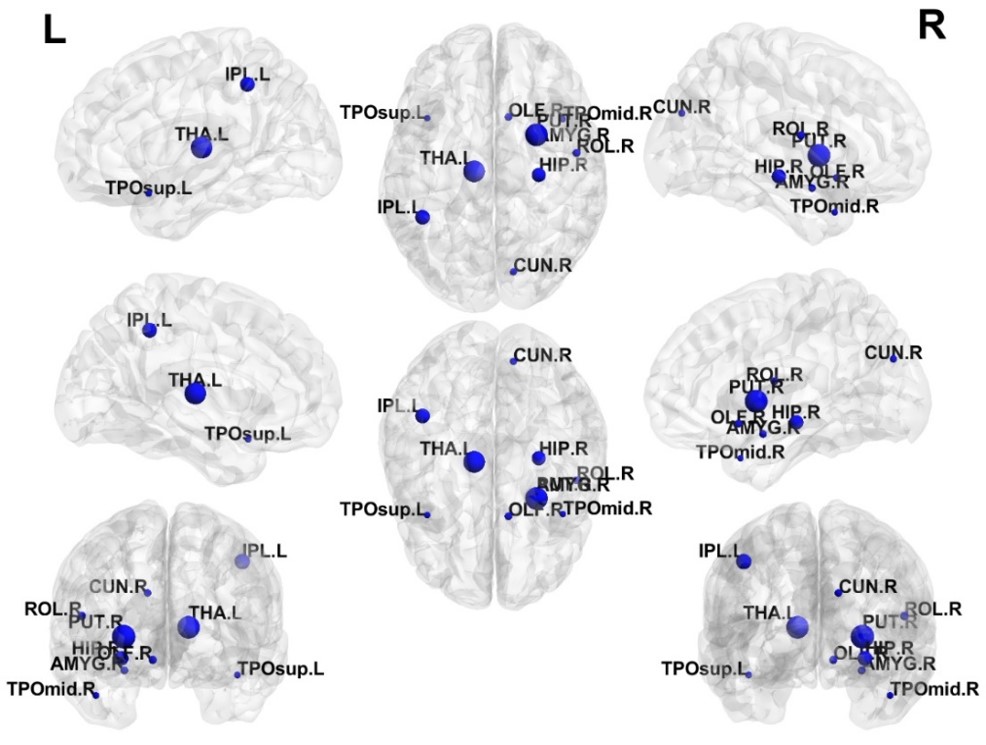
Table 2 shows that the GCN model was able to outperform peer models. Our GCN model was able to correctly identify subjects with high-risk of cognitive deficits with a mean balanced accuracy of 78.5% and an AUC of 0.78. The GCN also achieved better prediction performance than a transfer learning-enhanced CNN with an increase of 4% in balanced accuracy (p<0.001) and 0.03 in AUC (p=0.001). We ranked top 10 discriminative brain regions for predicting high-risk subjects using a connection weights method.16 (Figure 2)Discussion and Conclusion
Early diagnosis of cognitive deficits may be critical for improving very preterm infants’ quality of life. In this work, we developed a GCN model for the early prediction of cognitive deficits at 2 years of age in very preterm infants using brain structural connectome. The graph convolutional layer in GCN is the key to better decipher brain structural connectome. We demonstrated that the GCN model outperformed multiple peer models. Our future directions include the incorporation of multimodal features to improve prediction performance.Acknowledgements
This study was supported by the National Institutes of Health grants R21-HD094085, R01-NS094200, R01-NS096037, R01-EB029944, and a Trustee grant from Cincinnati Children’s Hospital Medical Center.References
1. Blencowe H, Cousens S, Oestergaard MZ, et al. National, regional, and worldwide estimates of preterm birth rates in the year 2010 with time trends since 1990 for selected countries: a systematic analysis and implications. Lancet. 2012;379(9832):2162-2172.
2. Martin JA HB, Osterman MJK. Births in the United States, 2018. National Center for Health Statistics. 2019;NCHS Data Brief, No 346. Hyattsville, MD.
3. Sporns O. The human connectome: origins and challenges. Neuroimage. 2013;80:53-61.
4. Bullmore E, Sporns O. Complex brain networks: graph theoretical analysis of structural and functional systems. Nature Reviews Neuroscience. 2009;10(3):186-198.
5. Park H-J, Friston KJS. Structural and functional brain networks: from connections to cognition. 2013;342(6158):1238411.
6. Petersen SE, Sporns OJN. Brain networks and cognitive architectures. 2015;88(1):207-219.
7. Kawahara J, Brown CJ, Miller SP, et al. BrainNetCNN: Convolutional neural networks for brain networks; towards predicting neurodevelopment. Neuroimage. 2017;146:1038-1049.
8. Girault JB, Munsell BC, Puechmaille D, et al. White matter connectomes at birth accurately predict cognitive abilities at age 2. NeuroImage. 2019;192:145-155.
9. Chen M, Li H, Wang J, et al. Early Prediction of Cognitive Deficit in Very Preterm Infants Using Brain Structural Connectome With Transfer Learning Enhanced Deep Convolutional Neural Networks. Front Neurosci. 2020;14:858.
10. Kipf TN, Welling M. Semi-supervised classification with graph convolutional networks. arXiv preprint arXiv:02907. 2016.
11. Parisot S, Ktena SI, Ferrante E, et al. Disease prediction using graph convolutional networks: Application to Autism Spectrum Disorder and Alzheimer’s disease. Medical image analysis. 2018;48:117-130.
12. Xing X, Li Q, Yuan M, et al. DS-GCNs: Connectome Classification using Dynamic Spectral Graph Convolution Networks with Assistant Task Training. Cerebral cortex (New York, NY : 1991). 2020.
13. Bassett DS, Brown JA, Deshpande V, Carlson JM, Grafton ST. Conserved and variable architecture of human white matter connectivity. Neuroimage. 2011;54(2):1262-1279.
14. Shi F, Yap PT, Wu G, et al. Infant brain atlases from neonates to 1- and 2-year-olds. PLoS One. 2011;6(4):e18746.
15. Chawla NV, Bowyer KW, Hall LO, Kegelmeyer WP. SMOTE: synthetic minority over-sampling technique. Journal of artificial intelligence research. 2002;16:321-357.
16. Olden JD, Jackson DA. Illuminating the “black box”: a randomization approach for understanding variable contributions in artificial neural networks. Ecological modelling. 2002;154(1-2):135-150.
Figures