1694
Multimodality data improve diagnostic efficacy in brain injury of premature infants with necrotizing enterocolitis1Department of Radiology, The Third Affiliated Hospital of Zhengzhou University, Zhengzhou, China, 2GE Healthcare, MR Research China, Beijing, China
Synopsis
Diffusion tensor imaging (DTI) can noninvasively and quantitatively evaluate the development of brain white matter and myelination degree of damaged nerve fiber bundles. Serum C-reactive protein (CRP) and procalcitonin (PCT) as inflammatory indicators can easily reflect the systemic inflammation of necrotizing enterocolitis (NCE) in children. This study shows that the DTI combined with serum CRP and PCT was more effective than a single indicator in the diagnosis of brain developmental disorders in preterm infants with NEC.
Introduction
Necrotizing enterocolitis (NEC) is a common and serious complication in preterm infants, and 43% of NEC infants have brain development disorders[1] . For children with brain development disorders, the diffusion tensor imaging(DTI)technique is more helpful in diagnose than the subjective ordinary plain scan [2]. The characteristic parameter anisotropy (FA) derived from DTI can sensitively reflect the anisotropy of the diffusion of water molecules in the white matter fiber bundles. The inflammatory cytokines in the intestine of children with NEC are transmitted to the brain through the "brain-gut axis", and inflammatory cells in the blood and cerebrospinal fluid will be increased [3]. C-reactive protein (CRP) and procalcitonin (PCT) are of high value in the clinical diagnosis of children with NEC [4]. At present, DTI technology alone or serum CRP and PCT have been used to test their diagnostic performance in NEC premature infants with brain development disorders. However, the performance of their combination on diagnosis has rarely been studied. The purpose of this study was to explore whether the the combination of DTI and serum CRP and PCT will achieve higher diagnostic efficacy.Material and Methods
In this study, 45 preterm infants including 20 preterm infants with NEC and 25 healthy preterm infants were recruited. MR scan was carried out on 3.0 T MR scanner (Pioneer, GE Healthcare, Milwaukee, WI), with T1WI, T2WI, DWI and DTI (TR= 2000 ms, TE = 2.32 ms, Directions=25, b value =0,1000 mm²/s). Then FA maps were generated from DTI images on GE AW 4.7 station. After that, 10 regions of interest (ROI) consisting of Slenium of the corpus callosum, Perior limbs of the internal capsule, lenticular nucleus, caudate nucleus, thalamus, frontal lobe, parietal lobe, occipital lobe, cerebral peduncle, and cerebellum are manually outlined. Take average after three measurements for each value. In addition, enzyme-linked immunosorbent method is used to detect the serum CRP and PCT of premature infants. Data analysis was performed on SPSS21.0 software. Independent sample t-test and Mann-Whitney U test were used for between-group analyses. The ROC curve was generated to evaluate the diagnostic value of each index for NCE brain injury. P<0.05 was considered statistically significant.Results and discussion
In the NEC group, the FA values of splenium of the corpus callosum, Posterior limbs of the internal capsule, the lenticular nucleus, the frontal lobe, and cerebral peduncle were lower than those in the control group (P<0.05), as shown in table 1 and Figure 1. The possible reason is that NEC children's brain is damaged through the brain-gut axis mechanism, and the damage location conforms to the brain development, thus, from back to front, bottom to top, from proximal to distal[5, 6] . The CRP and PCT levels of the children in the NEC group were all higher than those in the control group (P<0.05) as shown in Figure 2. This may be due to the severe systemic inflammation. With a large number of inflammatory cytokines in the blood and cerebrospinal fluid, the levels of CRP and PCT will be increased, which in turn associated with NEC brain damage [7]. The AUC of the combination of FA and CRP and PCT in the diagnosis of brain developmental disorders in preterm infants with NEC is 0.984 with the sensitivity 98% and the specificity 95%, which are greatly higher than those of single indicator (0.762, 0.864, 0.705, respectively, P<0.05) in Figure 3.Conclusion
The combination of FA and serum CRP and PCT shows better diagnostic performance than a single indicator. The combination of imaging and clinical indicators may provide a more comprehensive diagnosis.Acknowledgements
The National Natural Science Foundation of China (grant 81870983).References
1.Matei A, Montalva L, Goodbaum A,et al.Neurodevelopmental impairment in necrotising enterocolitis survivors: systematic review and meta-analysis[J]. Archives of disease in childhood. Fetal and neonatal edition. 2020;105(4):432-9.
2.Feng K, Rowell A, Andres A, et al. Diffusion Tensor MRI of White Matter of Healthy Full-term Newborns: Relationship to Neurodevelopmental Outcomes[J]. Radiology. 2019;292(1):179-87.
3.Pammi M, De Plaen I, Maheshwari A. Recent Advances in Necrotizing Enterocolitis Research: Strategies for Implementation in Clinical Practice[J]. Clinics in perinatology. 2020;47(2):383-97.
4. Duci M, Fascetti-Leon F, Erculiani M, et al. Neonatal independent predictors of severe NEC[J]. Pediatric surgery international. 2018;34(6):663-9.
5.Niemarkt H, De Meij T, van Ganzewinkel C, et al. Necrotizing Enterocolitis, Gut Microbiota, and Brain Development: Role of the Brain-Gut Axis[J]. Neonatology. 2019;115(4):423-31.
6.Guo T, Duerden E, Adams E, et al. Quantitative assessment of white matter injury in preterm neonates: Association with outcomes[J]. Neurology. 2017;88(7):614-22.
7.Ira, A.-C., Necrotizing Enterocolitis and Neurodevelopmental Outcome[J]. Clinics in perinatology, 2018; 45(3): 453-466.
Figures
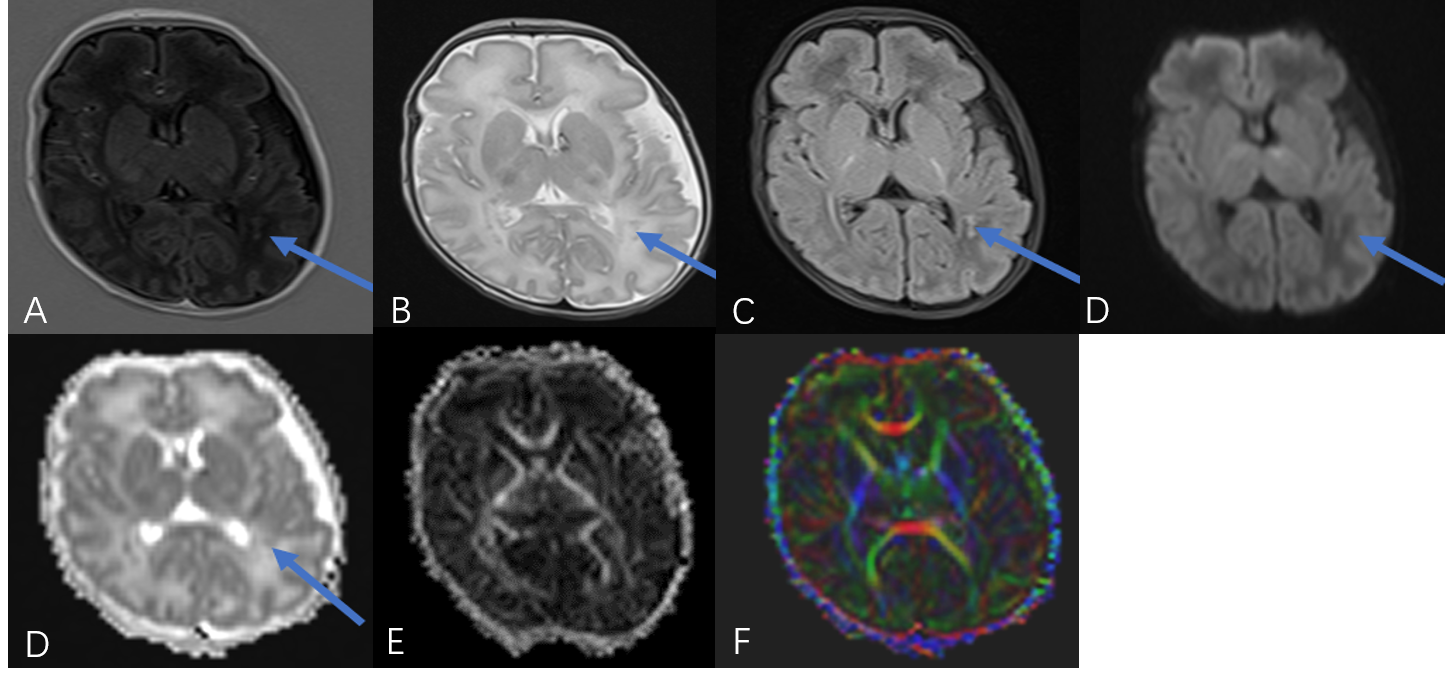
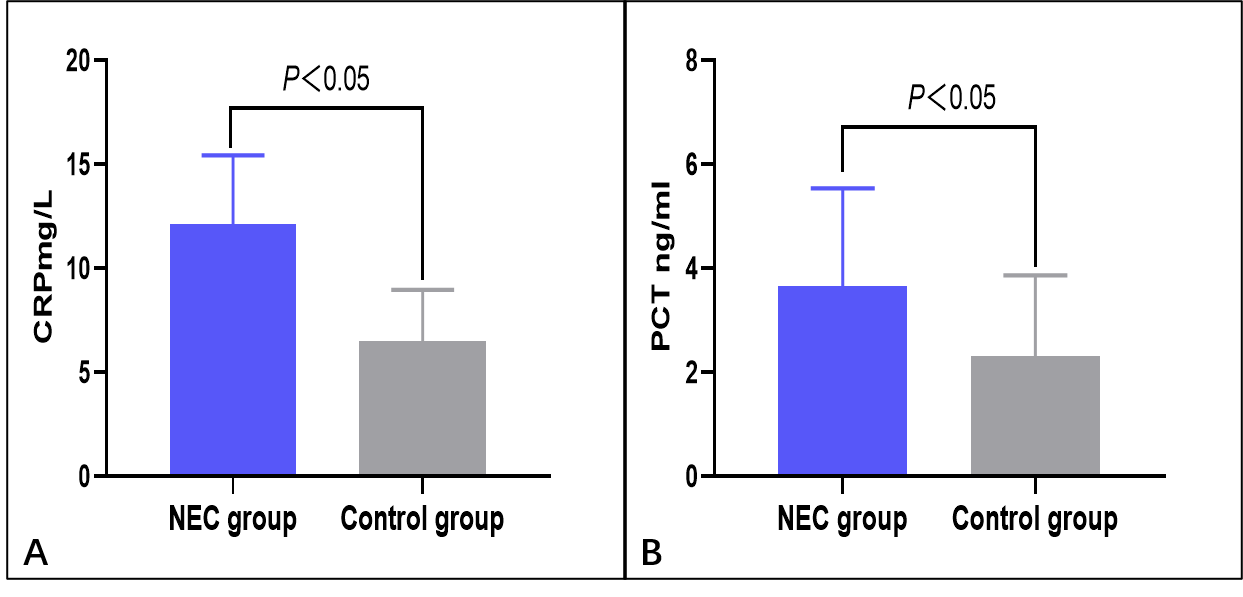
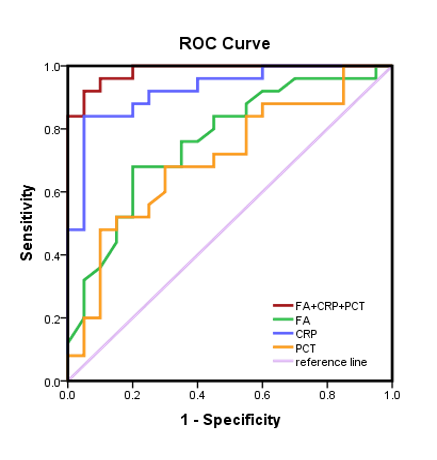
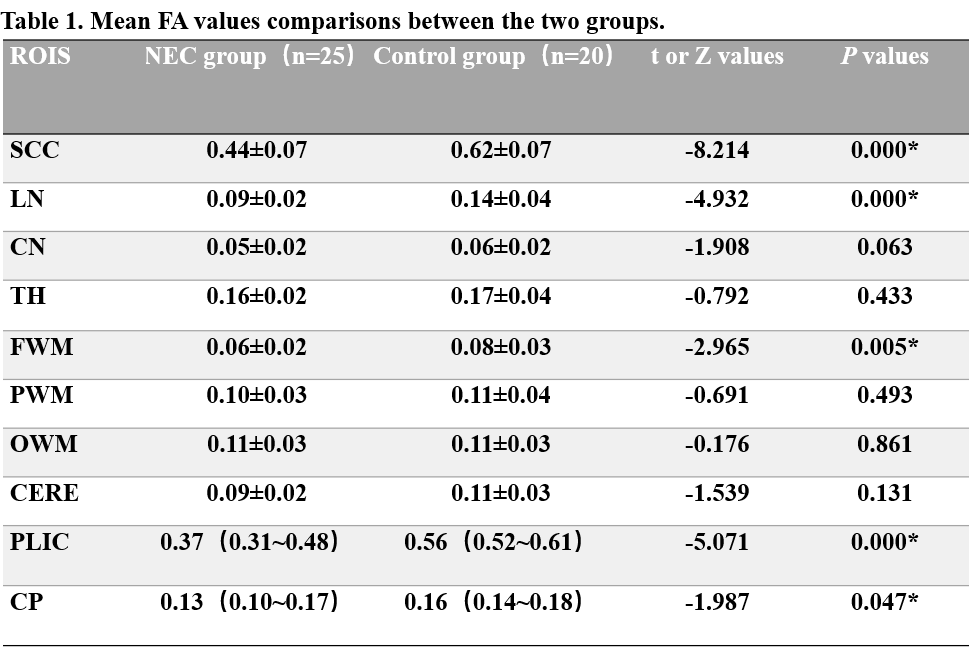
Table 1:ROI = region of interest; SCC = splenium of the corpus callosum; LN = lentiform nucleus; CN=caudate nucleus; TH= thalamus; FWM= Frontal white matter; PWM= Parietal white matter; OWM= Occipital white matter; CERE= cerebellum; PLIC = posterior limbs of the internal capsule; CP=cerebral peduncle.* indicates P < 0.05