1692
Characterization of individual DTI measurement age trajectories in a longitudinal study of autism spectrum disorder1UW-Madison, Madison, WI, United States, 2University of Utah, Salt Lake City, UT, United States, 3Harvard Medical School, Boston, MA, United States, 4Brigham Young University, Provo, UT, United States
Synopsis
The purpose of this analysis is to investigate the patterns of individual rates of change of diffusion tensor imaging (DTI) measures computed from a longitudinal study of autism spectrum disorder (ASD). The mean value and temporal rates of change of DTI measures were estimated for regions of white matter for individual subjects. The distributions of the individual longitudinal slopes versus mean measures for ASD and typically developing controls (TDC) were mapped and compared, revealing group differences in the distributions with generally greater heterogeneity in the ASD group.
INTRODUCTION
It is widely accepted that autism spectrum disorder (ASD) is a heterogeneous disorder with highly variable outcomes, while individuals with ASD show greater measurement heterogeneity than typically developing controls (TDC). For example, increased inter-regional heterogeneity of cross-sectional diffusion tensor imaging (DTI) measures in ASD was demonstrated using multivariate statistics1. However, this previous work looked at these cross-sectional effects at the overall group level and not necessarily at an individual level. Nevertheless, measurements of individual variation in ASD may help identify phenotypical subgroups and guide the development of personalized therapies or interventions. The purpose of this analysis is to investigate the patterns of individual rates of change of DTI based measures computed from a longitudinal study on autism.METHODS
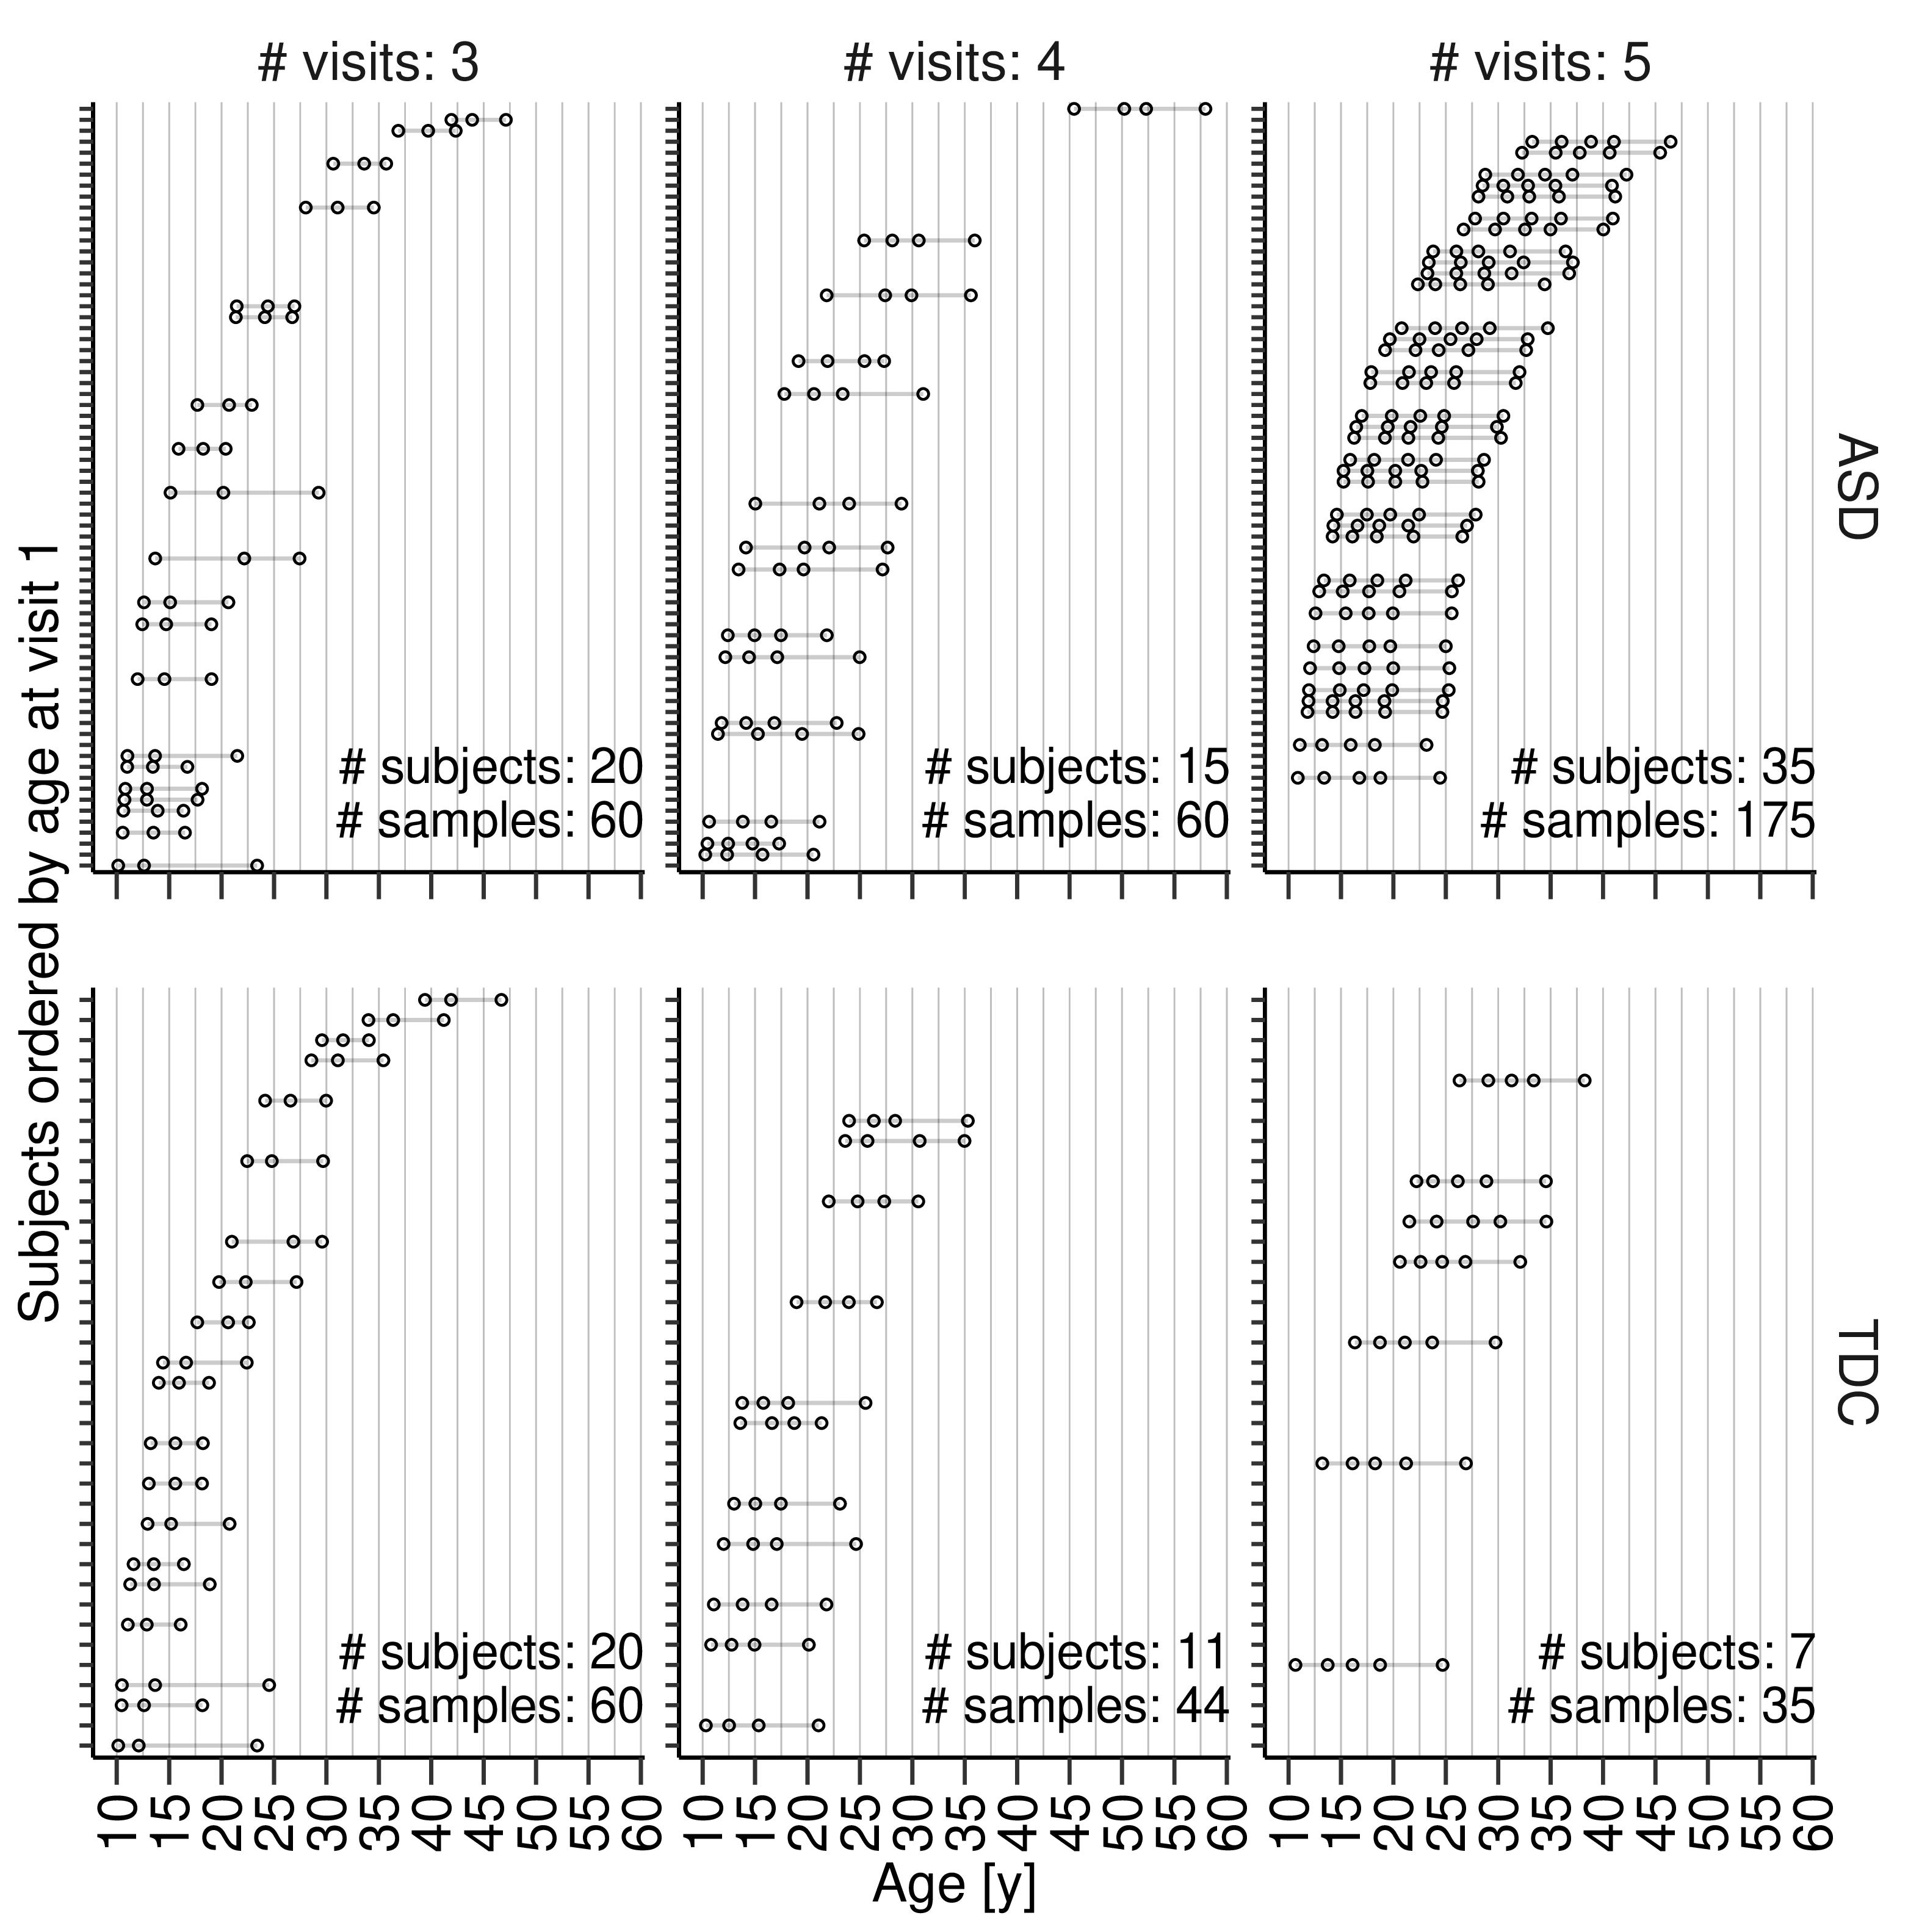
Data: A total of n=108 individuals (ASD: 70, TDC: 38) with longitudinal imaging data from at least three timepoints and up to five timepoints in an accelerated longitudinal design were analyzed in this study (Fig. 1). Diffusion weighted data were acquired with b=1000 s·mm-2 ,12 directions, and 2×2×2.5 mm resolution.Preprocessing: DTI data was preprocessed using an in-house pipeline based on the DESIGNER2 guidelines, utilizing functions from DIPY toolkit3, FMRIB Software Library (FSL)4, Analysis of Functional Neuroimages (AFNI)5, and MRtrix6 software packages. Processing included removal of Rician noise6, removal of Gibbs ringing artifact7, and correction for eddy-currents and motion using FSL’s EDDY tool8 with outlier replacement9 enabled. FSL’s ‘eddy-quad’ was used to identify and remove outliers. Diffusion tensors were calculated using the RESTORE algorithm implemented in DIPY. Median FA, MD, RD values from the JHU white matter atlas regions were extracted by registering the atlas to the population average and then inverse warping it to the individual subject’s native space.
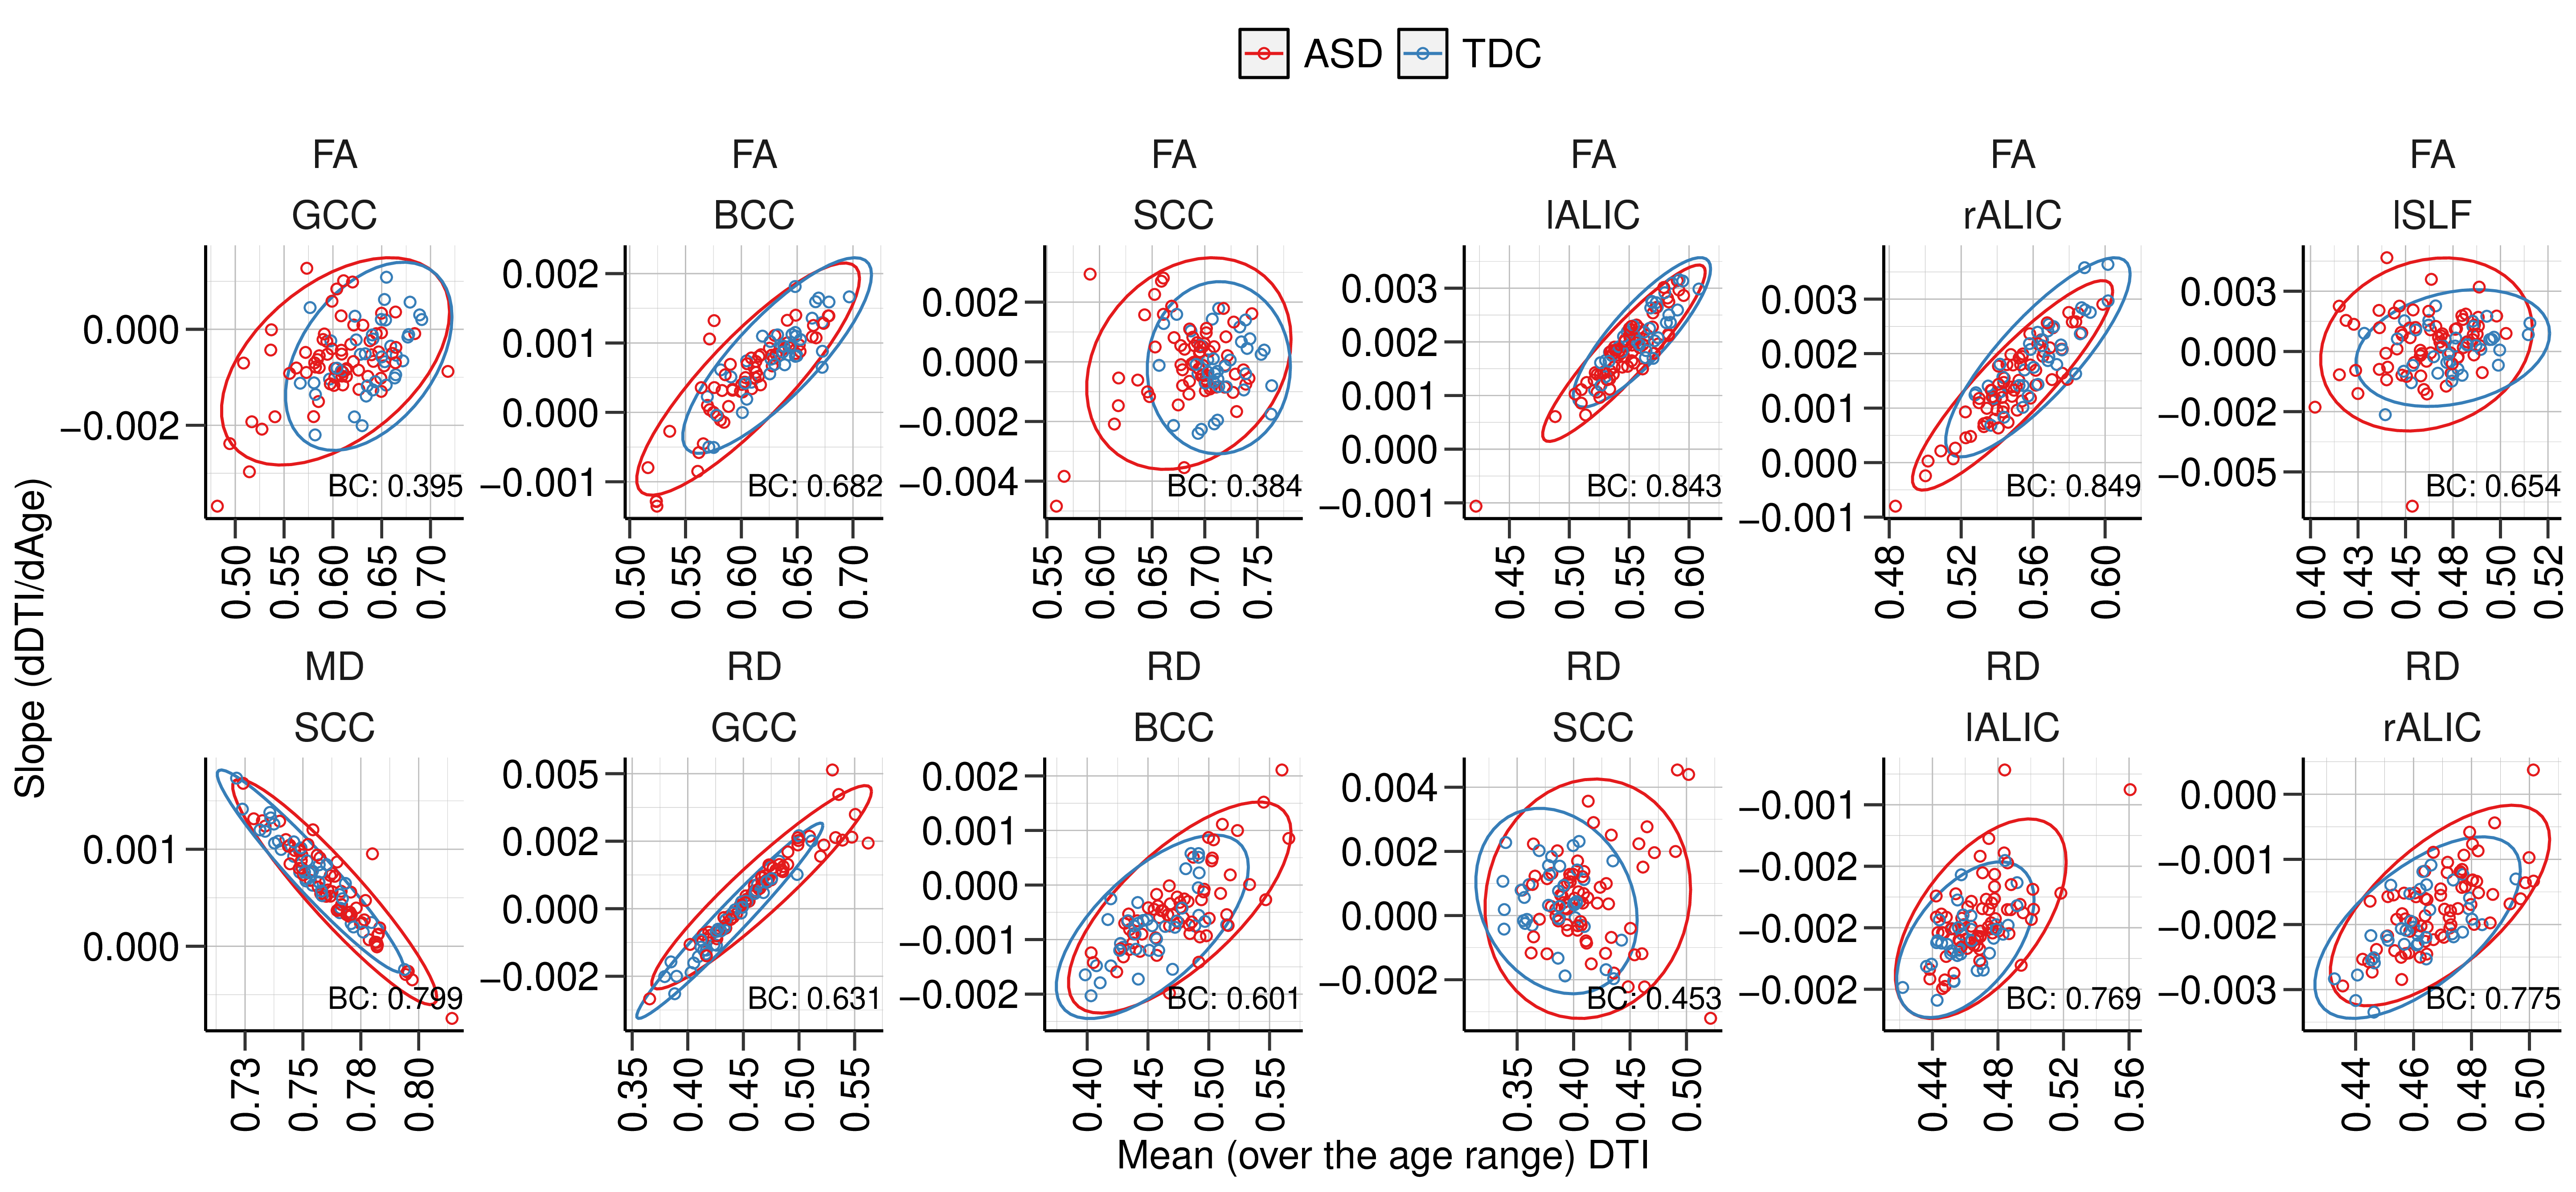
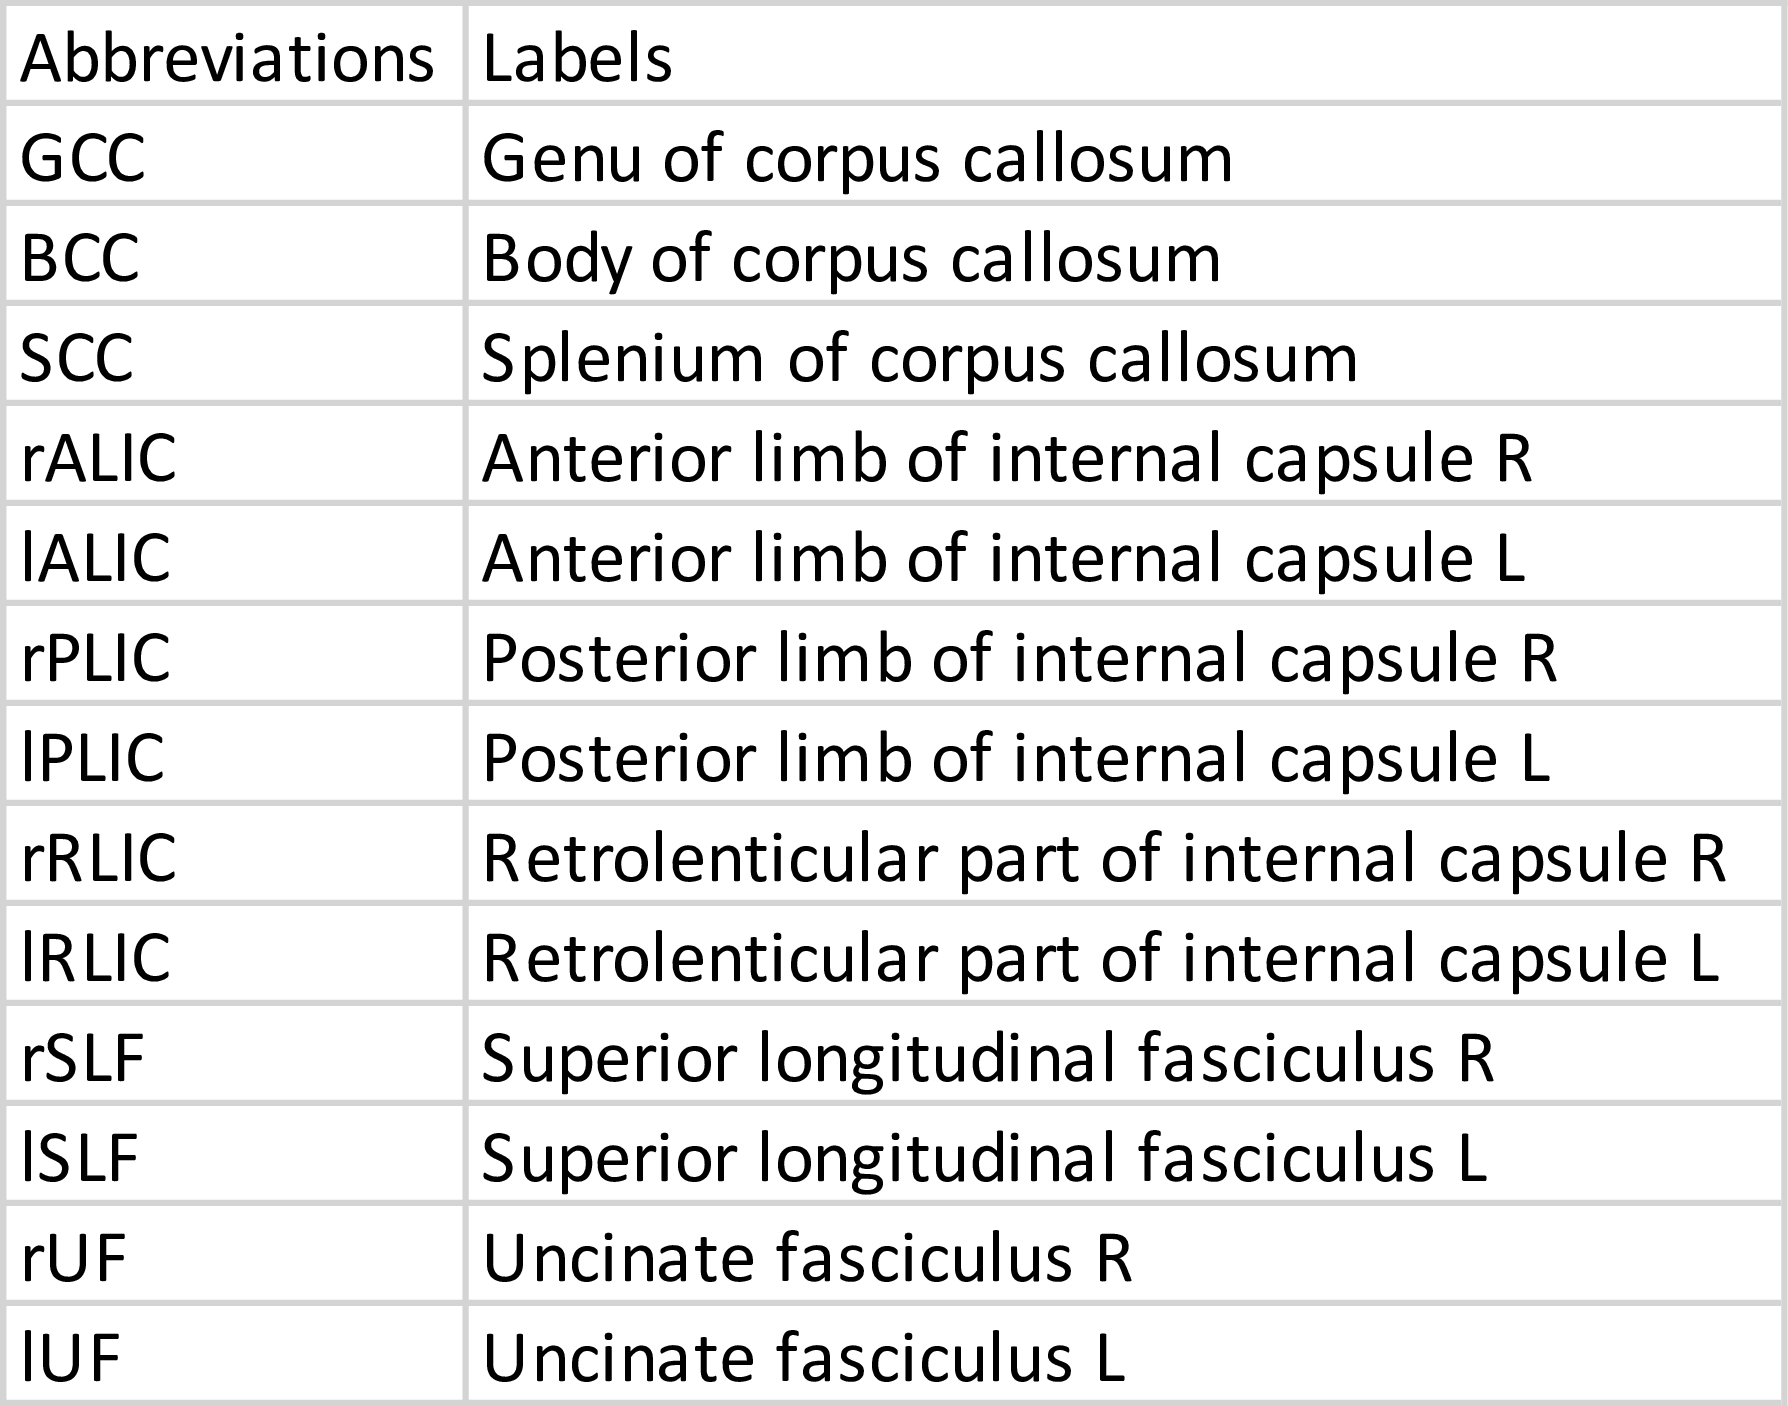
Analysis: Thirteen JHU regions (Table 1) were selected based on a priori anatomical knowledge. For each of the thirteen regions, samples with median MD > 0.85 or FA < 0.25 were excluded as outliers. The annual rates of change of median FA, MD and RD in regions of the JHU white matter atlas were estimated using a linear mixed model approach which removes bias in the estimates. Gaussian contours (at 2 standard deviations) were overlaid on the distributions to visually assess the normality and spread of the bivariate slope-mean distributions. To assess the amount of overlap between the bivariate (slope-mean) distributions of ASD and TDC, the Bhattacharyya coefficient was computed per region and measure. Hotelling T2 testing was used to compute the statistical significance. False discovery rate (FDR) correction for the multiple comparisons (a total of 39 = (13 regions x 3 DTI measures)) was performed using the Benjamini Hochberg (BH) procedure11.
RESULTS
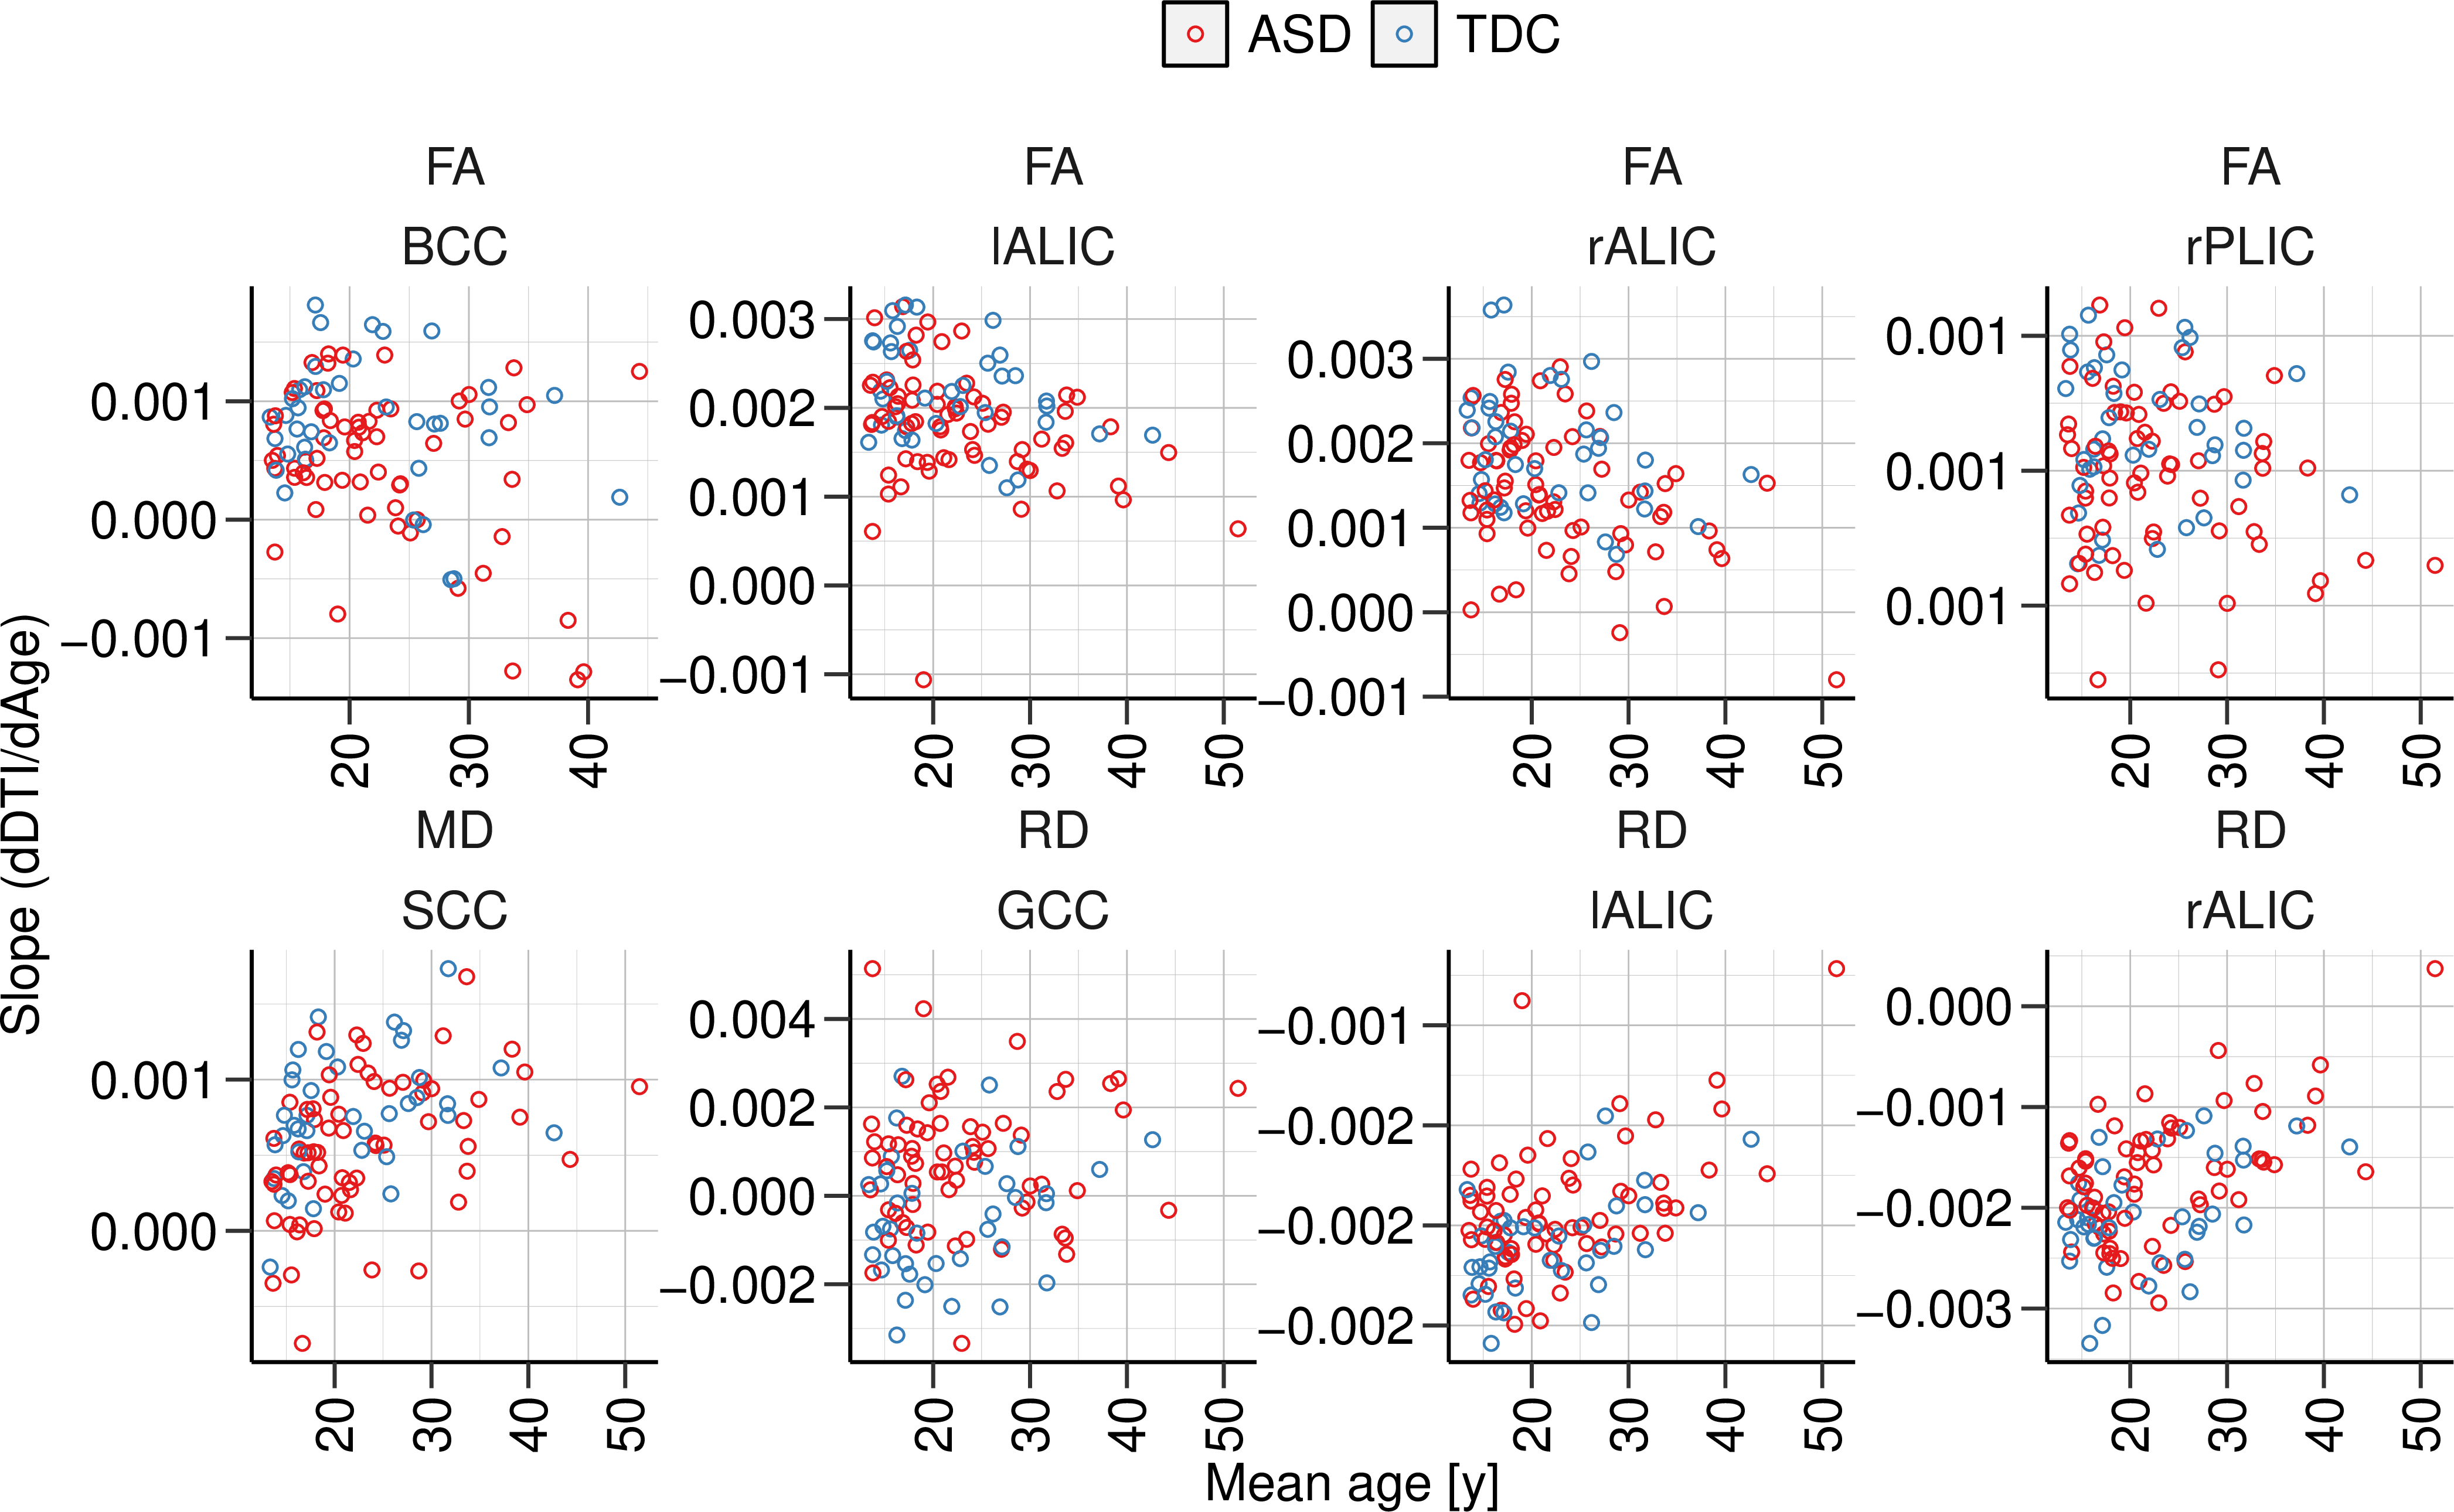
Plots of rates of change for DTI measures versus age and mean DTI values versus age are shown in Figs. 2 and 3, respectively, for the regions. The rates of change (individual model slopes) are also mapped versus the mean DTI value for all individuals in Fig. 4. Gaussian contours (at 2 standard deviations) are shown for the ASD and TDC groups. It Is clear that there are differences in the distributions with greater heterogeneity in the ASD group.DISCUSSION
The results are consistent with the known literature especially in showing that the corpus callosum is an important white matter pathway in contrasting ASD and TDC. The left but not right, superior longitudinal fasciculus was statistically significant indicating consistency with the language related findings in the autism literature. It is also interesting to note that FA and RD were the more sensitive than MD. While the rates of change alone might not be distinguishing between the ASD and TDC populations, when they are lifted to the bivariate space of temporal rate and temporal mean, we are able to elucidate the heterogeneity differences between the groups.CONCLUSION
Annual rates of change in DTI (slopes) derived from longitudinal data along with mean DTI over time provide useful markers when looked at jointly. It is interesting that there is more individual variability in the ASD group, not just group differences. Ultimately, this may help to identify phenotypes of ASD with faster or slower changes, etc. Currently, mixed models were used with only age and an overall intercept as fixed terms in the slope models and only an overall intercept as a fixed term for the mean models. Future research entails investigating the variability in estimation of the slopes and means and the best way to minimize systematic biases due to additional confounding fixed factors.Acknowledgements
Research was supported by the National Institute of Mental Health of the National Institutes of Health under Award Number R01MH080826 and also the support from an NIH core grant to the Waisman Center from the National Institute of Child Health and Human Development (IDDRC U54 HD090256). The content is solely the responsibility of the authors and does not necessarily represent the official views of the National Institutes of Health.References
1. Dean DC, 3rd, Lange N, Travers BG, Prigge MB, Matsunami N, Kellett KA, Freeman A, Kane KL, Adluru N, Tromp DP, Destiche DJ, Samsin D, Zielinski BA, Fletcher PT, Anderson JS, Froehlich AL, Leppert MF, Bigler ED, Lainhart JE, Alexander AL. Multivariate characterization of white matter heterogeneity in autism spectrum disorder. NeuroImage Clinical. 2017;14:54-66
2. Ades-Aron B, Veraart J, Kochunov P, McGuire S, Sherman P, Kellner E, Novikov DS, Fieremans E. Evaluation of the accuracy and precision of the diffusion parameter EStImation with Gibbs and NoisE removal pipeline. NeuroImage. 2018 Dec 1;183:532-43.
3. Garyfallidis E, Brett M, Amirbekian B, Rokem A, Van Der Walt S, Descoteaux M, Nimmo-Smith I. Dipy, a library for the analysis of diffusion MRI data. Frontiers in neuroinformatics. 2014 Feb 21;8:8.
4. Jenkinson M, Beckmann CF, Behrens TE, Woolrich MW, Smith SM. FSL. Neuroimage. 2012 Aug 15;62(2):782-90.
5. Cox RW. AFNI: software for analysis and visualization of functional magnetic resonance neuroimages. Computers and Biomedical research. 1996 Jun 1;29(3):162-73.
6. Tournier JD, Smith R, Raffelt D, Tabbara R, Dhollander T, Pietsch M, Christiaens D, Jeurissen B, Yeh CH, Connelly A. MRtrix3: A fast, flexible and open software framework for medical image processing and visualisation. NeuroImage. 2019 Nov 15;202:116137.
7. Veraart J, Novikov DS, Christiaens D, Ades-Aron B, Sijbers J, Fieremans E. Denoising of diffusion MRI using random matrix theory. Neuroimage. 2016;142:394-406.
8. Kellner E, Dhital B, Kiselev VG, Reisert M. Gibbs‐ringing artifact removal based on local subvoxel‐shifts. Magnetic resonance in medicine. 2016 Nov;76(5):1574-81.
9. Andersson JLR, Sotiropoulos SN. An integrated approach to correction for off-resonance effects and subject movement in diffusion MR imaging. Neuroimage. 2016;125:1063-78.
10. Andersson JLR, Graham MS, Zsoldos E, Sotiropoulos SN. Incorporating outlier detection and replacement into a non-parametric framework for movement and distortion correction of diffusion MR images. Neuroimage. 2016;141:556-72.
11. Benjamini Y, Hochberg Y. Controlling the false discovery rate: a practical and powerful approach to multiple testing. Journal of the Royal statistical society: series B (Methodological). 1995 Jan;57(1):289-300.
Figures