1690
Microstructural characterization of auditory pathway developmental trajectory from infancy through adolescence1USC Mark and Mary Stevens Institute for Neuroimaging and Informatics, USC Keck School of Medicine, Los Angeles, CA, United States, 2Chan Division of Occupational Science and Occupational Therapy, USC Herman Ostrow School of Dentistry, Los Angeles, CA, United States, 3Division of Pediatrics, USC Keck School of Medicine, Los Angeles, CA, United States, 4USC Caruso Department of Otolaryngology – Head and Neck Surgery, USC Keck School of Medicine, Los Angeles, CA, United States
Synopsis
Auditory perception is established through experience-dependent stimuli during sensitive developmental periods; however, little is known regarding the structural development of the central auditory pathway. The present study quantified the magnitude and timing of regional microstructural development of the auditory pathway from the brainstem to the auditory cortex from infancy through adolescence using DTI and NODDI metrics. We found spatially varying white matter maturation along the length of the tract, with inferior brainstem regions developing earliest. These results help to characterize the processes that give rise to functional auditory processing and may provide a baseline for detecting abnormal development.
Introduction
The central auditory lemniscal pathway conveys spectrotemporal aural information from sensory receptors in the inner ear to the auditory cortex (AC) in the superior temporal gyrus (STG) through multi-synaptic connections in the brainstem and thalamus. Functional auditory processing is established early during sensitive developmental periods when the AC is highly plastic [1] and knowledge of the developmental timing of pathways that facilitate transmission of auditory sensory information is of clinical importance. In children with congenital sensorineural hearing loss, early cochlear implantation during sensitive periods of plasticity restores normal development of central auditory perception [2]. However, little is known regarding the magnitude and timing of auditory white matter processes. The purpose of this study is to characterize the regional developmental trajectories of the auditory pathway from the cochlear nerve to the AC during typical development. We use diffusion tensor imaging (DTI) and neurite orientation dispersion and density imaging (NODDI) to quantify the developmental trajectory of auditory pathway microstructural maturation in a pediatric cohort that spans from infancy through late adolescence.Methods
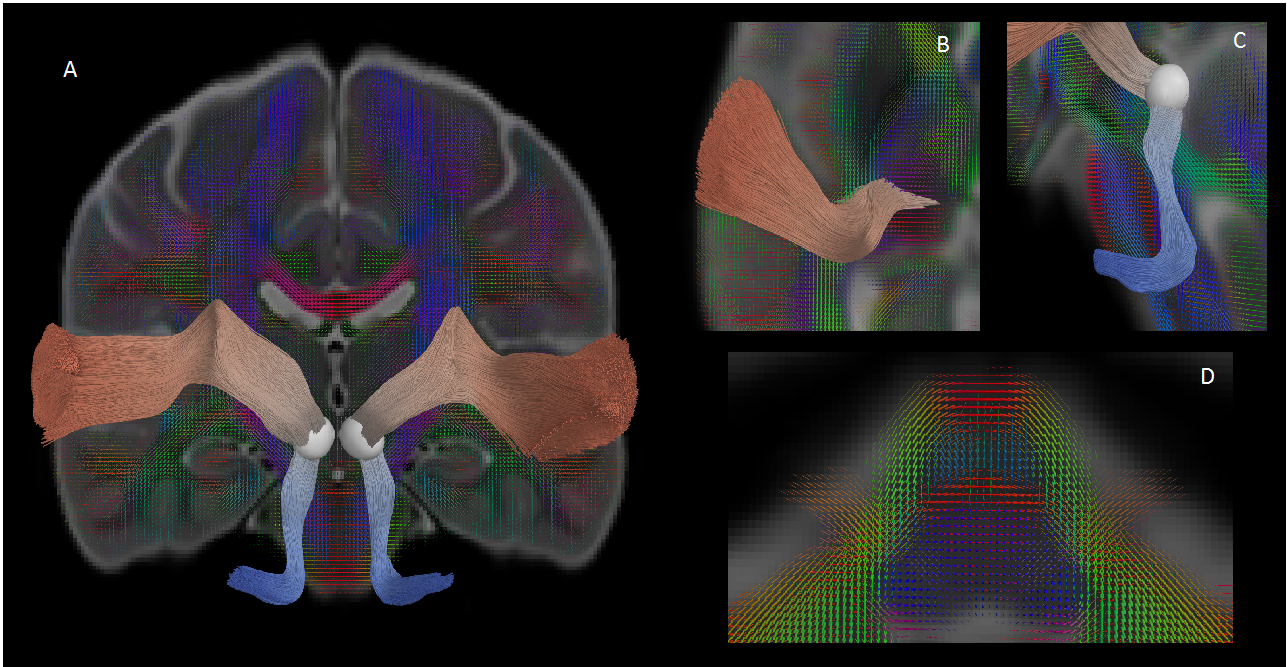
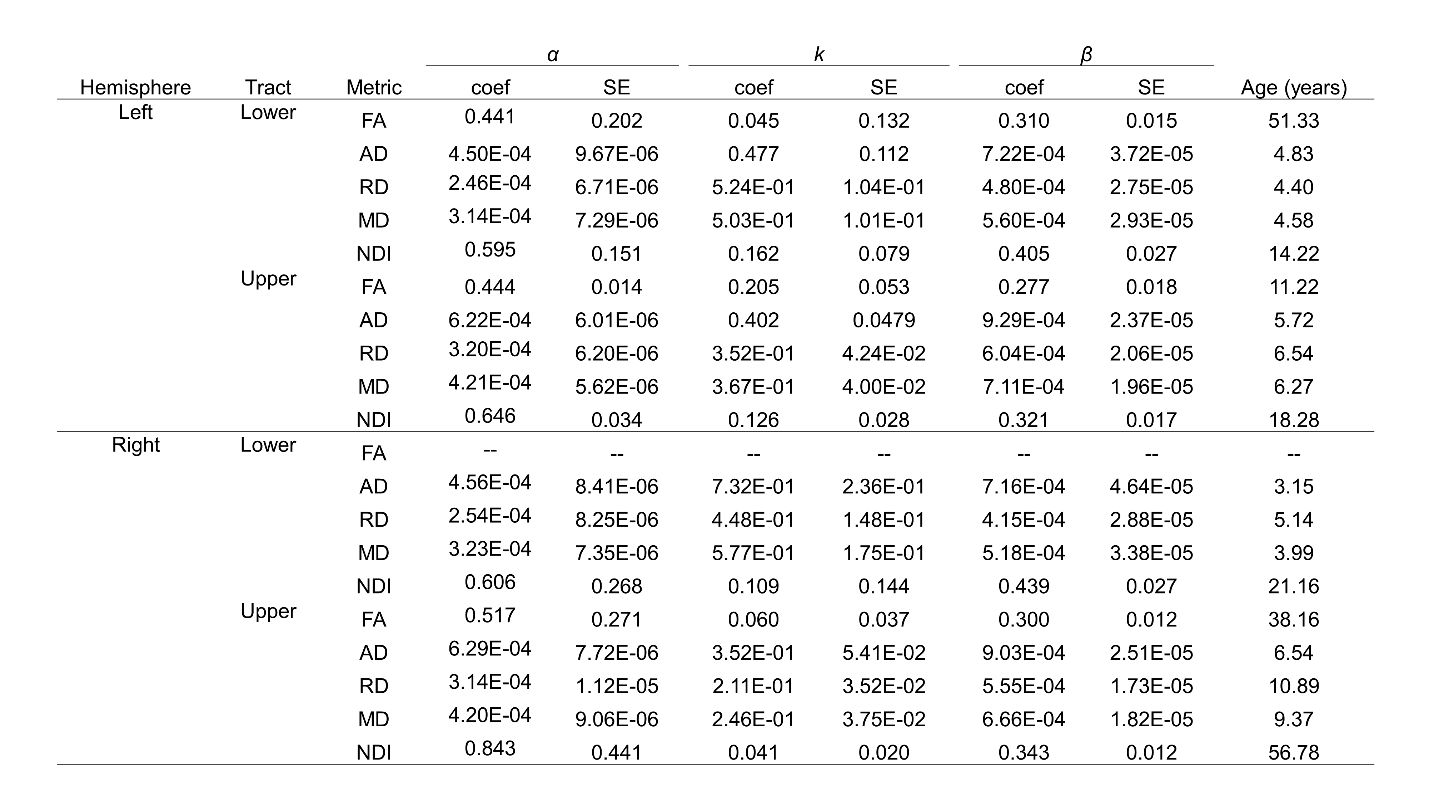
Data was collected from 105 typically developing children (7.8 ± 4.9 years, 56 female, 0.1-18.8 years) through the Cincinnati MR Imaging of NeuroDevelopment (C-MIND) data repository (http://research.cchmc.org/c-mind) [3]. Each subject completed 2 dMRI scans (voxel size: 2 mm isotropic; acquisition matrix: 112x109; 61 gradient-encoding directions. Scan 1: b=1000 s/mm2; TR/TE=6614/81 ms. Scan 2: b=3000 s/mm2; TR/TE=8112/104 ms.). After normalizing each scan by its respective b=0 volume, eddy-current induced artifact and motion correction were carried out using FSL FLIRT. Diffusion modeling was performed using: (1) free-water eliminated diffusion tensor imaging (fweDTI) using iterative least squares and (2) neurite orientation dispersion and density imaging (NODDI) with the spherical mean technique, both using the Quantative Imaging Toolkit (QIT) [4]–[6]. The auditory pathway was extracted using multi-tensor models implemented with BEDPOSTX and an atlas-based hybrid tractography approach [7] (Figure 1). The auditory pathway was separated into two distinct segments: a lower brainstem pathway from the internal auditory canal (IAC) to the inferior colliculus (IC), and an upper pathway from the IC to AC in Heschl’s gyrus using manually labeled IAC, IC and AC regions-of-interest (ROIs) in the IIT template. Along-tract analyses were computed using a segmented template prototypical curve deformed to subject space [8]. Age-related changes were assessed using a brody growth curve with nonlinear least squares regression: where α is the asymptote, β is the y-intercept, and k is the growth rate. Coefficient confidence intervals were obtained using bootstrap resampling with 10,000 iterations. The age at terminal maturation was defined as the age at 90% of α.Results
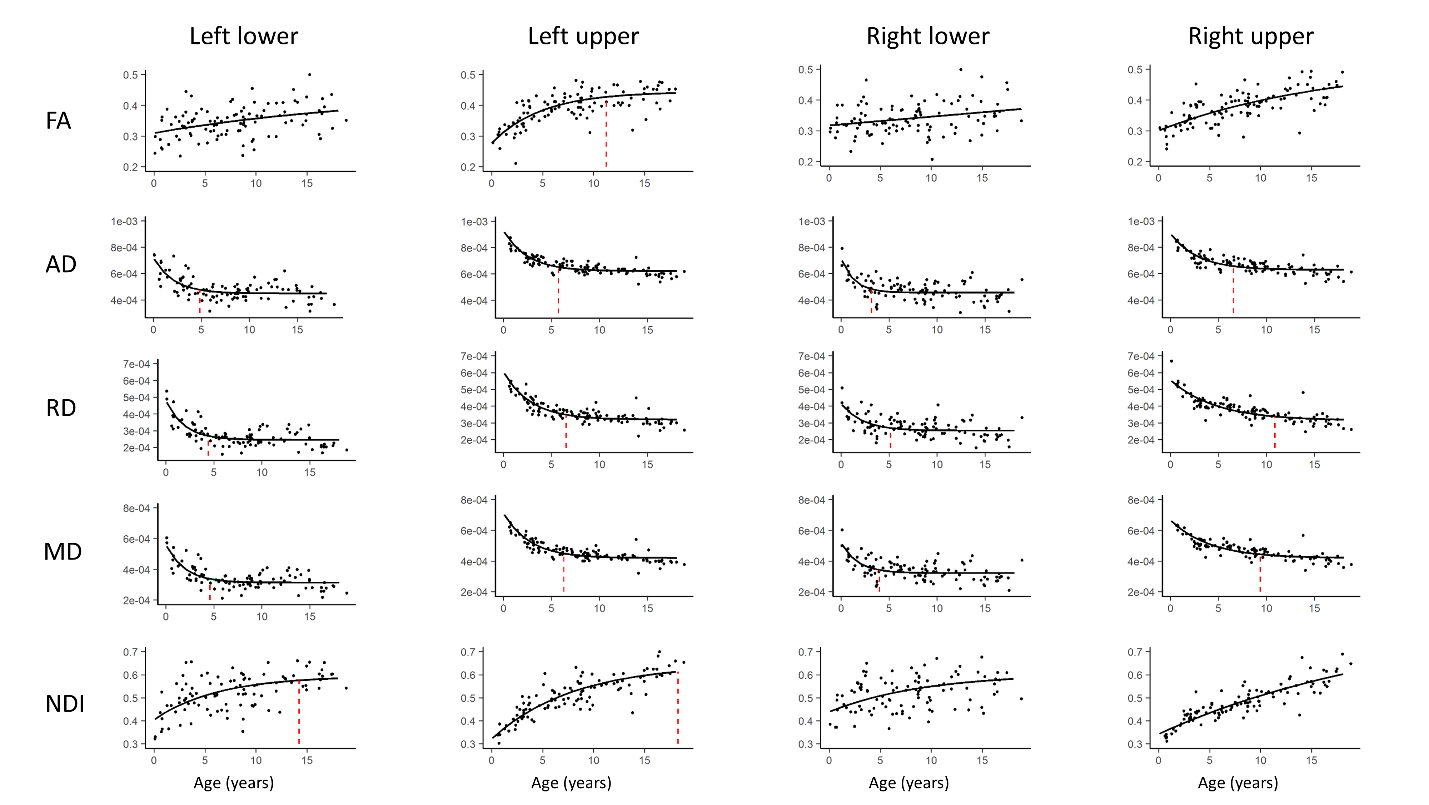
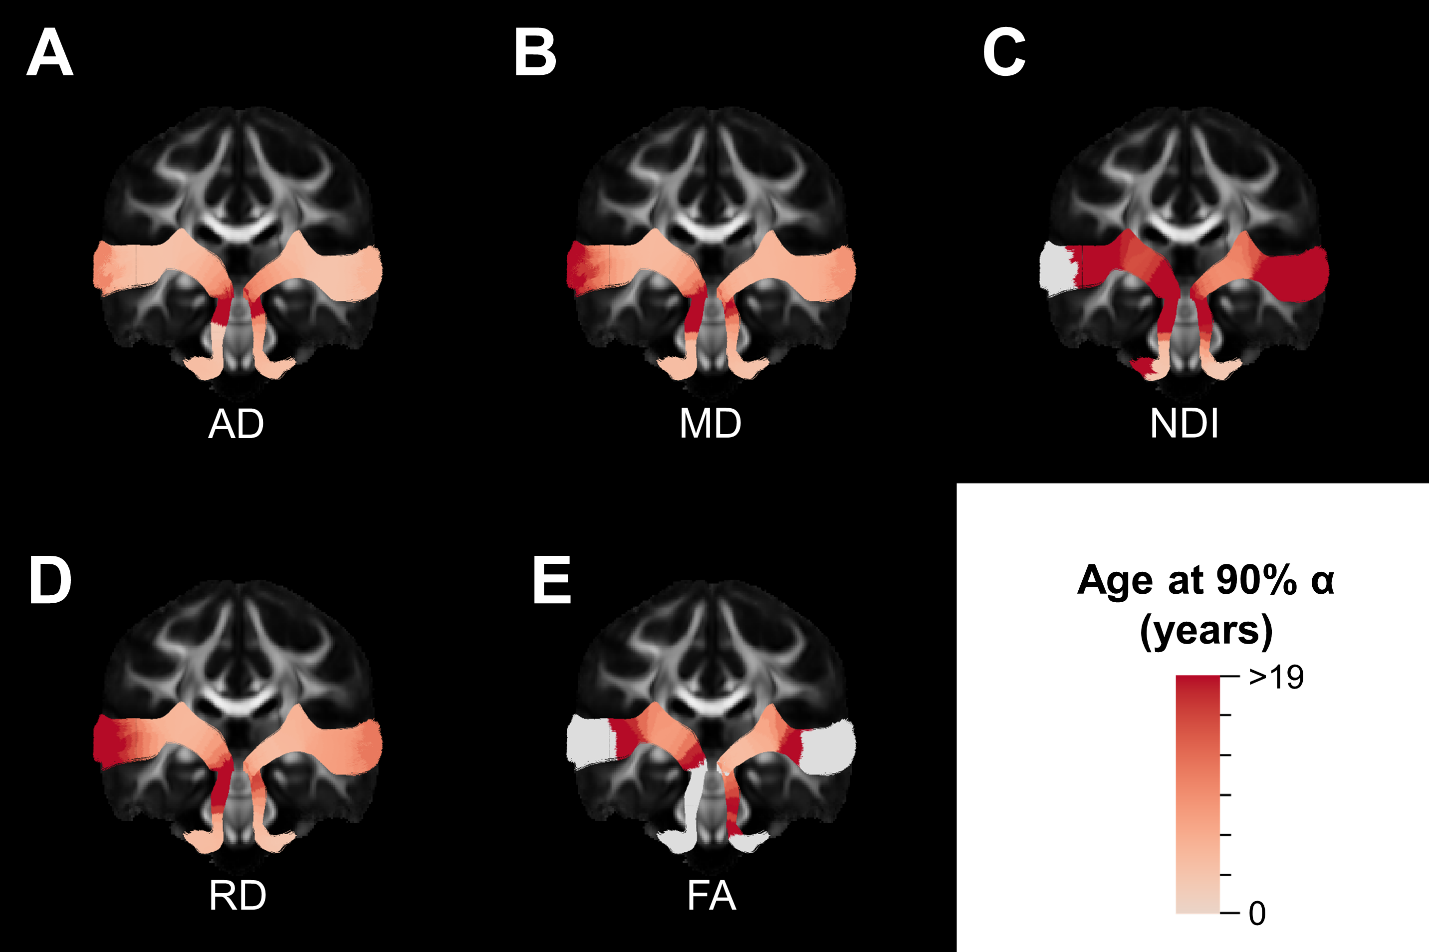
The majority of diffusion metrics showed non-linear age-related changes in auditory pathway bundles (Figure 2). Across all tracts, AD, RD and MD reached terminal maturation earlier than neurite density index (NDI) (Figure 3). Age-related variance in tract FA was not adequately explained by brody growth curves. Changes within the right lower auditory tract were best explained by a linear model (B=.003, t(103)=3.05, p=.003) and are excluded from further comparisons. Along-tract analyses demonstrate the maturational timing for each metric was not uniform (Figure 4). The left and right lower tracts developed at approximately the same rate across metrics (left: M=7.0 years, right: M=8.4 years), with the young age estimates driven primarily by inferior portions of the tract within the brainstem. The right upper tract developed later (M=20.9 years) than the left upper tract (M=9.2 years), and this difference was primarily driven by the late maturation of the right superficial white matter near the superior temporal gyrus. Across all parameters, the portion of the tract that projects through the inferior colliculus reach terminal maturation much later than the rest of the tract, often well beyond the sampled age range (>19 years).Discussion
The present study utilized diffusion metrics to quantify the magnitude and timing of auditory pathway maturation during child development. Overall, DTI and NODDI parameters undergo different maturational rates in the auditory pathway. Previous research has shown that different axonal features, such as axon caliber and myelination, mature at different rates [9] and the observed differences in maturational timing across metrics may reflect variable sensitivities to these developmental processes. There was converging evidence across all metrics that show vestibulocochlear cranial nerve projections to the cochlear nucleus of the brainstem develop earliest, which may reflect their role in audition. The cranial nerves convey primary sensory information important for the establishment of auditory functionality and are highly conserved across vertebrate species. A limitation of this study is that the spatial resolution may not be sufficient to resolve crossing fibers or tissue contrasts within the brainstem, which may partially explain why the developmental timing of the inferior colliculus is considerably later than other regions.Conclusion
In conclusion, this study shows white matter microstructure of the primary auditory pathway undergoes dynamic and heterochronous microstructural maturation from infancy through adolescence. Using along-tract analyses, we also elucidate spatial patterns of asymmetric growth between the left and right auditory radiations. These results provide preliminary evidence regarding the structural maturation of fiber bundles that temporally coincide with the experience-dependent refinement of auditory processes that shape our perception of sound during sensitive developmental periods.Acknowledgements
This work was supported by National Institutes of Health grant number P41EB015922. Data collection and sharing for this project was funded by The Cincinnati MR Imaging of Neurodevelopment study (C-MIND) (supported by the National Institute of Child Health and Human Development Grant HHSN275200900018C).References
[1] Kral, A., “Auditory critical periods: A review from system’s perspective,” Neuroscience, vol. 247, pp. 117–133, 2013.
[2] Kral, A., Dorman, M. F. and Wilson, B. S., “Neuronal Development of Hearing and Language: Cochlear Implants and Critical Periods,” Annu. Rev. Neurosci., vol. 42, pp. 47–65, 2019.
[3] Holland, S. et al., “The C-MIND project: normative MRI and behavioral data from children from birth to 18 years,” in Proceedings of the 21st Annumal Meeting of the Organization for Human Brain Mapping (OHBM), Honolulu, HA, 2015.
[4] Zhang, H., Schneider, T., Wheeler-Kingshott, C. A. and Alexander, D. C., “NODDI: practical in vivo neurite orientation dispersion and density imaging of the human brain.,” Neuroimage, vol. 61, no. 4, pp. 1000–16, Jul. 2012.
[5] Cabeen, R. P., Sepehrband, F., and Toga, A. W., “Rapid and accurate NODDI parameter estimation with the spherical mean technique,” in Proc International Society for Magnetic Resonance in Medicine (ISMRM), 2019, p. 3363.
[6]Cabeen, R. P., Laidlaw, D. H., and Toga, A. W., “Quantitative imaging toolkit: Software for interactive 3D visualization, data exploration, and computational analysis of neuroimaging datasets,” 2018, p. Vol 2854.
[7] Cabeen, R. P. and Toga, A. W., “Reinforcement tractography: A hybrid approach for robust segmentation of complex fiber bundles,” in IEEE 17th International Symposium on Biomedical Imaging (ISBI), 2020, pp. 999–1003.
[8] Lynch, K. M., Cabeen, R. P., Toga, A. W. and Clark, K. A., “Magnitude and timing of major white matter tract maturation from infancy through adolescence with NODDI,” Neuroimage, vol. 212, no. October 2019, p. 116672, 2020.
[9] Giedd, J. et al., “Brain development during childhood and adolescence: a longitudinal MRI study,” Nat Neurosci, vol. 2, no. 10, pp. 861–863, 1999.
Figures