1684
A radiomics method to identify non-neuropsychiatric systemic lupus erythematosus with grey matter volume1Medical Imaging Center, Nanfang Hospital, Southern Medical University, Guangzhou, China, 2Philips Healthcare, Guangzhou, China, 3Shanghai Key Laboratory of Magnetic Resonance, East China Normal University, Shanghai, China
Synopsis
The present study tried to use radiomics models to find the neuroanatomical biomarkers that can improve diagnosis in distinguishing non-neuropsychiatric Systemic Lupus Erythematosus (non-NPSLE) patients from controls. The results demonstrate that the grey matter volume parameter is an effective classification feature for the radiomics models to identify non-NPSLE patients from HC subjects. This classification performance may suggest that the proposed method is a promising approach for improving the clinical diagnosis of systemic lupus erythematosus.
Background
Systemic lupus erythematosus (SLE) is an autoimmune connective tissue disease with unknown pathogenesis that affects the central nervous system [1]. Previous studies have analyzed brain morphometry difference between non-neuropsychiatric Systemic Lupus Erythematosus (non-NPSLE) patients and healthy controls, highlighting the need for early evaluation and intervention in SLE patients [2,3]. To the best of our knowledge, no study ever applied pattern classification to discriminate non-NPSLE patients from healthy controls based on the brain grey matter volume properties. Therefore, the present study tried to use radiomics models to find the neuroanatomical biomarkers that can improve diagnosis in distinguishing non-NPSLE patients from controls.Materials and Methods
Forty-four female patients with non-NPSLE (30.1±1.5 years) and twenty-seven age- and gender- matched healthy subjects (30.9±1.8 years) were enrolled in this study. All structural images were scanned on a 3.0 T scanner (Achieva TX; Philips Healthcare, Best, the Netherlands) using an 8-channel head coil for signal reception. Images were processed using VBM8 toolbox in SPM8, and a threshold of FDR corrected P<0.05 for a significant cluster was set to identify group differences in grey matter volume. Then the volumes of clusters with statistical significance were imported in the FeAture Explorer (FAE, a tool for developing and comparing radiomics models) [4] for further analysis. The dataset was randomly split into a training dataset and an independent test dataset with a weight ratio of approximately 7:3, and the first-order statistic features were extracted. We balanced the training dataset by upsamping technique and normalized the dataset by mean normalization. Analysis of variance (ANOVA) and Pearson correlation coefficient were used to reduce the number of features and prevent overfitting. Three different classifiers (support vector machine (SVM), linear discriminant analysis (LDA), Logistic regression(LR)) were performed to distinguish patients with non-NPSLE from healthy controls. Furthermore, the leave-one-out cross-validation (LOOCV) was adopted to generate accuracy values. The performance of the classification models was evaluated using the area under the receiver operating characteristic (ROC) curve (AUC).Results
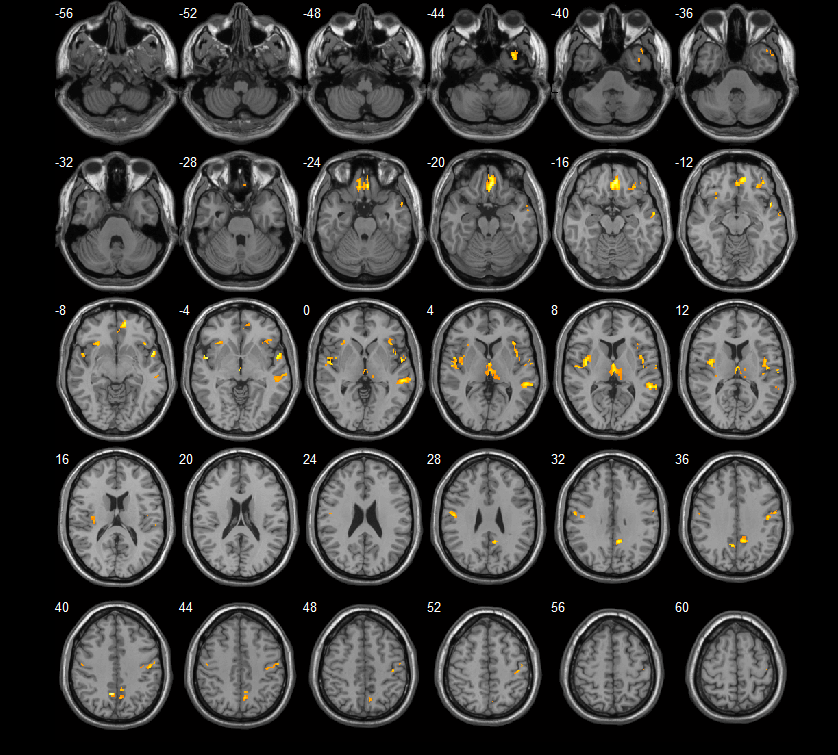
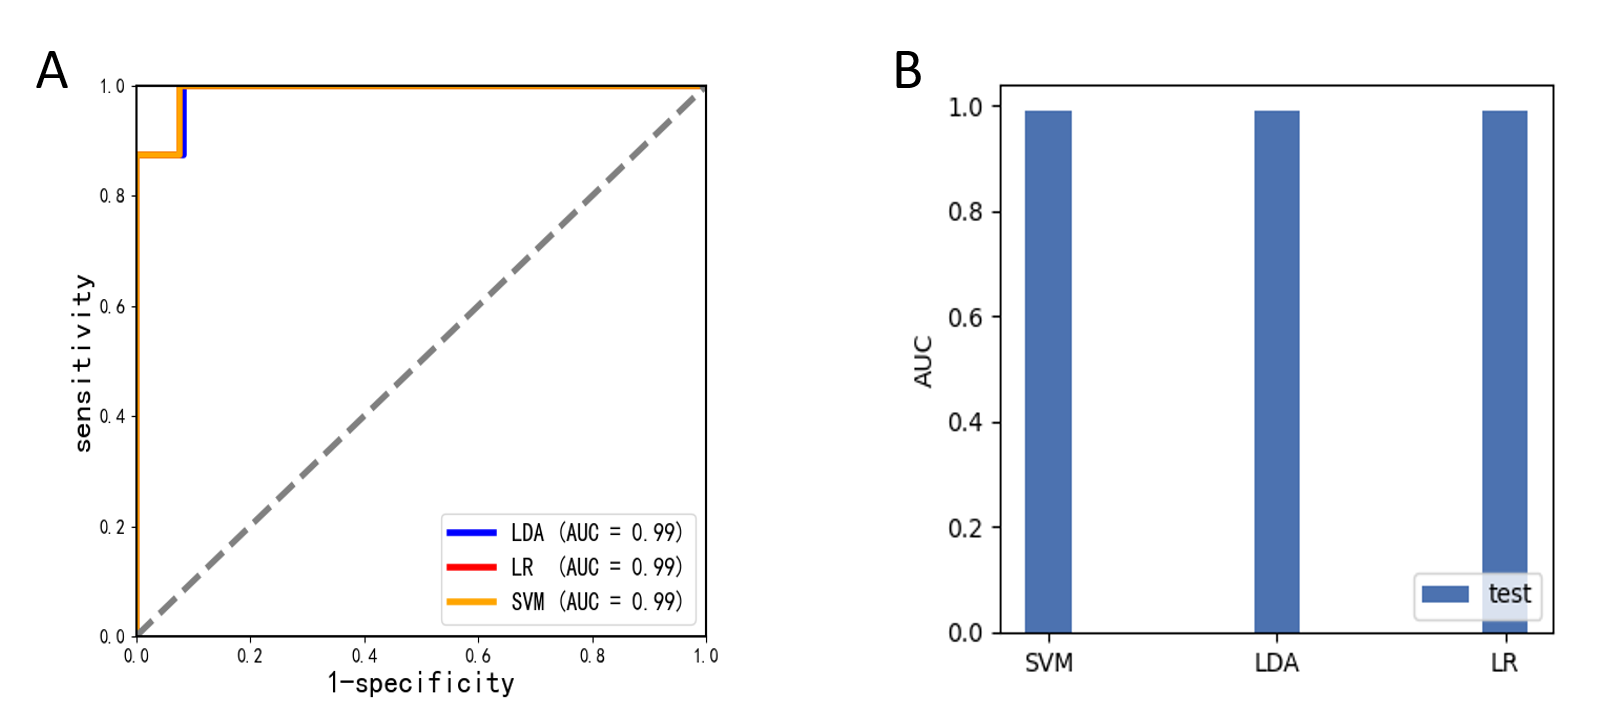
Compared to healthy controls, the non-NPSLE group showed grey matter volume decrease in the temporal gyrus, gyrus rectus, medial orbitofrontal gyrus, insula, thalamus, postcentral gyrus, median cingulate and paracingulate gyri, postcentral gyrus and precuneus (Figure1 and Table1). While no grey matter volume increased was found in the non-NPSLE group compared to healthy controls. Using the radiomics models, we found that three classifiers achieved the same classification performance with accuracy of 0.95, specificity of 0.92 and sensitivity of 1. The AUC of three classifiers was 0.99 (Figure 2).Conclusion
The grey matter volume parameter is an effective classification feature for the radiomics models to identify non-NPSLE patients from HC subjects. This classification performance may suggest that the proposed method is a promising approach for improving the clinical diagnosis of systemic lupus erythematosus.Acknowledgements
No acknowledgement found.References
[1] Jeltsch-David H & Muller S. Neuropsychiatric systemic lupus erythematosus: pathogenesis and biomarkers. Nat Rev Neurol 2014;10:579-596.
[2] Niu C, Tan X, Liu X, Han K, Niu M, Xu J, Zhao L, Wu Y, Deng F, Huang Q (2018) Cortical thickness reductions associate with abnormal resting-state functional connectivity in non-neuropsychiatric systemic lupus erythematosus. Brain imaging and behavior 12 (3):674-684
[3] Xu, J., et al., Autoantibodies Affect Brain Density Reduction in Nonneuropsychiatric Systemic Lupus Erythematosus Patients. J Immunol Res, 2015. 2015: p. 920718.
[4] Song, Yang; Zhang, Jing; Zhang, Yu-dong; Hou, Ying; Yan, Xu; Wang, Yida; Zhou, Minxiong; Yao, Ye-feng; Yang, Guang; Dimitriadis, Stavros I. (2020). FeAture Explorer (FAE): A tool for developing and comparing radiomics models. PLOS ONE, 15(8), e0237587–. doi:10.1371/journal.pone.0237587
Figures
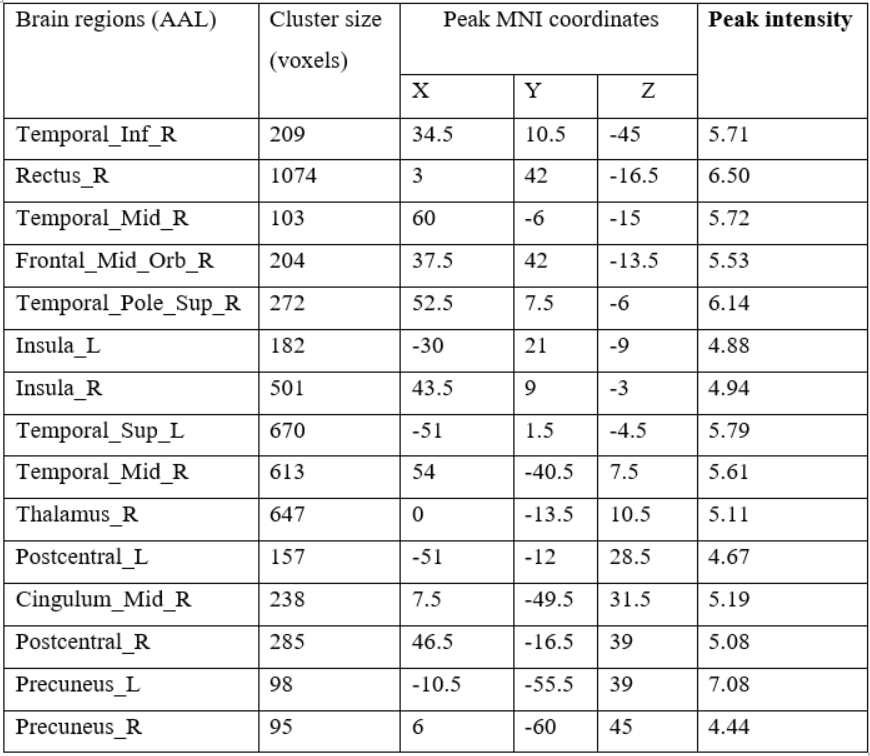
Table 1. Brain structures with grey matter volume decreased in non-NPSLE compared to healthy controls. AAL, anatomical automatic labeling; MNI, Montreal neurological institute; L, left hemisphere; R, right hemisphere