1678
Cerebral iron deposition in gray nucleus in type 2 diabetes mellitus patients and the correlation with metabolic disorders1Department of Radiology, First Affiliated Hospital of Dalian Medical University, Dalian, China, 2Philips Healthcare, Beijing, China
Synopsis
Iron deposition of the gray nucleus is quantitatively assessed by magnetic sensitivity value (MSV)using quantitative susceptibility mapping (QSM), and its’ correlation to metabolic disorders index is also analyzed in patients with type 2 diabetes mellitus (T2DM).The results show that increased MSV value of gray nucleus in T2DM patients may be associated with metabolic disorders.
Purpose
To quantitatively asses the iron deposition of the gray nucleus using quantitative susceptibility mapping (QSM), and to analyze the correlation between magnetic sensitivity value (MSV) and metabolic disorders in patients with type 2 diabetes mellitus (T2DM).Materials and Methods
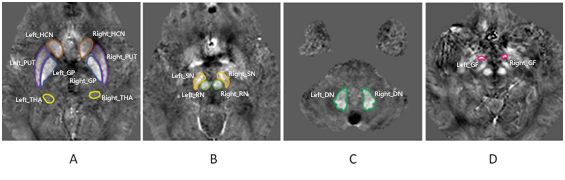
Twenty-five patients (11 males, 14 females) with clinically confirmed T2DM (T2DM group) and 14 control subjects (5 males, 9 females; CON group) were recruited. Ethical approval and consent forms were obtained. All patients underwent a routine MRI and susceptibility weighted imaging (SWI). Clinical data including gender, age were collected from all subjects. Laboratory examination indexes including glycated hemoglobin (HbA1c), fasting glucose (FG), cholesterol, triglycerides, homocysteine levels were collected from T2DM patients. QSM maps were obtained using signal processing in nuclear magnetic resonance (SPIN) (MR Innovations Inc., Detroit, MI, USA, Ver:1.4.5), and magnetic sensitivity value (MSV) of bilateral cerebral gray nuclei were measured, including: head of caudate nucleus (HCN), globus pallidus (GP), putamen (PUT), thalamus (THA), red nucleus (RN), substantia nigra (SN), dentate nucleus (DN), gyri fascicular (GF).Data analyses were performed using statistical package for social science (SPSS) version 20.0 and R version 3.5.3. Independent-samples t-test (for normally distributed data) or Mann–Whitney U test (for non-normally distributed data) was used to compare the MSV between T2DM group and CON group. Spearman correlation analysis was performed between the MSV and laboratory data of the T2DM group. P<0.05 was considered statistically significant.
Results
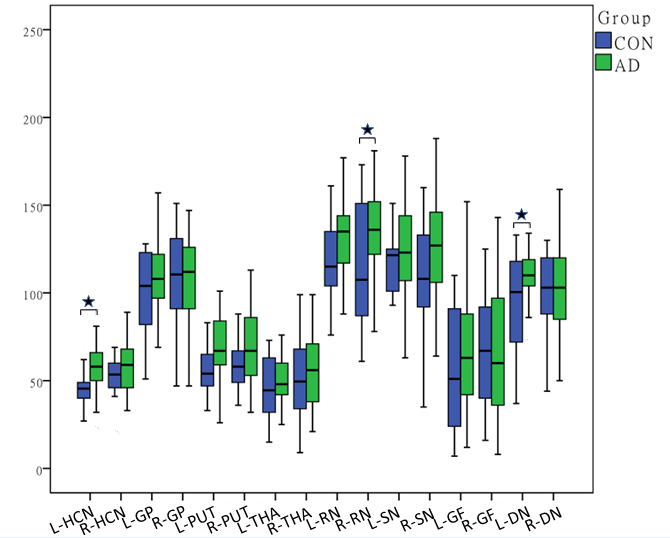
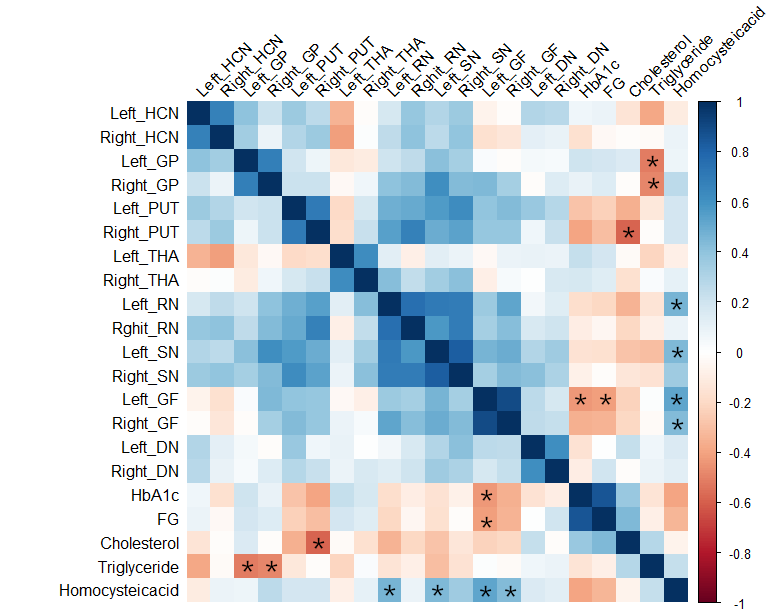
The ROIs on the QSM maps are illustrated in Figure 1.The MSV in left HCN (p=0.034), right RN (p=0.046), and left DN ( p=0.033) was increased in T2DM group compared to the CON group(Figure 2).The correlation analysis results are shown in the heat map in Figure 3.The MSV of the left GF had a significant negative correlation with the HbA1c(r=-0.435, p=0.030) and FG (r=-0.418, p=0.038). There was a significant negative correlation between the MSV of right PUT (r=-0.587, p=0.002) and cholesterol.The MSV of the bilateral GP (rL=-0.511, pL=0.009; rR=-0.485, pR=0.014) had a significant negative correlation with triglycerides. The MSV of left RN (r=0.465,p=0.019), left SN (r=0.443,p=0.027),bilateral GF (rL=0.522, pL=0.007; rR=0.430, pR=0.032) had a significant positive correlation with homocysteine.Discussion and Conclusion
T2DM is a metabolic disorder [1], and the diabetic encephalopathy in T2DM patients has been drawing increasing attention. Insulin comes into play by distributing iron to neuronal tissue; however, the insulin-resistant state in T2DM patients disrupts this process, and as a result, iron is overloaded in neurons and finally becomes detrimental [2]. QSM is a non-invasive magnetic resonance imaging technique that generates a linearly proportional, volumetric image based on the magnetic susceptibility of the subject tissue [3]. It has been proved that it can provide quantitative analysis of brain iron deposition [4].In this study it was found that the iron deposition of left HCN, right RN, and left DN in T2DM group was increased than that in CON group. In addition, the correlation between MSV of gray nuclei and metabolic disorders index including HbA1c, FG, cholesterol, triglycerides, homocysteine was further observed. To conclude, increased iron deposition measured by QSM in gray nucleus may be associated with metabolic disorders in T2DM patients.Acknowledgements
No acknowledgement found.References
[1] Gentile F, Doneddu PE, Riva N, et al. Diet, Microbiota and Brain Health: Unraveling theNetwork Intersecting Metabolismand Neurodegeneration. Int J Mol Sci, 2020, 21(20).
[2] Li J, Zhang Q, Zhang N, et al. Increased Brain Iron Deposition in the Putamen in Patients with Type 2 Diabetes Mellitus Detected by Quantitative Susceptibility Mapping. J Diabetes Res, 2020, 2020:7242530.
[3] Derry PJ, Kent TA. Correlating quantitative susceptibility mapping with cognitivedecline in Alzheimer’s disease. Brain, 2017, 140(8): 2069-2072.
[4]Wang Y, Spincemaille P, Liu Z, et al. Clinical quantitative susceptibility mapping (QSM): biometal imaging and its emerging roles in patient care. Journal of Magnetic Resonance Imaging, 2017, 46(4):951–971.
Figures