1677
Preliminary results of longitudinal brain volume analyses in adolescents with Duchenne muscular dystrophy1Department of Radiology, Leiden University Medical Center, Leiden, Netherlands, 2Duchenne Center Netherlands, Leiden, Netherlands, 3John Walton Muscular Dystrophy Research Centre, Newcastle upon Tyne, United Kingdom, 4Translational and Clinical Research Institute, Newcastle University, Newcastle upon Tyne, United Kingdom, 5Faculty of Medical Sciences, John Walton Muscular Dystrophy Research Centre, Newcastle upon Tyne, United Kingdom, 6Expertise Center Kempenhaeghe, Heeze, Netherlands, 7Duchenne Center Netherlands, Heeze, Netherlands, 8Department of Neurology, Leiden University Medical Center, Leiden, Netherlands
Synopsis
Clinical symptoms in Duchenne muscular dystrophy (DMD) not only affect the skeletal muscle but also the brain. We explored brain volume changes over a 2-4 year period in adolescents with DMD versus healthy controls (HC). Our preliminary results show no difference in growth curves between groups. We found a consistently lower total grey matter volume and no differences in white matter volume in DMD. Our data suggest that the differences in brain volume in DMD are non-progressive within the assessed age range of 8-20 years.
Introduction
Duchenne muscular dystrophy (DMD) is a progressive X-linked neuromuscular disorder caused by absence of the dystrophin protein. Dystrophin is expressed in muscle and brain. Next to progressive muscle wasting, a proportion of patients have behavioral and cognitive deficits and comorbidities such as attention deficit hyperactivity disorder (ADHD) and autism.1, 2 With the improved life expectancy from 15 to 30 years of age, cognitive impairment is an increasingly important factor limiting social participation. Cross-sectional MRI studies have demonstrated reduced grey matter volume, altered white matter structural integrity and reduced perfusion compared to healthy controls of the same age.3, 4 It is unknown whether these changes in brain anatomy are progressive. Here we show the first results of a longitudinal study of brain structure in adolescents with DMD compared to healthy controls.Methods
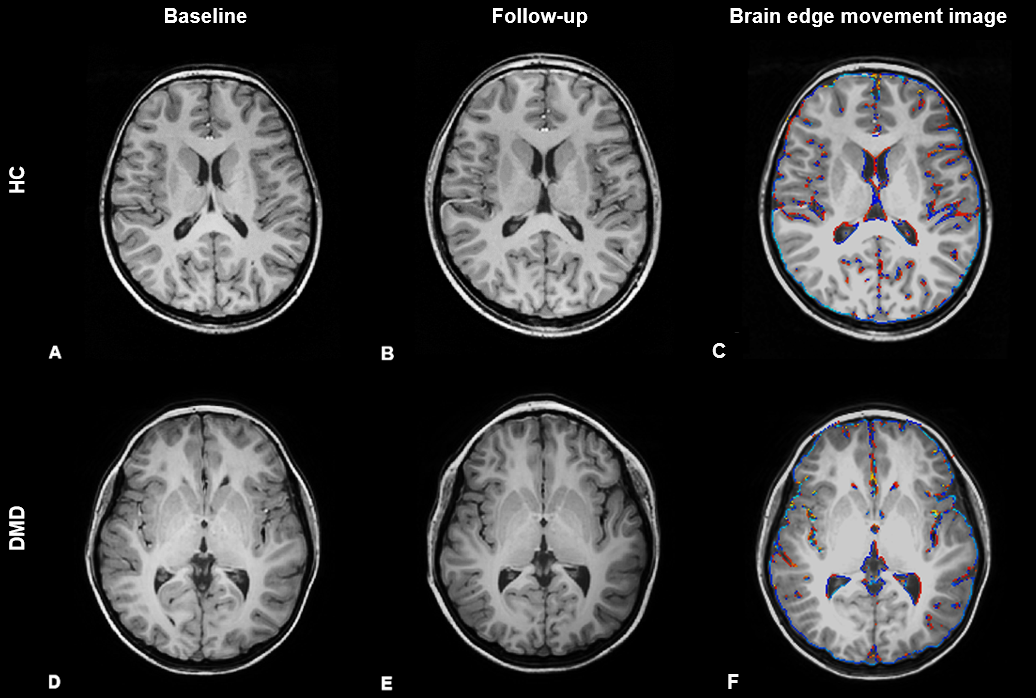
Participants were scanned at two sites; in Leiden (The Netherlands) and Newcastle upon Tyne (UK). Patients with DMD were recruited using national registries and age and sex-matched healthy controls via flyers at schools and sport clubs. The study consisted of two visits, with a 2-4 year time-window in between. At each visit, 3D T1-weighted scans (TE/TR 4.6/9.8 ms; resolution 1.17 × 0.92 × 1.20 mm; 4:55 min) were acquired at 3 Tesla (Philips Achieva) with an 8 channel receive-only head coil without sedation or general anesthesia. For absolute volume analyses, T1w images were segmented using FAST (FMRIB's Automated Segmentation Tool, FSL version 6.0.4) into grey matter, white matter, CSF, intracranial volume and total brain volume. For voxel-wise analyses, two-timepoint brain volume change was estimated using Structural Image Evaluation using Normalisation of Atrophy (SIENA, FSL version 6.0.4) (Figure 1).5-8 Individualized brain image extraction (BET) settings per participant were used. Differences in absolute brain volumes were compared between baseline and follow-up using a paired t-test and considered significant at p≤0.005. Differences between DMD and controls in the rate of change over time were assessed using a mixed model corrected for age. For assessment of changes at a local level, a voxel-wise two-sample t-test with age as a covariate, 10,000 permutations and Threshold-Free Cluster Enhancement multiple comparison correction was used.9 Results were considered significant at p ≤0.05.Results
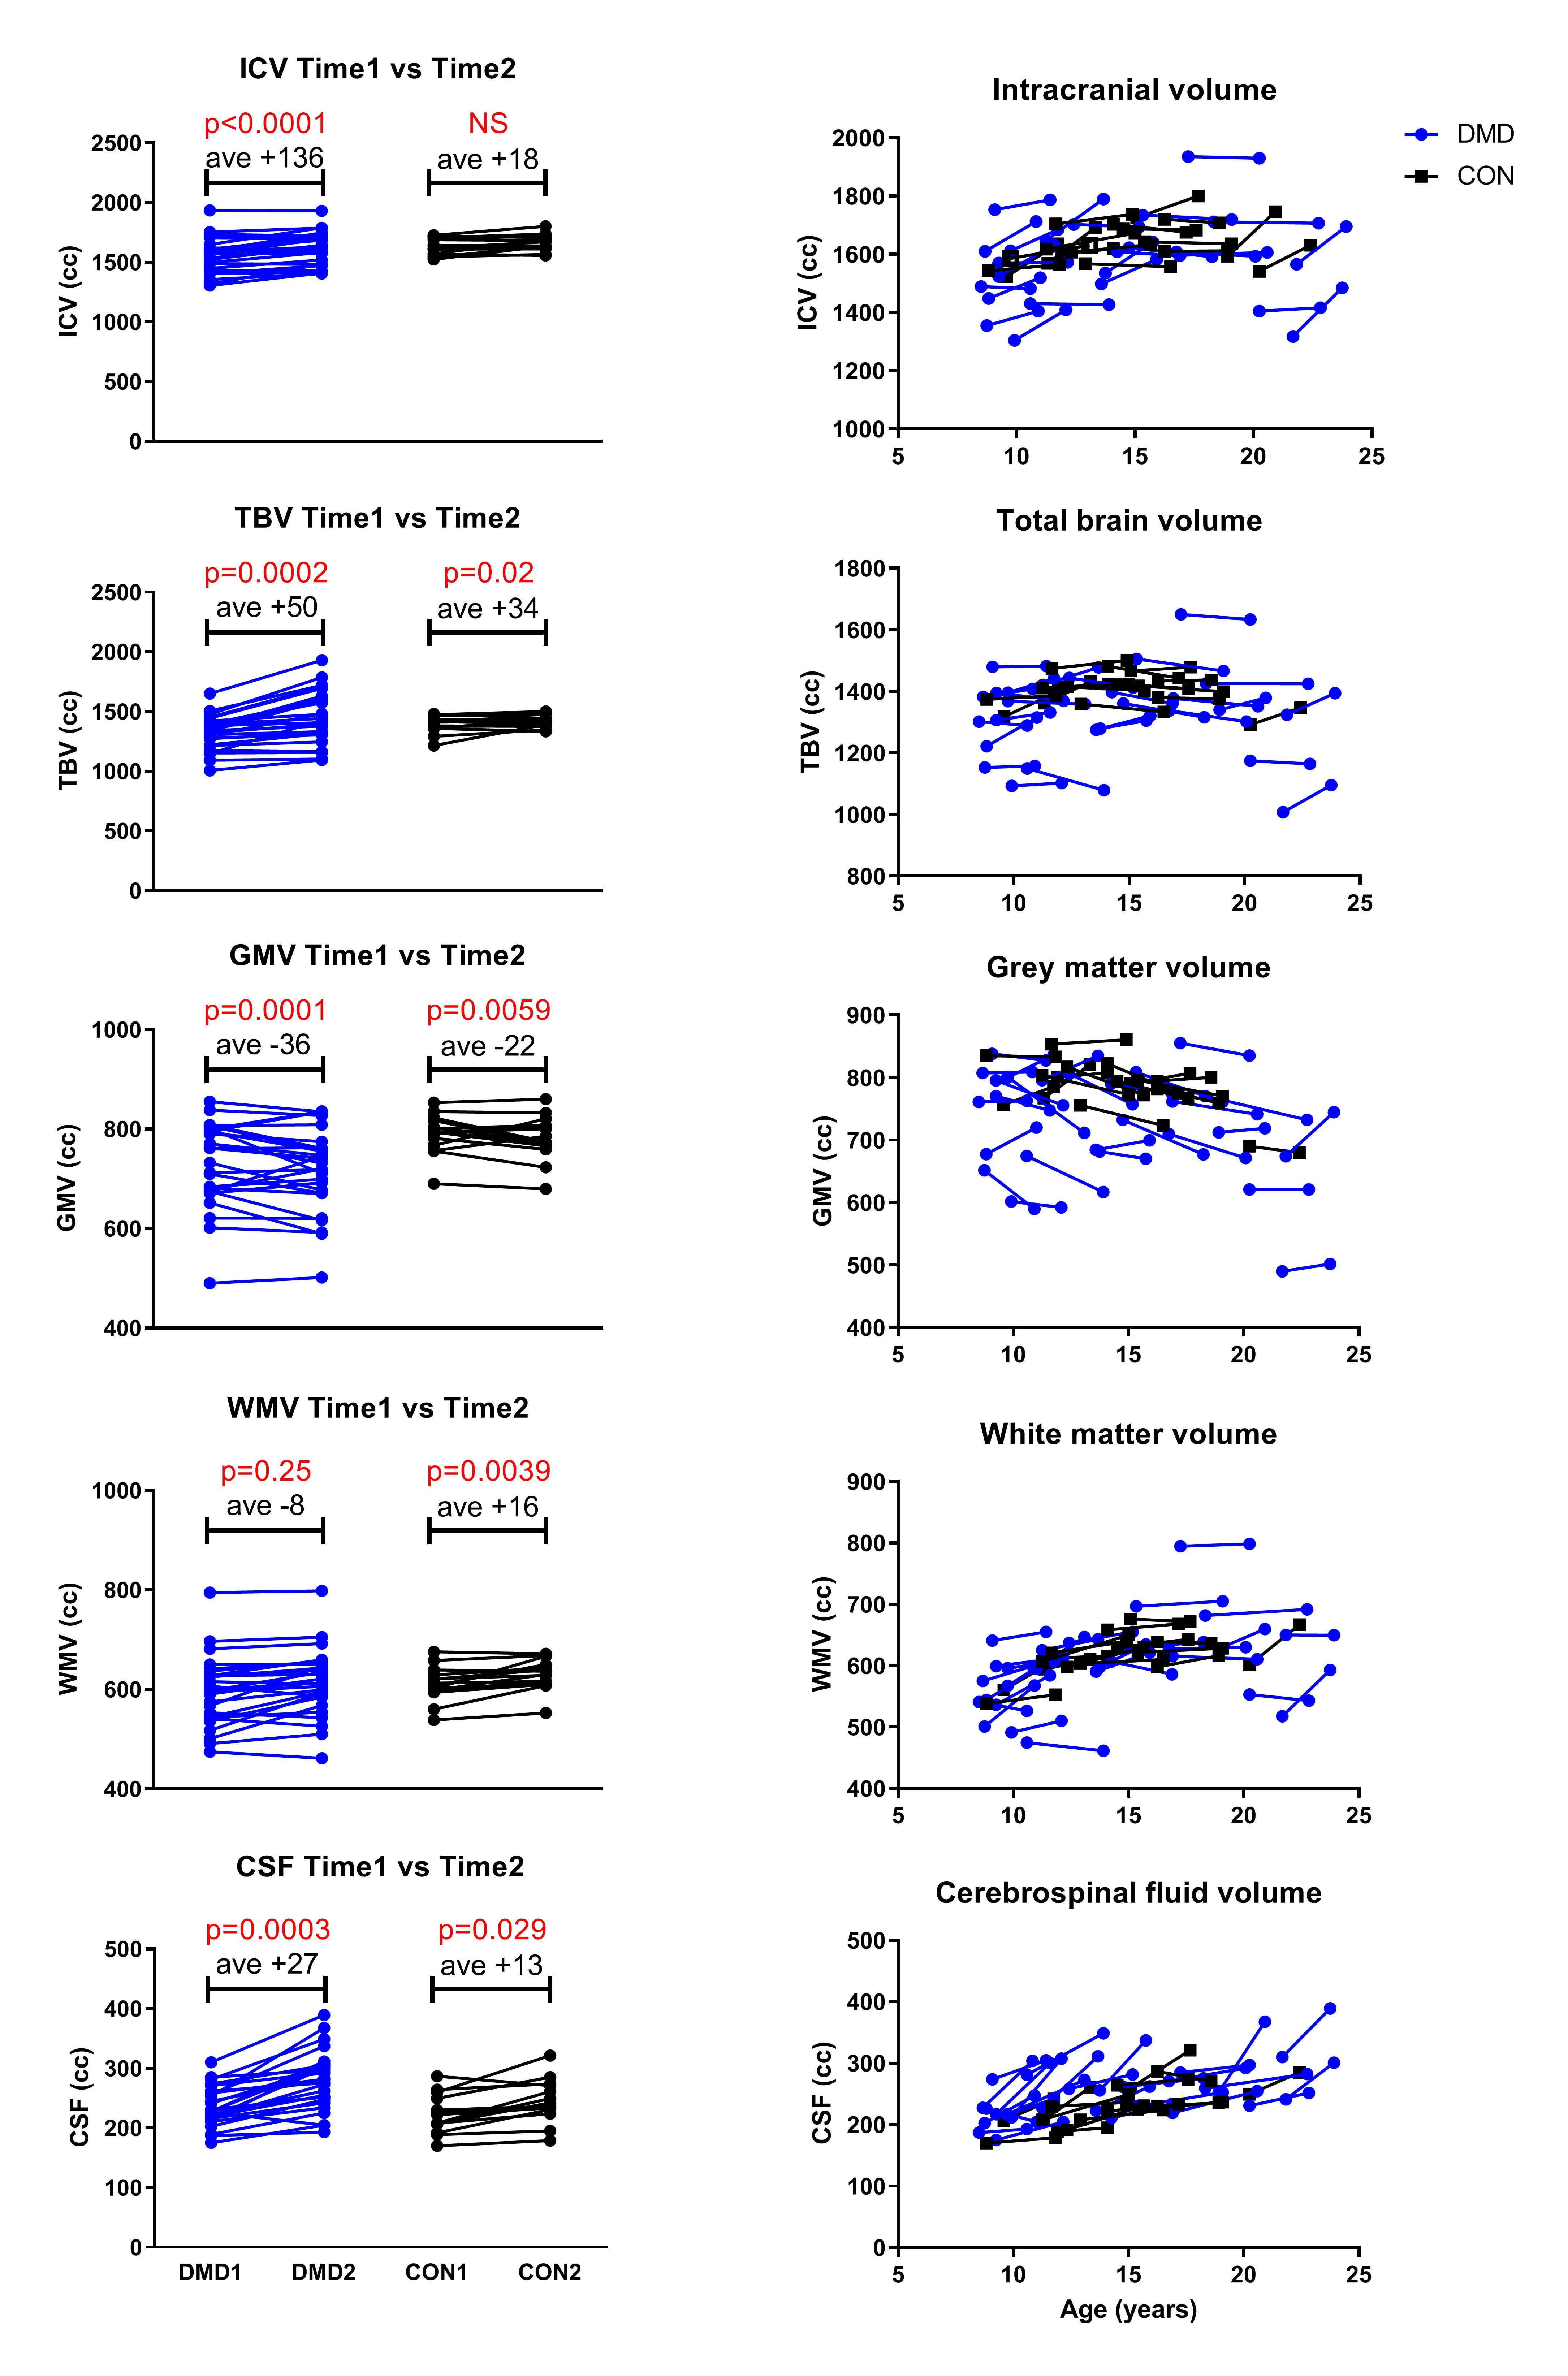
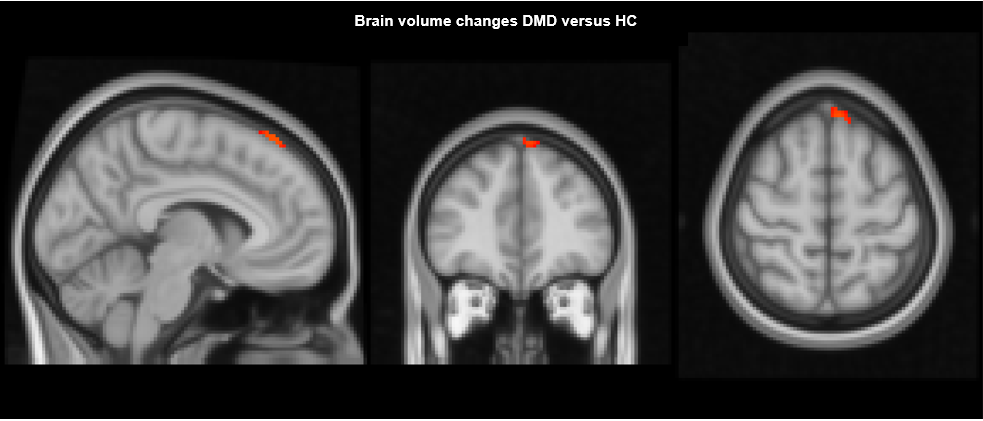
At baseline, 28 participants with DMD and 20 controls were included. Due to drop-out (n=5 HC) and motion artifacts (n=1 DMD) 27 patients (age 13.5 ± 4.3 years, range 8.5-21.8) and 15 controls (age 14.3 ± 2.9 years, range 8.8-20.25) were included in the final analysis. The second visit took place after 2.7 ± 0.7 years (range 1.75-4.25 years). Participants with DMD reported corticosteroid use: daily deflazacort (n=4), daily prednisolone (n=5), intermittent prednisone use (n=11), steroid naive (n=2) and mixed use (n=5). In the absolute volume analysis, lower total brain and grey matter volume was seen in patients with DMD at both time points, while there were no differences for intracranial volume and white matter (Figure 2). Intracranial volume, grey matter and total brain volume changed over time in both groups at similar rates. Cerebrospinal fluid volume was higher in DMD and increased more rapidly over time. In the voxel-based analysis, no difference in volume change was found between the groups, except for a small area in the medial-superior side of the frontal lobe in participants with DMD compared to HC (Figure 3).Discussion
Our volumetric and a voxel-based analysis show that the brain tissue changes over time between adolescent DMD and HC are similar, suggesting that they are non-progressive in the assessed age range of 8-20 years. In agreement with earlier reports grey matter volume in DMD was reduced and there were no differences in white matter volume.4 The higher increase of CSF in participants with DMD observed with the absolute volume analysis was not replicated in the voxel-based data. Brain atrophy and enlargement of the CSF spaces in older patients with DMD was reported using CT.10 It is unknown whether this phenomenon only occurs in later age. We aim to investigate this with additional analyses, for instance voxel-based morphometry on the ventricles only and extending the cohort to include older patients. While the overall brain analyses showed similar brain tissue changes in both groups, the voxel-based data showed a small cluster of brain volume increase in participants with DMD near the dural venous sinus. This finding could be due to methodological issues with settings of FSL’s BET tool. As previously reported11, the head shape is more circular in participants with DMD, requiring manual adjustments to the BET settings. This can lead to errors when projecting on the adult Montreal Neurological Institute and Hospital (MNI) template. One solution for this would be the use of a DMD specific standard image for future analyses. The influence of steroid use in the participants with DMD on the brain is unknown and cannot be determined from the heterogenous steroid usage in our sample.Conclusion
The brain volume difference between DMD and controls seems to be non-progressive up to approximately 20 years of age. These findings need to be further analyzed on a tissue-specific level to make any definitive claims. Finally, the outcomes could be related to cognitive characteristics of the population in a prospective study.Acknowledgements
This study was funded by Duchenne Parent Project NL and Muscular Dystrophy UK.References
1. Banihani R, Smile S, Yoon G, Dupuis A, Mosleh M, Snider A, et al. Cognitive and Neurobehavioral Profile in Boys With Duchenne Muscular Dystrophy. Journal of Child Neurology. 2015;30(11):1472-82.
2. Naidoo M, Anthony K. Dystrophin Dp71 and the Neuropathophysiology of Duchenne Muscular Dystrophy. Molecular Neurobiology. 2020;57(3):1748-67.
3. Doorenweerd N, Dumas EM, Ghariq E, Schmid S, Straathof CS, Roest AA, et al. Decreased cerebral perfusion in Duchenne muscular dystrophy patients. Neuromuscular Disorders. 2017;27(1):29-37.
4. Doorenweerd N, Straathof CS, Dumas EM, Spitali P, Ginjaar IB, Wokke BH, et al. Reduced cerebral gray matter and altered white matter in boys with Duchenne muscular dystrophy. Annals of neurology. 2014;76(3):403-11.
5. McCarthy P. FSLeyes. 2018.
6. Smith SM. Fast robust automated brain extraction. Human brain mapping. 2002;17(3):143-55.
7. Smith SM, Jenkinson M, Woolrich MW, Beckmann CF, Behrens TE, Johansen-Berg H, et al. Advances in functional and structural MR image analysis and implementation as FSL. Neuroimage. 2004;23:S208-S19.
8. Smith SM, Zhang Y, Jenkinson M, Chen J, Matthews P, Federico A, et al. Accurate, robust, and automated longitudinal and cross-sectional brain change analysis. Neuroimage. 2002;17(1):479-89.
9. Winkler AM, Ridgway GR, Webster MA, Smith SM, Nichols TE. Permutation inference for the general linear model. Neuroimage. 2014;92:381-97.
10. Yoshioka M, Okuno T, Honda Y, Nakano Y. Central nervous system involvement in progressive muscular dystrophy. Archives of disease in childhood. 1980;55(8):589-94.
11. Straathof CSM, Doorenweerd N, Wokke BHA, Dumas EM, van den Bergen JC, van Buchem MA, et al. Temporalis Muscle Hypertrophy and Reduced Skull Eccentricity in Duchenne Muscular Dystrophy. Journal of Child Neurology. 2014;29(10):1344-8.
Figures