1676
Mapping Increased Cerebral Free Water Volume Fraction in Hepatic Encephalopathy1University of Miami, Miami, FL, United States, 2Post Graduate Institute of Medical Education & Research, Chandigarh, India
Synopsis
MRI methods have been used to measure increased brain water content in hepatic encephalopathy (HE) patients. However, these methods lack specificity to measure the increased water content from either the intracellular or extracellular compartment. In this work, we use a free-water eliminated diffusion tensor imaging (FWE-DTI) data processing approach to calculate the free water volume content fraction (fFW) in the brains of HE and healthy control subjects. This water fraction is considered as a measure of water fraction contained in the extra-axonal and sulcal spaces. We found significant fFW increases among HE patients indicating low-grade edema and glial swelling.
Introduction
Hepatic encephalopathy (HE) is a neuropsychiatric disorder that results from acute liver failure. Though the mechanisms involved in the pathogenesis of HE are not fully understood, its neurological manifestations are identified to encompass a wide range of processes such as low-grade cerebral edema, astrocyte swelling, neuro-inflammation, and hyper-ammonemia1. MRI studies have focused on the measurement of brain water content to test for the association between HE and astrocyte swelling accompanied by edema2,3. While MRI methods have detected a strong evidence for increased water content in the brains of HE patients, most methods lack specificity to measure changes from the intracellular or extracellular water compartment2. Free-water eliminated diffusion tensor imaging (FWE-DTI) is a novel data processing method that allows to estimate the free-water volume fraction (fFW) as a quantitative measure of the extracellular water contained in a voxel4,5. The goal of this pilot study is to determine if fFW can provide a more specific measure to clarify the origin of increases in brain water content among HE patients.Methods
Acquisition: Data were collected (at the Post Graduate Institute of Medical Education & Research (PGIMER) in India from 5 HE patients (3/2 male/female; age: 55.2), and 7 controls (3/4 male/female; age: 42.7). We acquired whole-brain diffusion-weighted (DW) MRI on a 3T Siemens scanner, and collected 60 dual-shell (b = 1000/2000 s/mm2) DW-images using 30 gradient directions per shell for FWE-DTI analysis with the following parameters: 3×3×3 mm spatial resolution, TR = 1150 ms, TE = 98 ms, 54 axial slices.Processing: DW images are first pre-processed using FSL’s eddy correction and co-registration tools to correct for distortions. FWE-DTI fitting was performed using in house software based on the method defined by Hoy et al.5, where the FWE-DTI model is described as a bi-exponential expansion of DTI
$$S_{i}=S_{0}\left[\left(1-f_{FW}\right)exp\left(-b_{i}\cdot g_i^2D_{tissue}g_{i}\right)+f_{FW}\cdot exp\left(-b\cdot D_{iso}\right)\right]$$
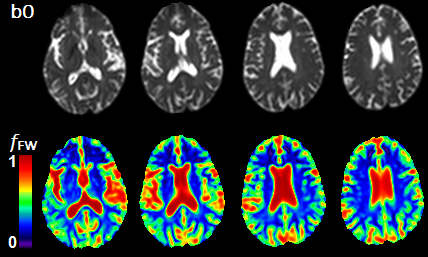
Here the contribution to the total signal Si is separated between two water compartments: free water contained in the CSF and the extracellular space (with isotropic diffusion tensor Diso and volume fraction fFW), and tissue water contained in the intracellular space (with anisotropic diffusion tensor Dtissue and volume fraction 1- fFW). The FWE-DTI fitting problem aims at solving for Dtissue and fFW for each voxel as defined in equation above. From the tensor Dtissue we can find the FWE corrected metrics. However, for the purposes of this study we are only concerned with obtaining fFW maps (Figure 1).
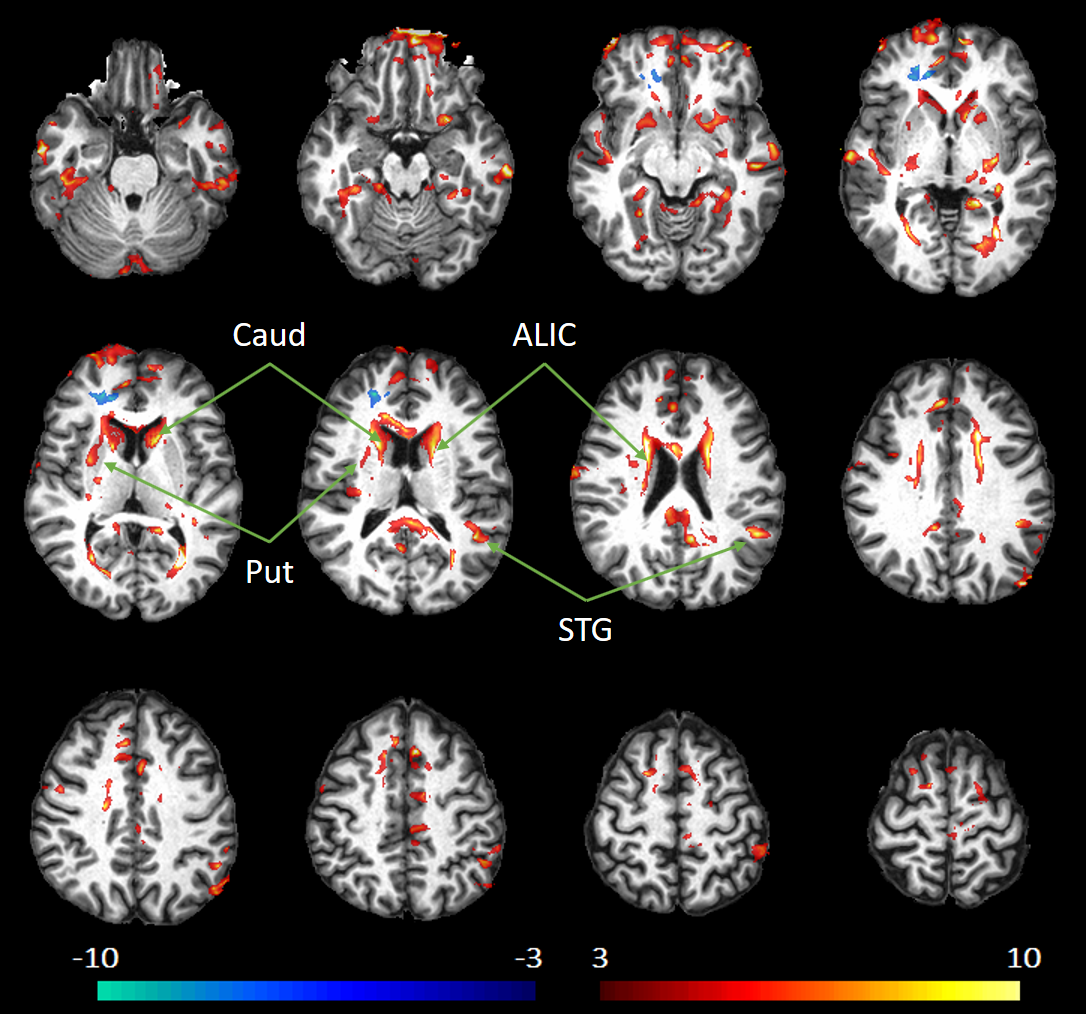
Analysis: We analyzed our data at the whole brain level using the JHU-MNI-SS type-2 atlas containing a total of 130 labeled regions of interest (ROI) from which we selected 20 white matter (WM) and 28 grey matter (GM) ROIs6. We evaluated fFW at each ROI, and compared the measurements between the control and HE individuals. We applied a t-test to find significant between group differences, with a significance threshold set at p < 0.05 corrected for multiple comparisons using false discovery rate (FDR). Finally, we illustrate those differences by generating voxelwise z-score maps to compare fFW values from a single HE patient with the average values from all control subjects.
Results
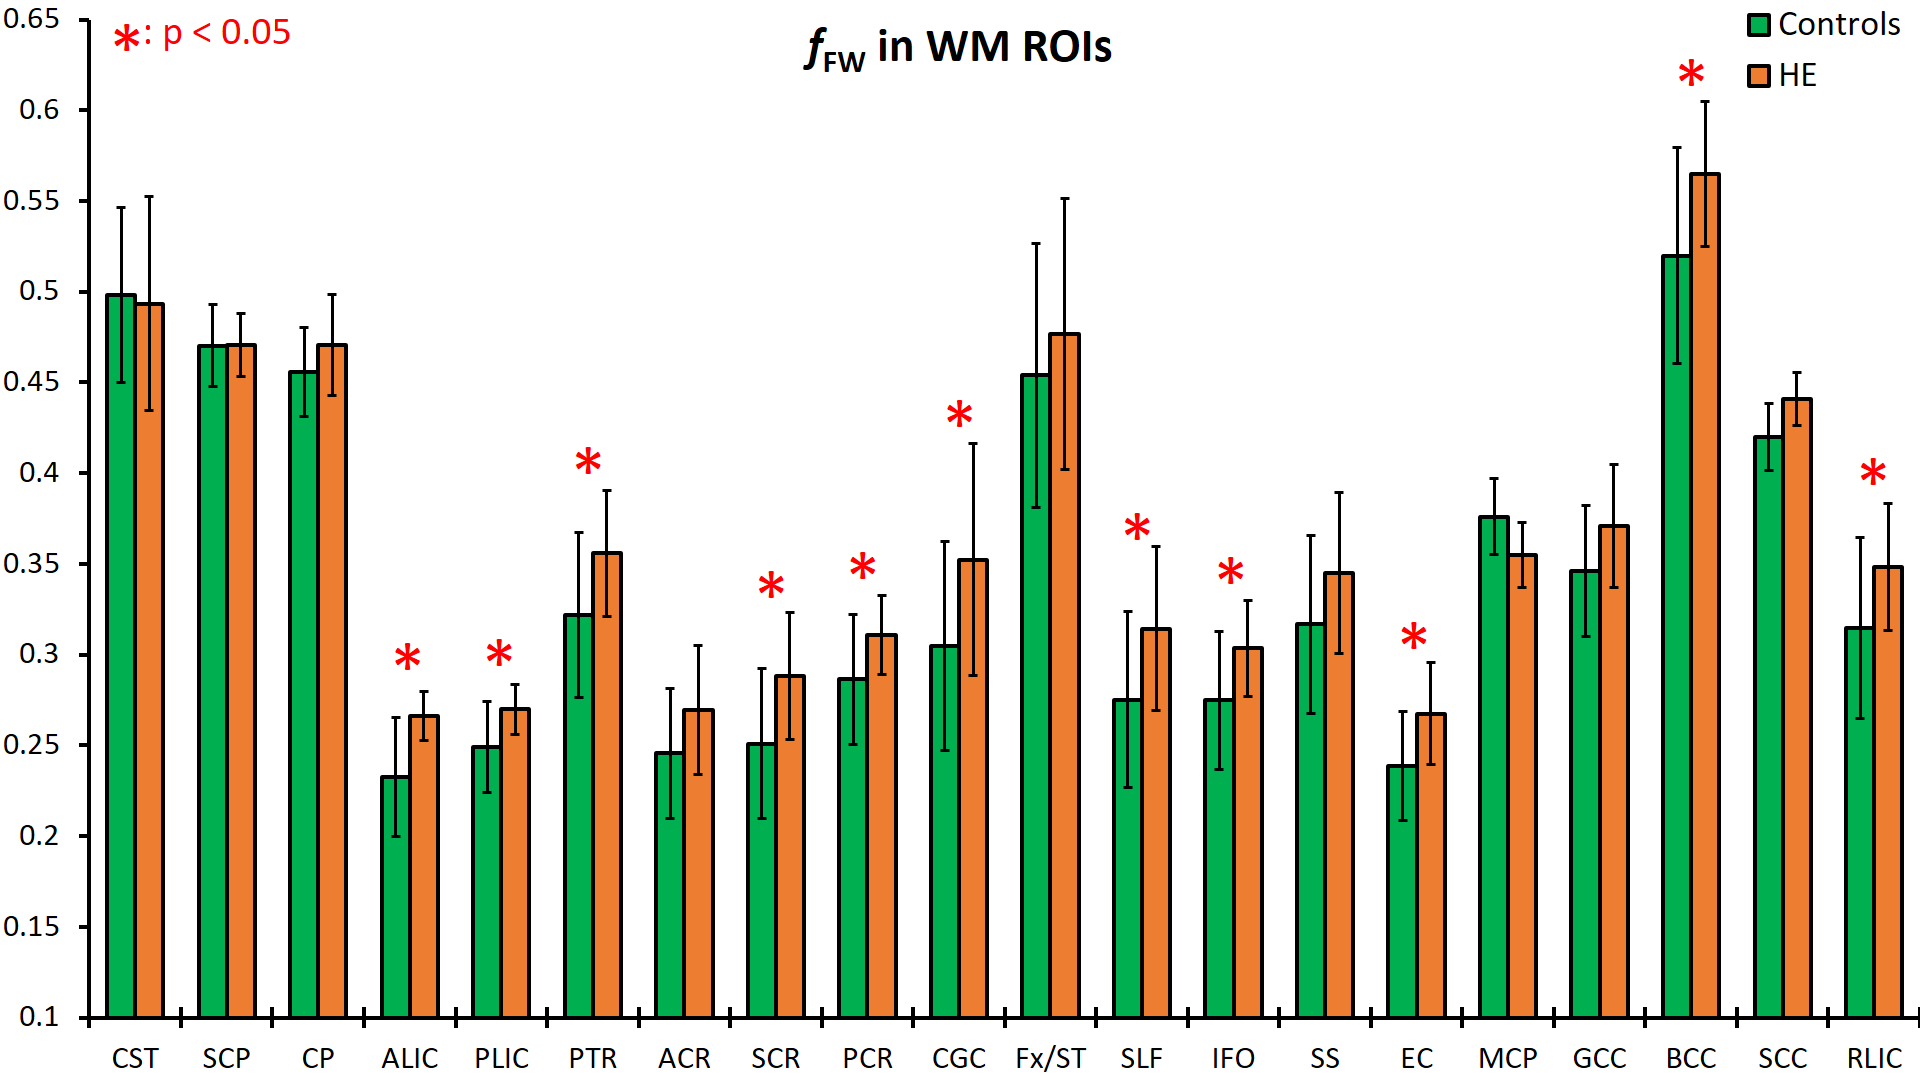
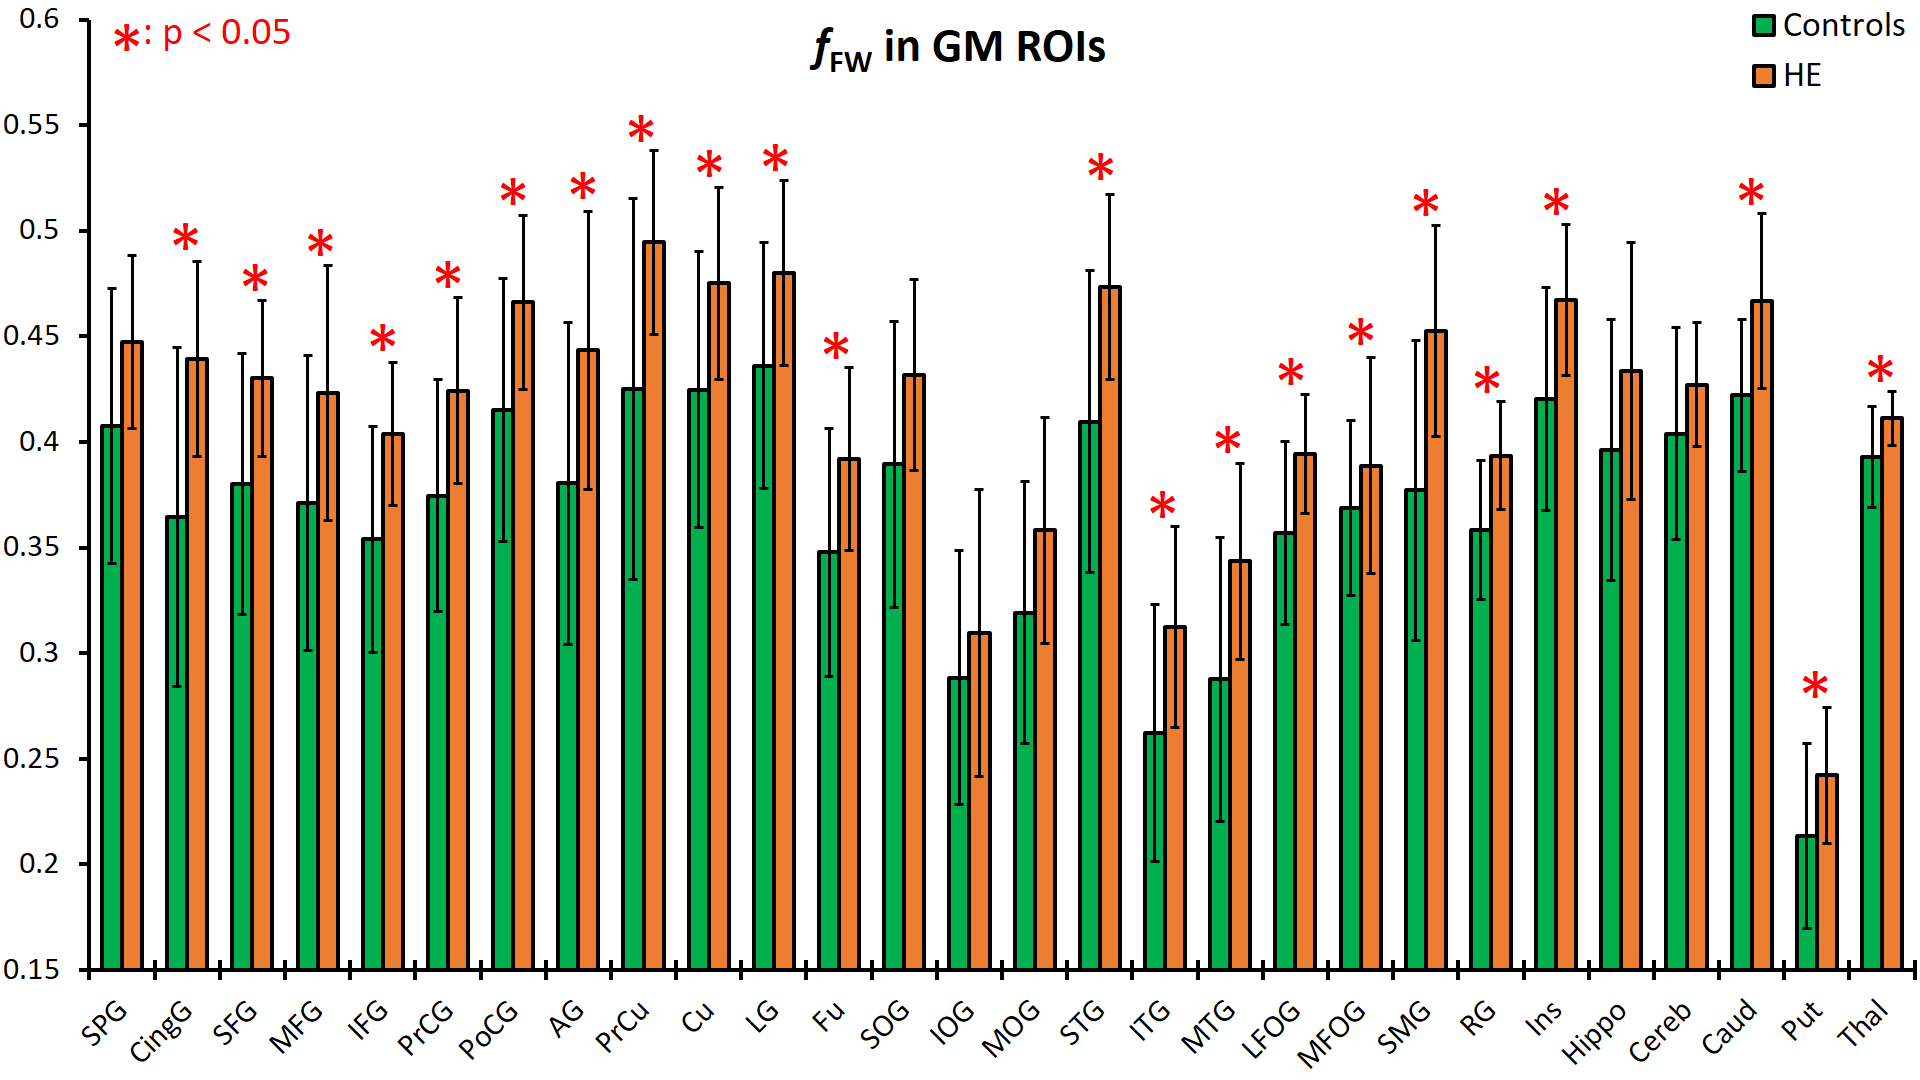
We analyzed the results for WM and GM ROIs separately. Figure 2 shows fFW values measured at the WM ROIs for the HE and control groups. HE subjects show elevated fFW across nearly all regions. The most significant increases are observed in 8 regions: the anterior, posterior, and retrolenticular limb of internal capsule (ALIC, PLIC, RLIC), external capsule (EC), posterior thalamic radiation (PTR), posterior corona radiata (PCR), inferior frontal fasciculus (IFO), and the splenium of corpus callosum (SCC). Similarly, results for GM ROIs displayed in Figure 3 show elevated fFW among the HE group in all the analyzed the regions, with significant difference found in 22 of the 28 regions analyzed. The increase in fFW is most noteworthy in the caudate (Caud), putamen (Put), cingulate gyrus (CingG), cuneus (Cu), and superior temporal gyrus (STG). This difference in fFW between HE subjects and controls across the brain is demonstrated by the z-score maps in Figure 4. The maps show clusters with significantly higher fFW values (z > 3) across the brain most notably in the Caud, Put, ALIC, and STG.Conclusions
Our results clearly show elevated fFW for HE patients across much of the whole brain. We speculate that this excessive buildup of extracellular water volume accounts for the net increase in total brain water content observed in HE. Elevated extracellular volume has also been interpreted as a biomarker for neuro-inflammation and glial swelling, which are frequently associated with low-grade edema. Therefore, our preliminary findings support the hypothesis that HE is manifested by an increase in extracellular fluid, due in part to the glial activation and swelling, and causing low-grade edema. We would like to extend this study by examining a larger sample population in order to arrive at firmer conclusions. We would also like to investigate how fFW correlates with other DTI metrics, and with functional and spectroscopic imaging metrics to further understand the pathological process of HE.Acknowledgements
Funding from NIH grant, R01 NS094043.References
1. Zhang XD, et al. Multimodality magnetic resonance imaging in hepatic encephalopathy: an update. World J Gastroenterol. 2014 Aug 28;20(32):11262-72.
2. Shah NJ, et al. Quantitative cerebral water content mapping in hepatic encephalopathy. Neuroimage. 2008 Jul 1;41(3):706-17.
3. Winterdahl M, et al. Cerebral water content mapping in cirrhosis patients with and without manifest HE. Metab Brain Dis. 2019 Aug;34(4):1071-1076.
4. Pasternak O, et al. Estimation of extracellular volume from regularized multi-Shell diffusion MRI. Med Image. 2012;15:305-312.
5. Hoy AR, et al. Optimization of a free water elimination two-compartment model for diffusion tensor imaging. NeuroImage. 2014;103:323-333.
6. Oishi K, et al. Atlas-based whole brain white matter analysis using large deformation diffeomorphic metric mapping: application to normal elderly and Alzheimer's disease participants. Neuroimage. 2009;46(2):486-99.
Figures