1674
Longitudinal assessment of lesion volume and ADC in patients with Fabry disease: a 5 year follow up study1Radiology and Nuclear Medicine, Amsterdam UMC, Amsterdam, Netherlands, 2Endocrinology and Metabolism, Amsterdam UMC, Amsterdam, Netherlands, 3Biomedical Engineering and Physics, Amsterdam UMC, Amsterdam, Netherlands
Synopsis
We investigated whether local ADC changes precede the formation of white matter lesions (WML) in patients with Fabry disease. A dataset was collected, containing five-year follow-up MRI data of 46 patients with Fabry disease. Within WMLs, ADC values were significantly higher compared to healthy WM and kept increasing after first detection. Moreover, ADC values were significantly higher within regions that were detected at later time points as WML on FLAIR images. These findings indicate that diffusion weighted imaging could play an important role in predicting which patients are at risk of lesion formation and require preemptive treatment.
Introduction
Fabry disease is a rare lysosomal storage disease, affecting several organs including the brain. A common finding in this disease is the presence of white matter lesions (WML)1. Although an imaging biomarker for WML formation has not yet been found, this could provide valuable information on which patients are at particular risk and require early treatments. Changes in diffusion are thought to precede the development of WMLs in patients with Fabry disease due to the impairment in the formation of nitric oxide, a protective molecule in the vasculature2,3. Therefore, diffusion-weighted imaging (DWI) might detect tissue at risk earlier than commonly used fluid attenuated inversion recovery (FLAIR) acquisitions. In this work, we present the preliminary results of a retrospective study in which diffusion data from yearly follow-up MRI scans in Fabry patients were studied.Methods
MRI data on patients with a definite Fabry disease diagnosis and a classical Fabry disease phenotype were extracted from the Amsterdam UMC database. Patients were included when at least four MRI datasets containing a T1 anatomical, FLAIR and DWI were available. DWIs were acquired with a single-shot 2D-EPI sequence with acquisition parameters: TR/TE = 6400/83 ms, voxel size 1.8x1.8x3.0 mm3, matrix size 112x126x49 and b-values: 0 and 1000 s/mm2. Apparent diffusion coefficient (ADC) maps were calculated with standard scanner software. All data were acquired on 3T scanners (Philips Intera and Philips Ingenia, Philips Medical Systems, Best, The Netherlands).First, FLAIR images and ADC maps were resliced to the T1 anatomical resolution using SPM124. Then, WML were automatically segmented from the FLAIR scans using the lesion segmentation toolbox (LST)5. White matter (WM) was segmented from the T1 anatomical image of the first time point using CAT126. For each patient, every T1 scan was linearly registered to all other T1 scans using FSL7 and the resulting transformations were applied to the WML masks and ADC maps.
To identify lesions that were formed between two follow up scans, WML masks from earlier time points were subtracted from the latest WML mask. Thus, for all patients, at every available time point, an ROI was created that included WML areas that were not detected at earlier time points. To avoid false positive detections, unconnected lesions below an empirically defined volume were excluded. Healthy appearing WM was defined by subtracting all WML masks from the WM segmentation and eroding the result to reduce partial volume effects from neighboring tissue. Median ADC values within each ROI and the difference compared to healthy appearing WM were calculated.
Because the aim was to predict lesion progression, patients showing a significant total increase in WML volume over all time points (>1mL) were selected for further analysis.
A repeated-measures mixed-effect model, with Dunnett multiple comparison correction, was used to test if the median ADC from each ROI, was at any time point significantly different compared to healthy appearing WM. Similarly, the differences compared to healthy appearing WM ADC were tested to be significantly different from zero.
Results
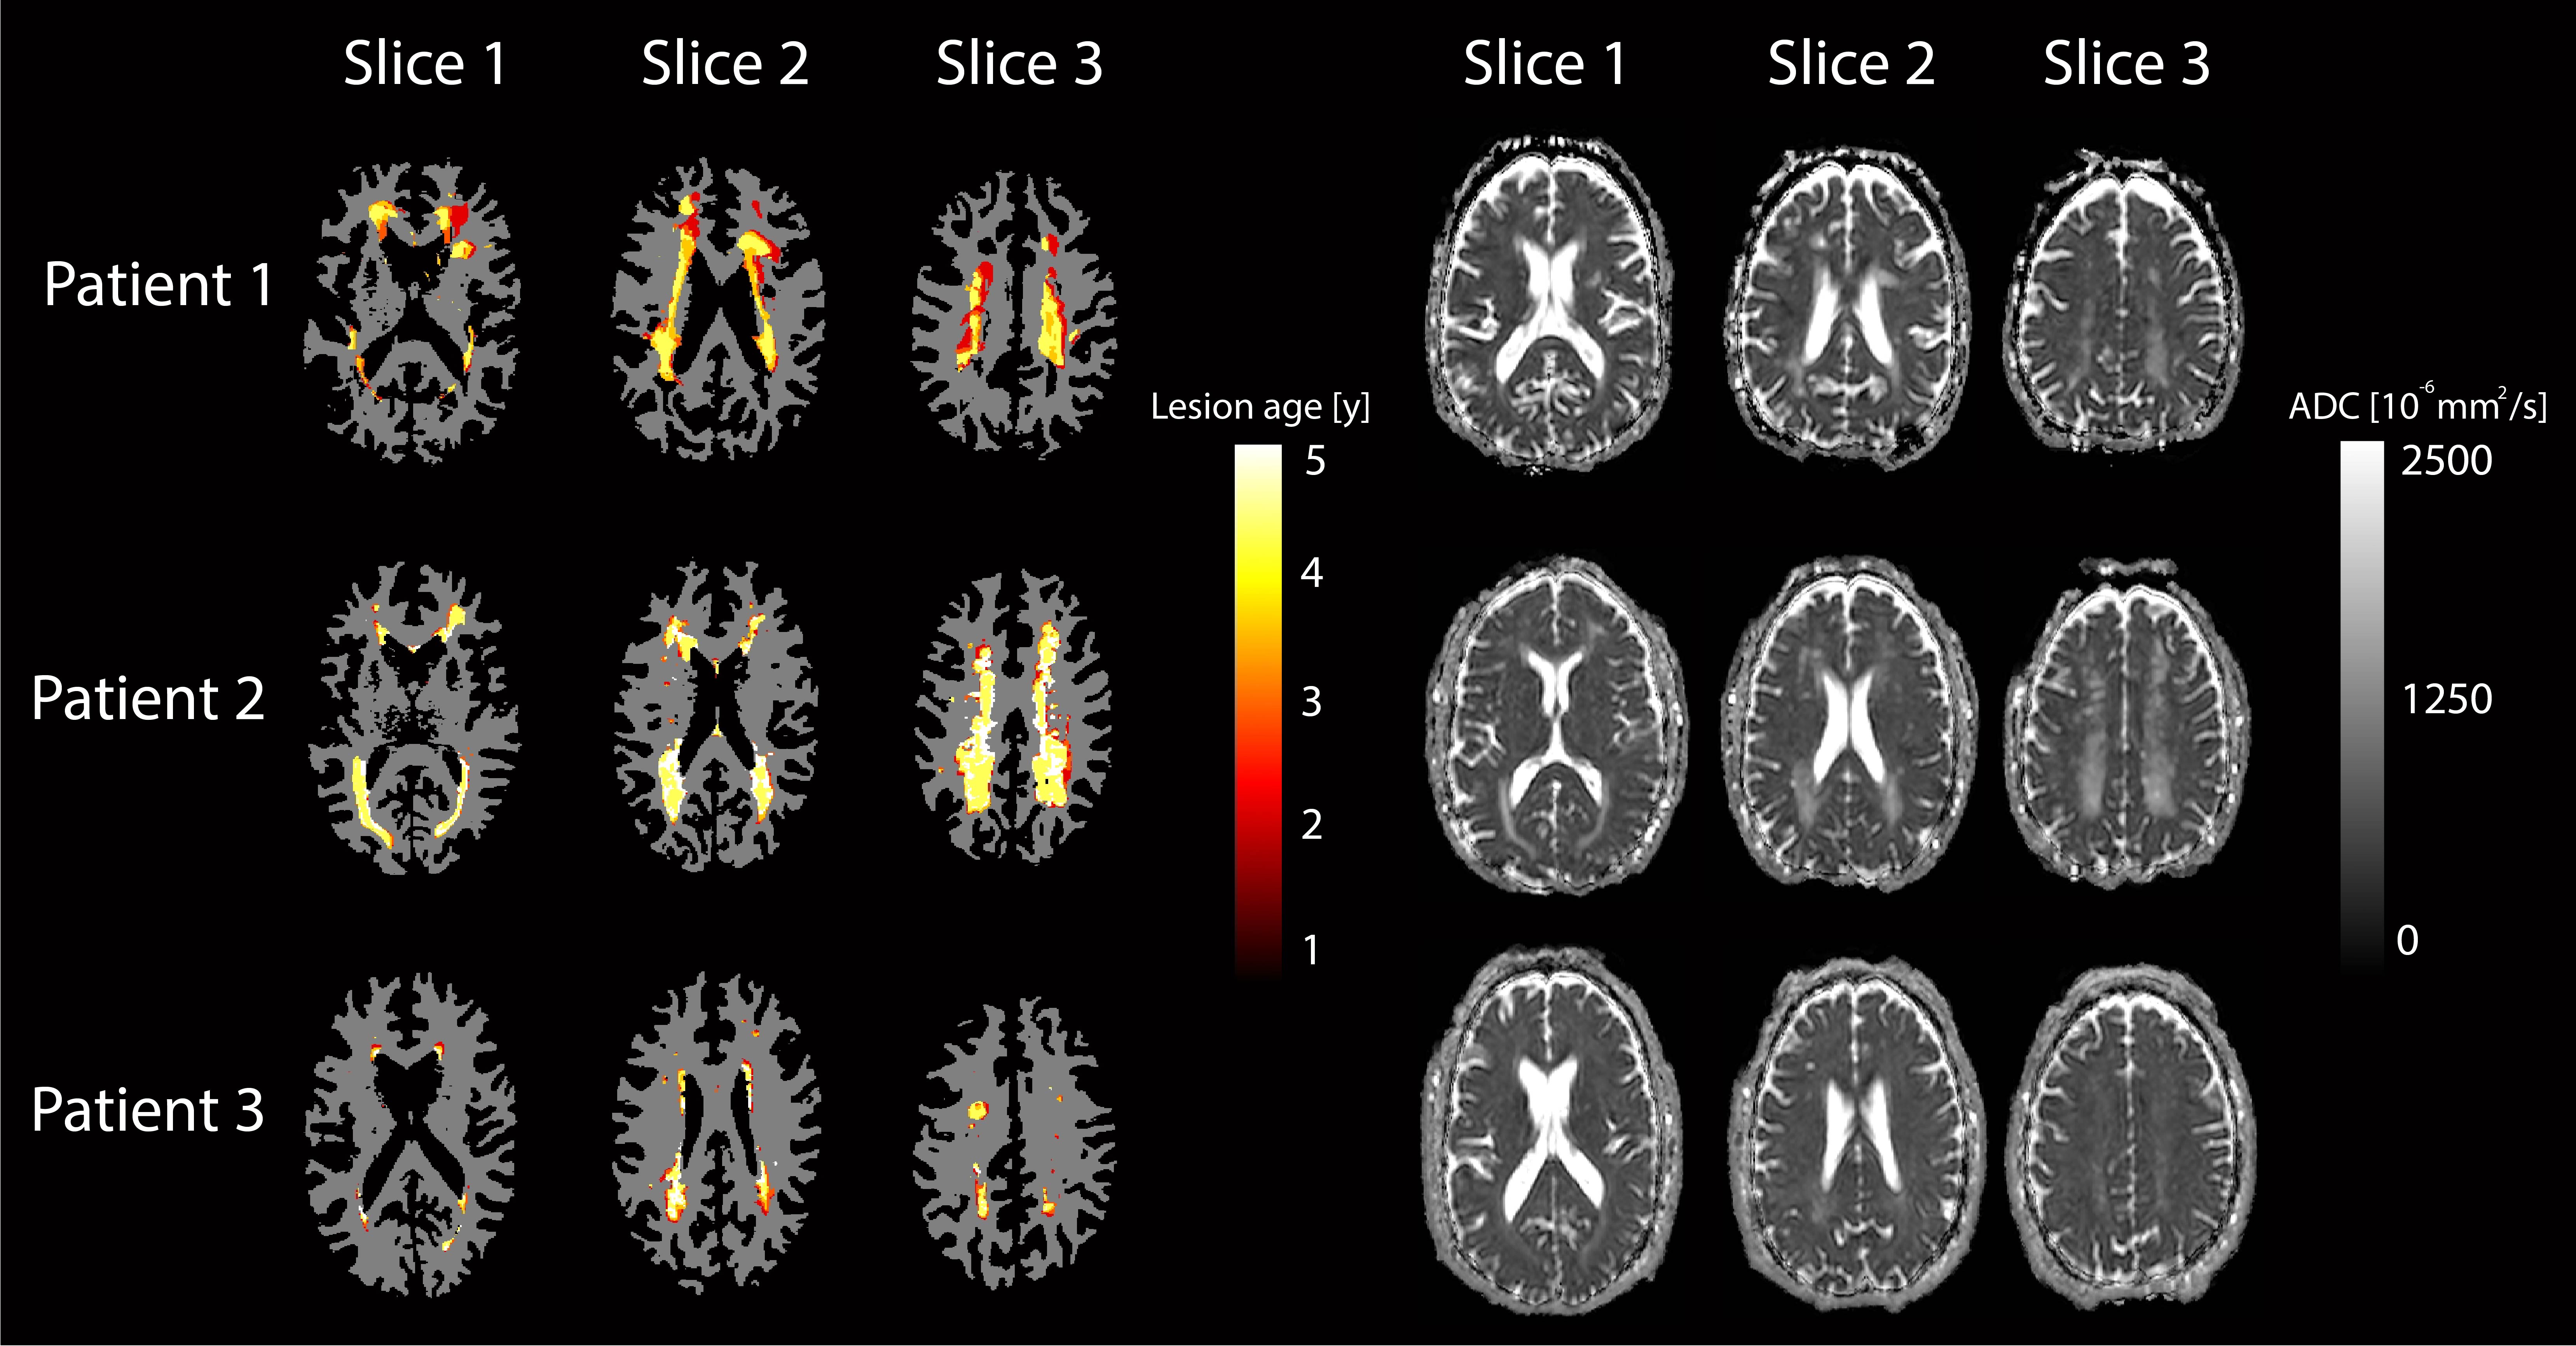
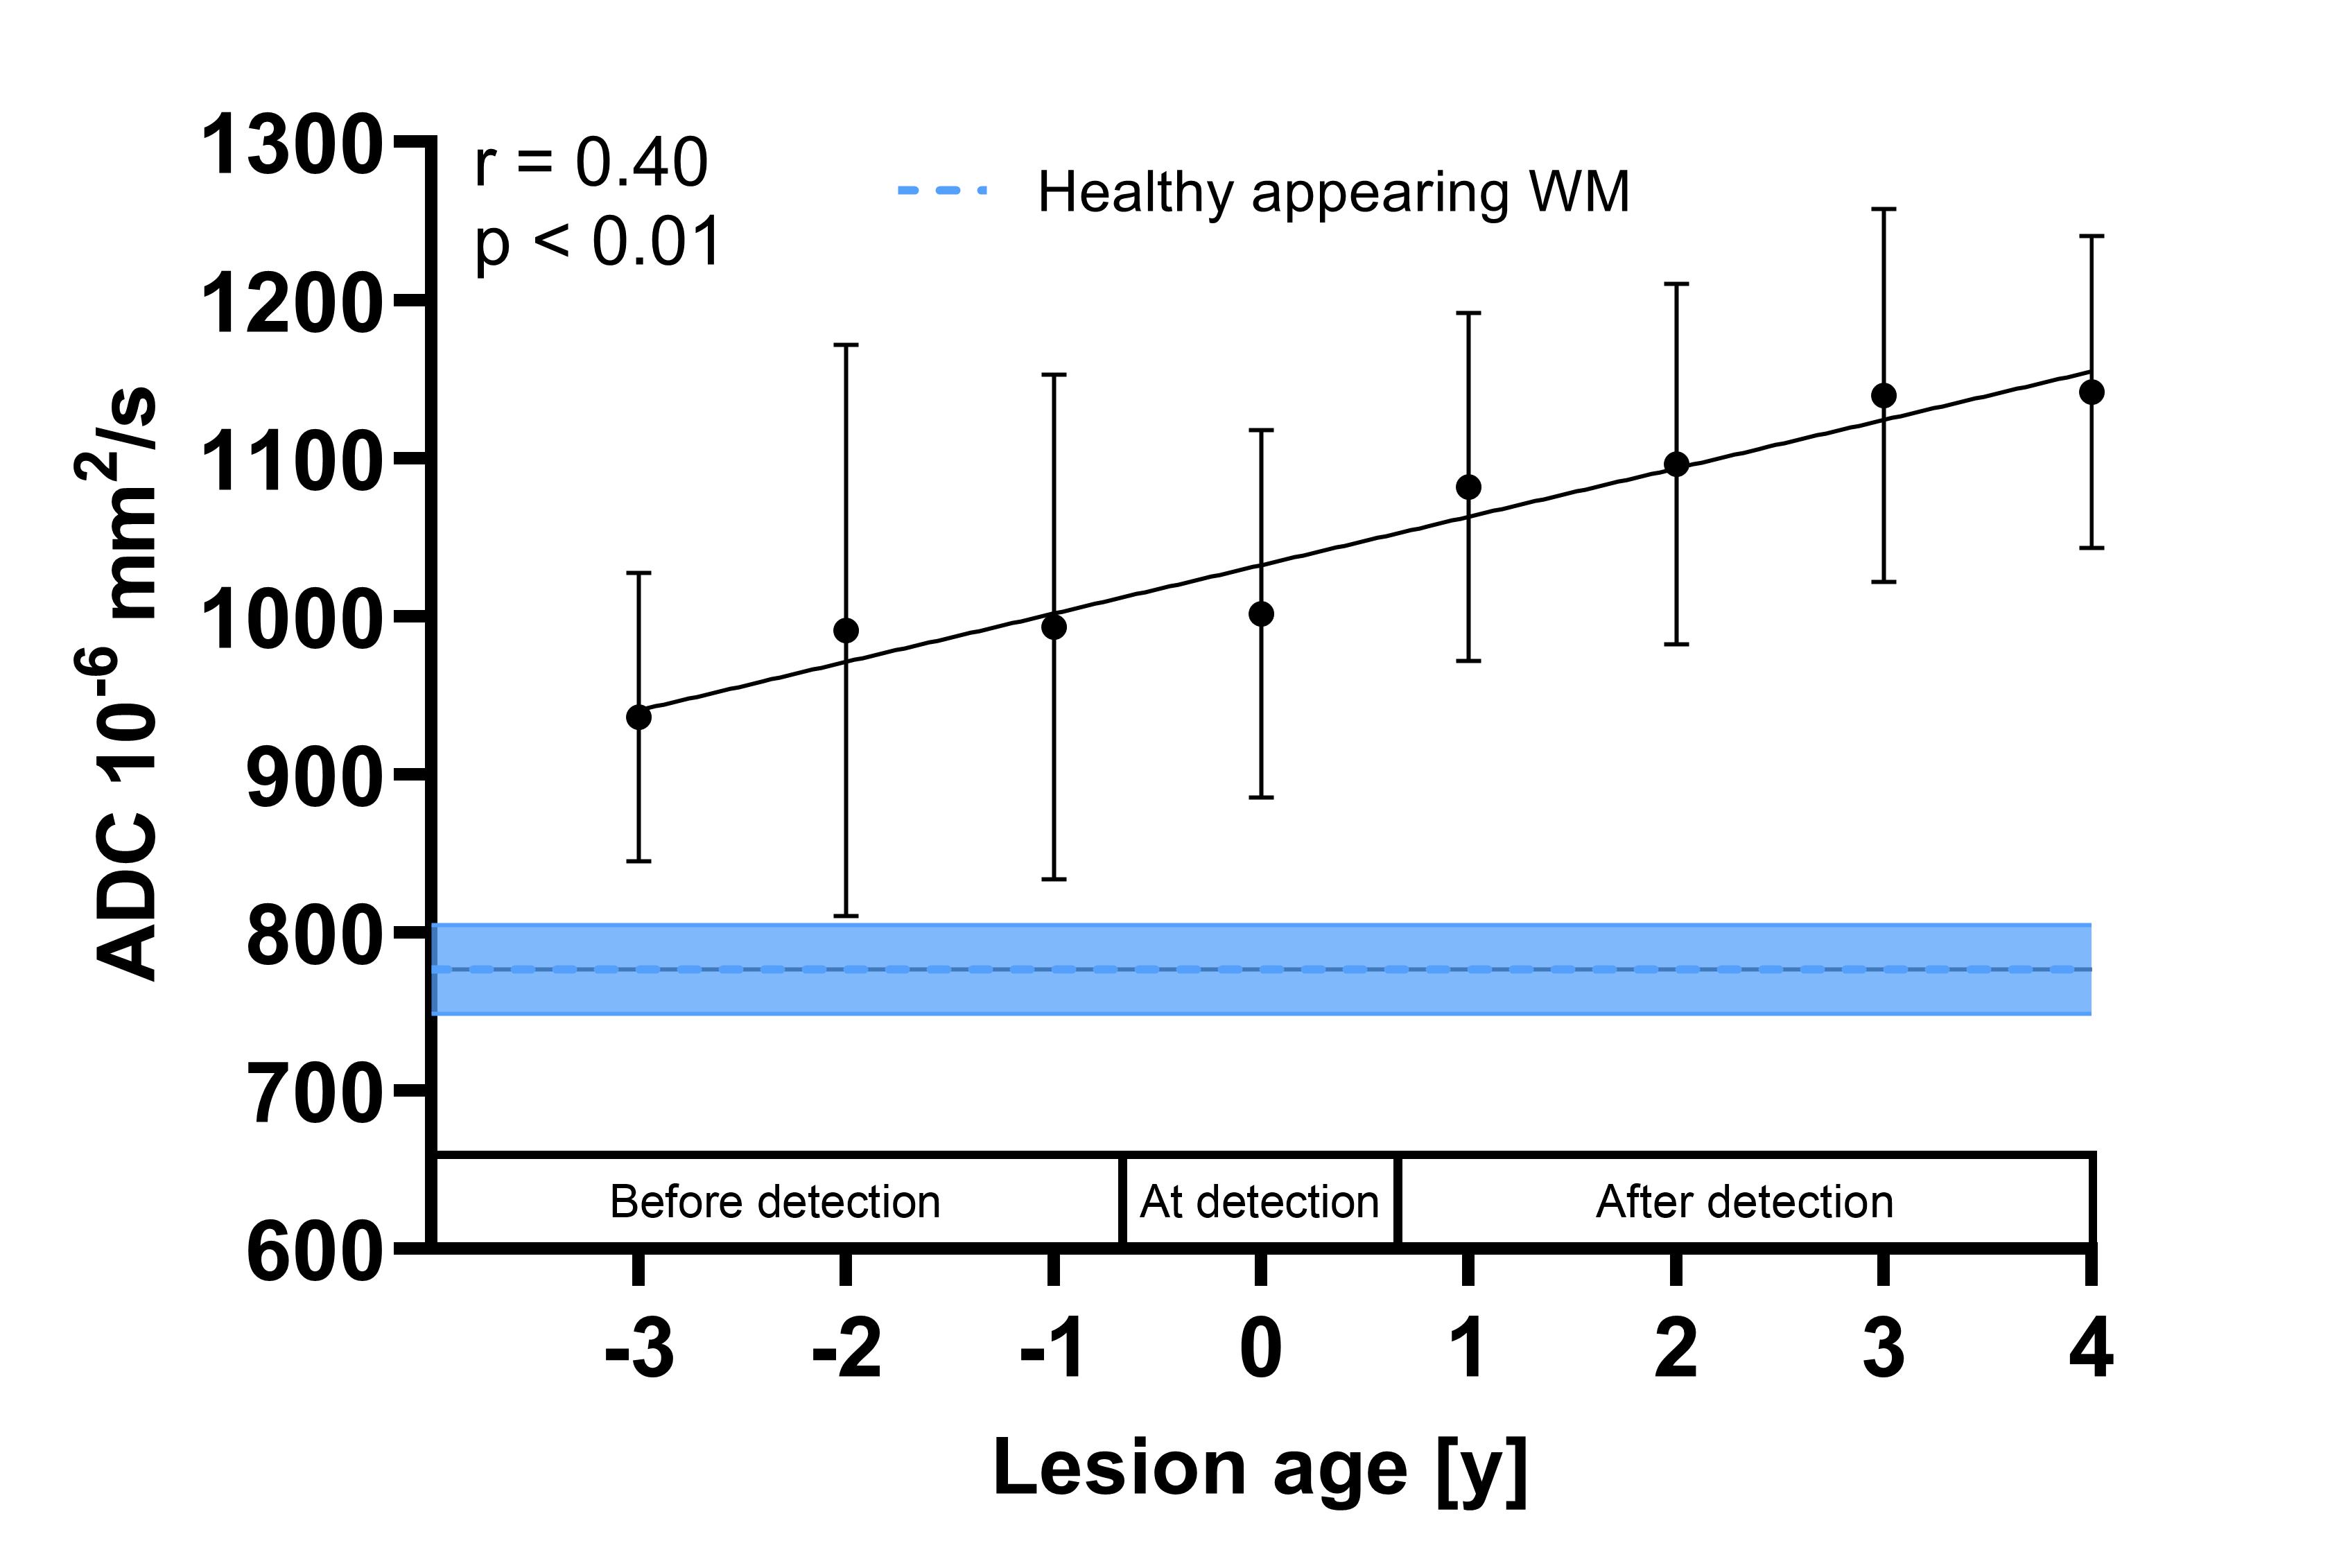
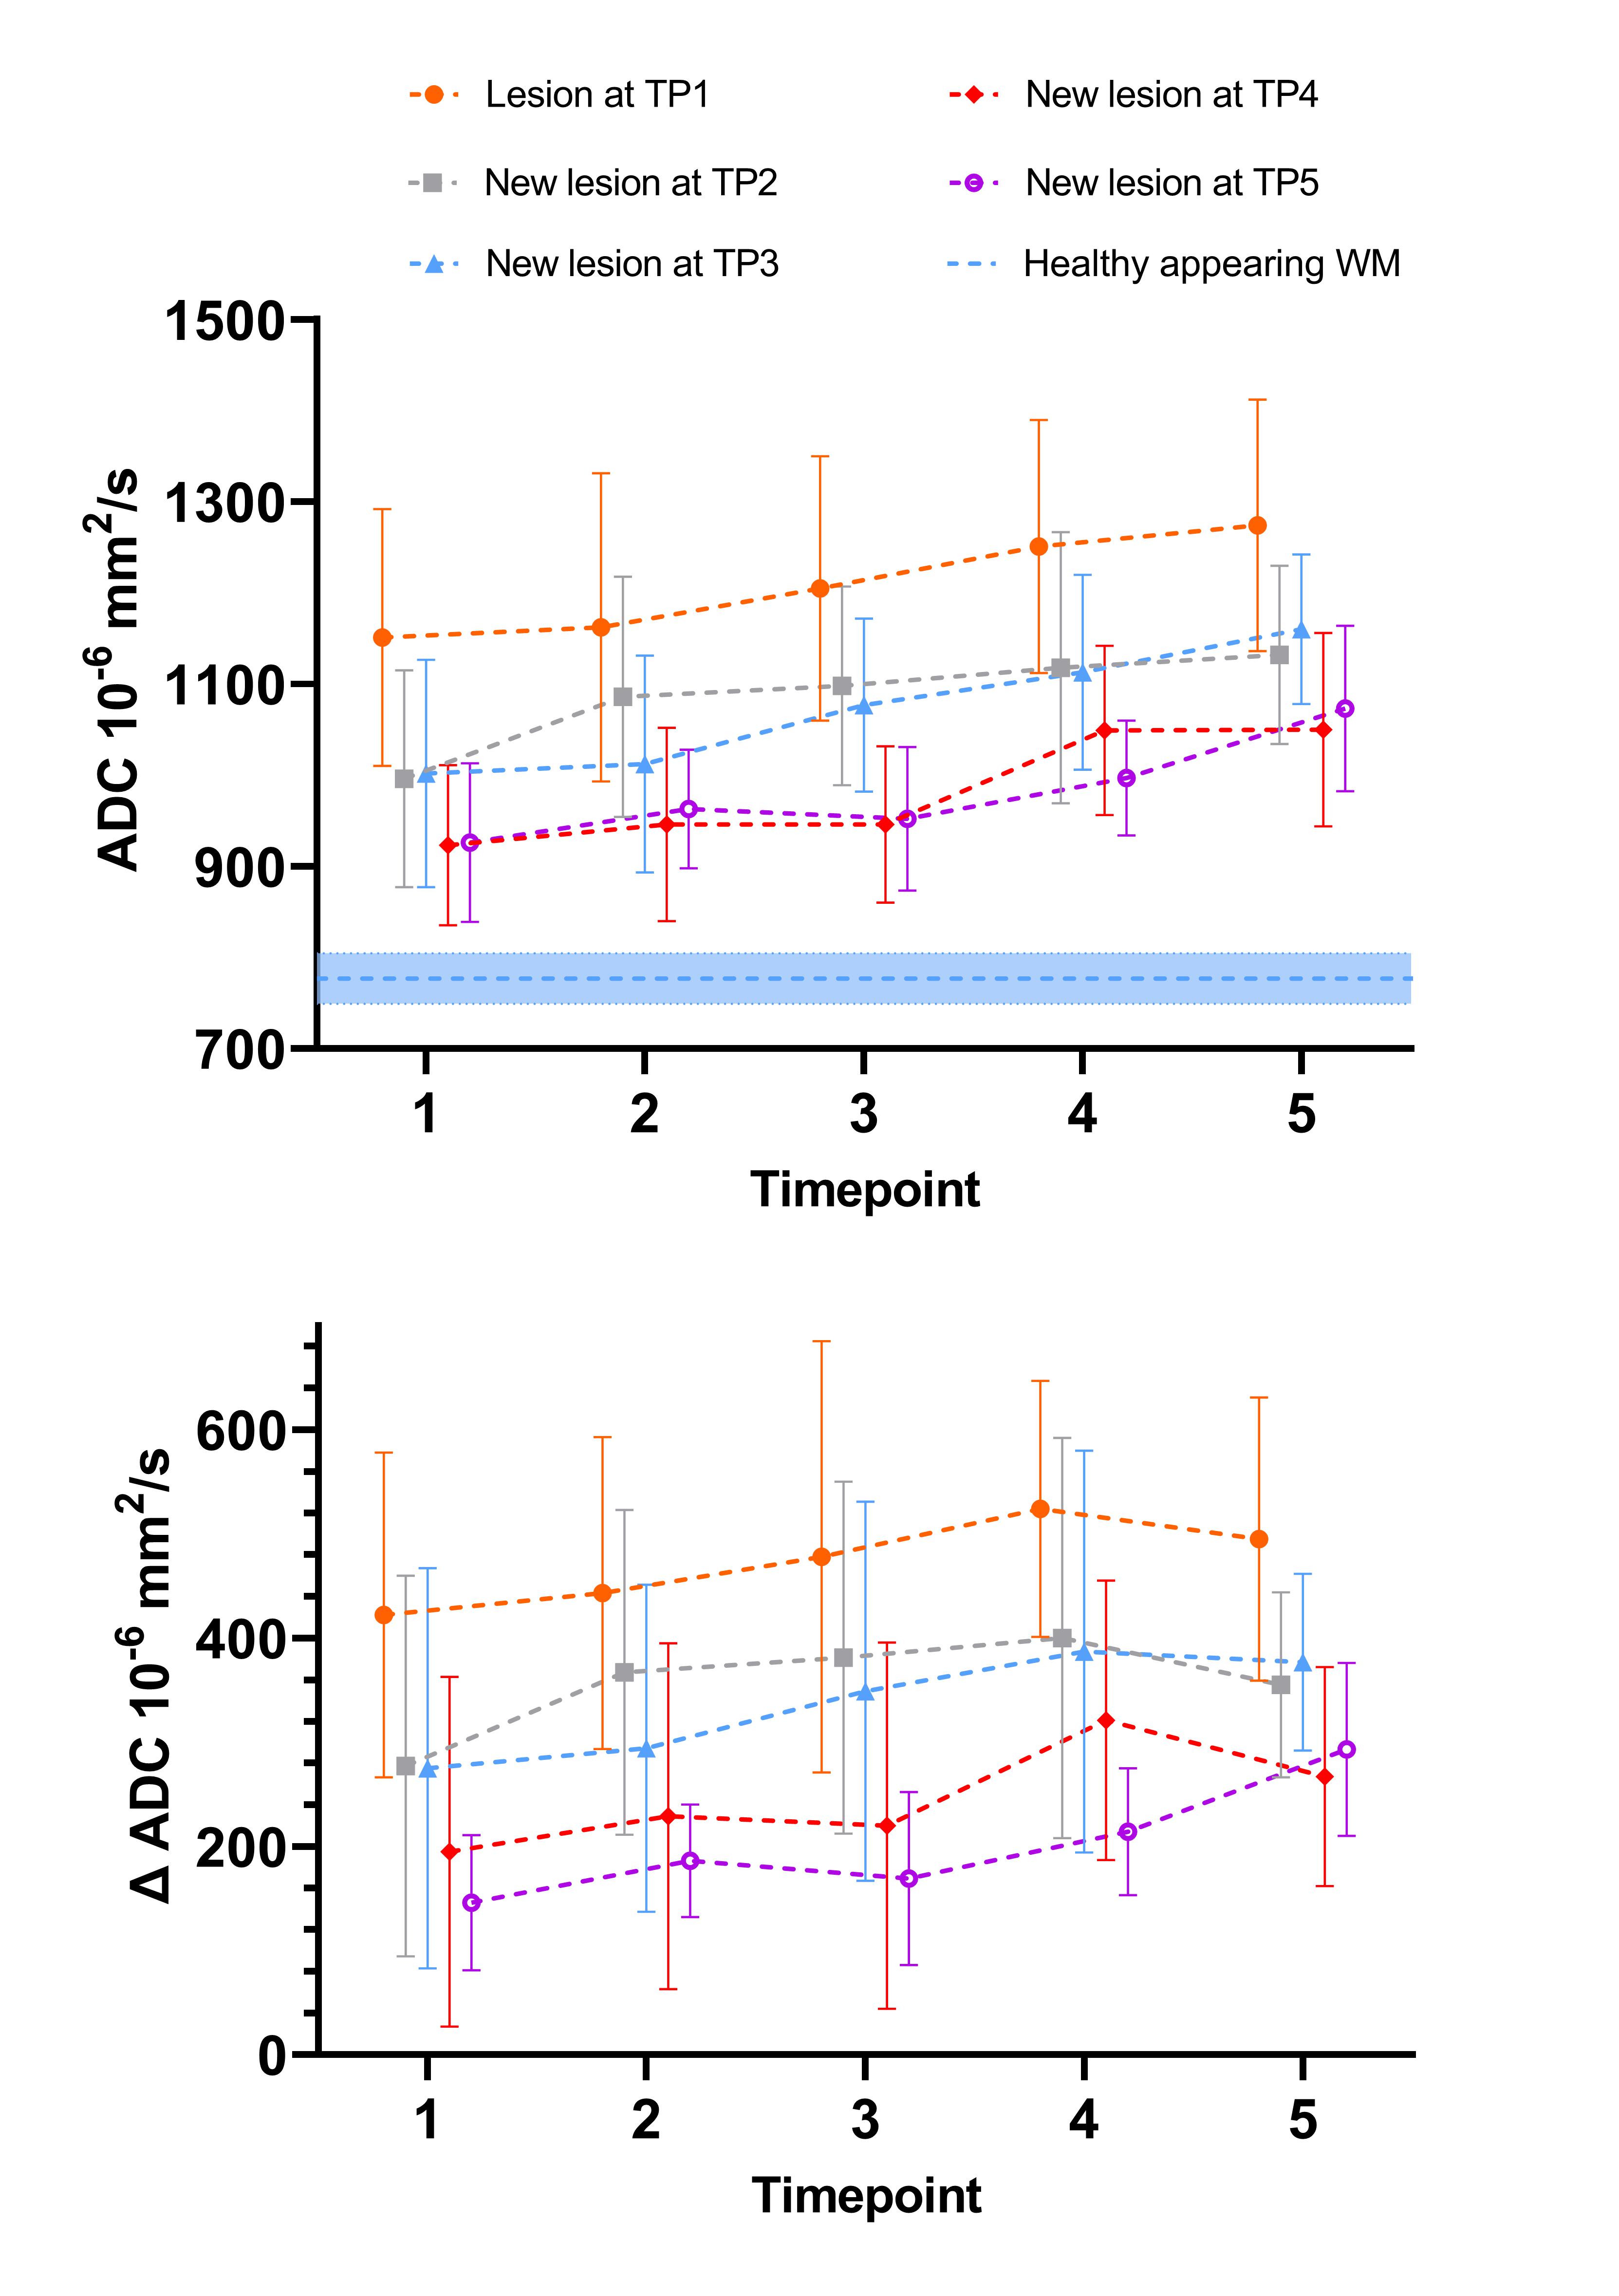
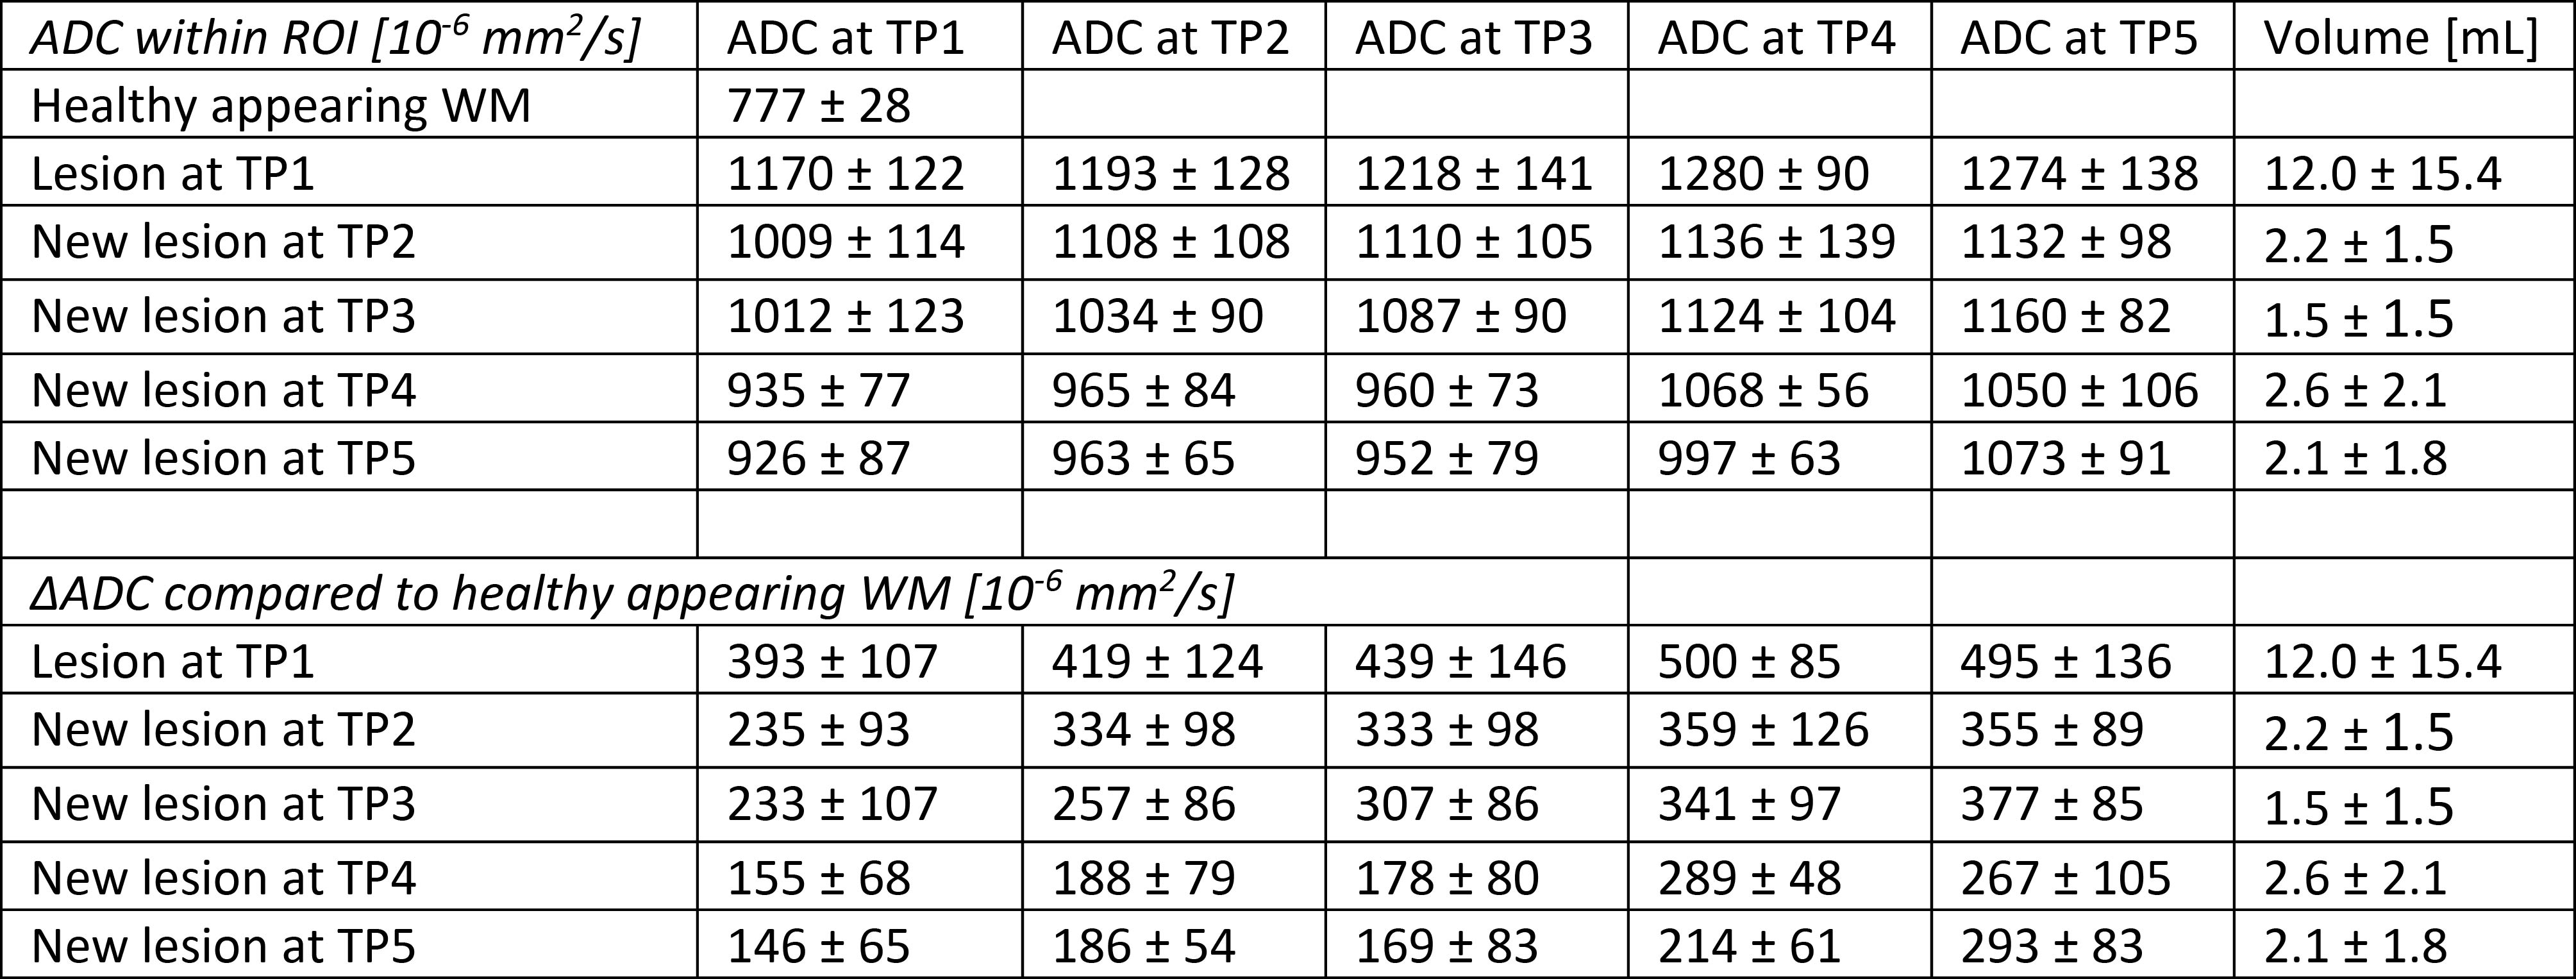
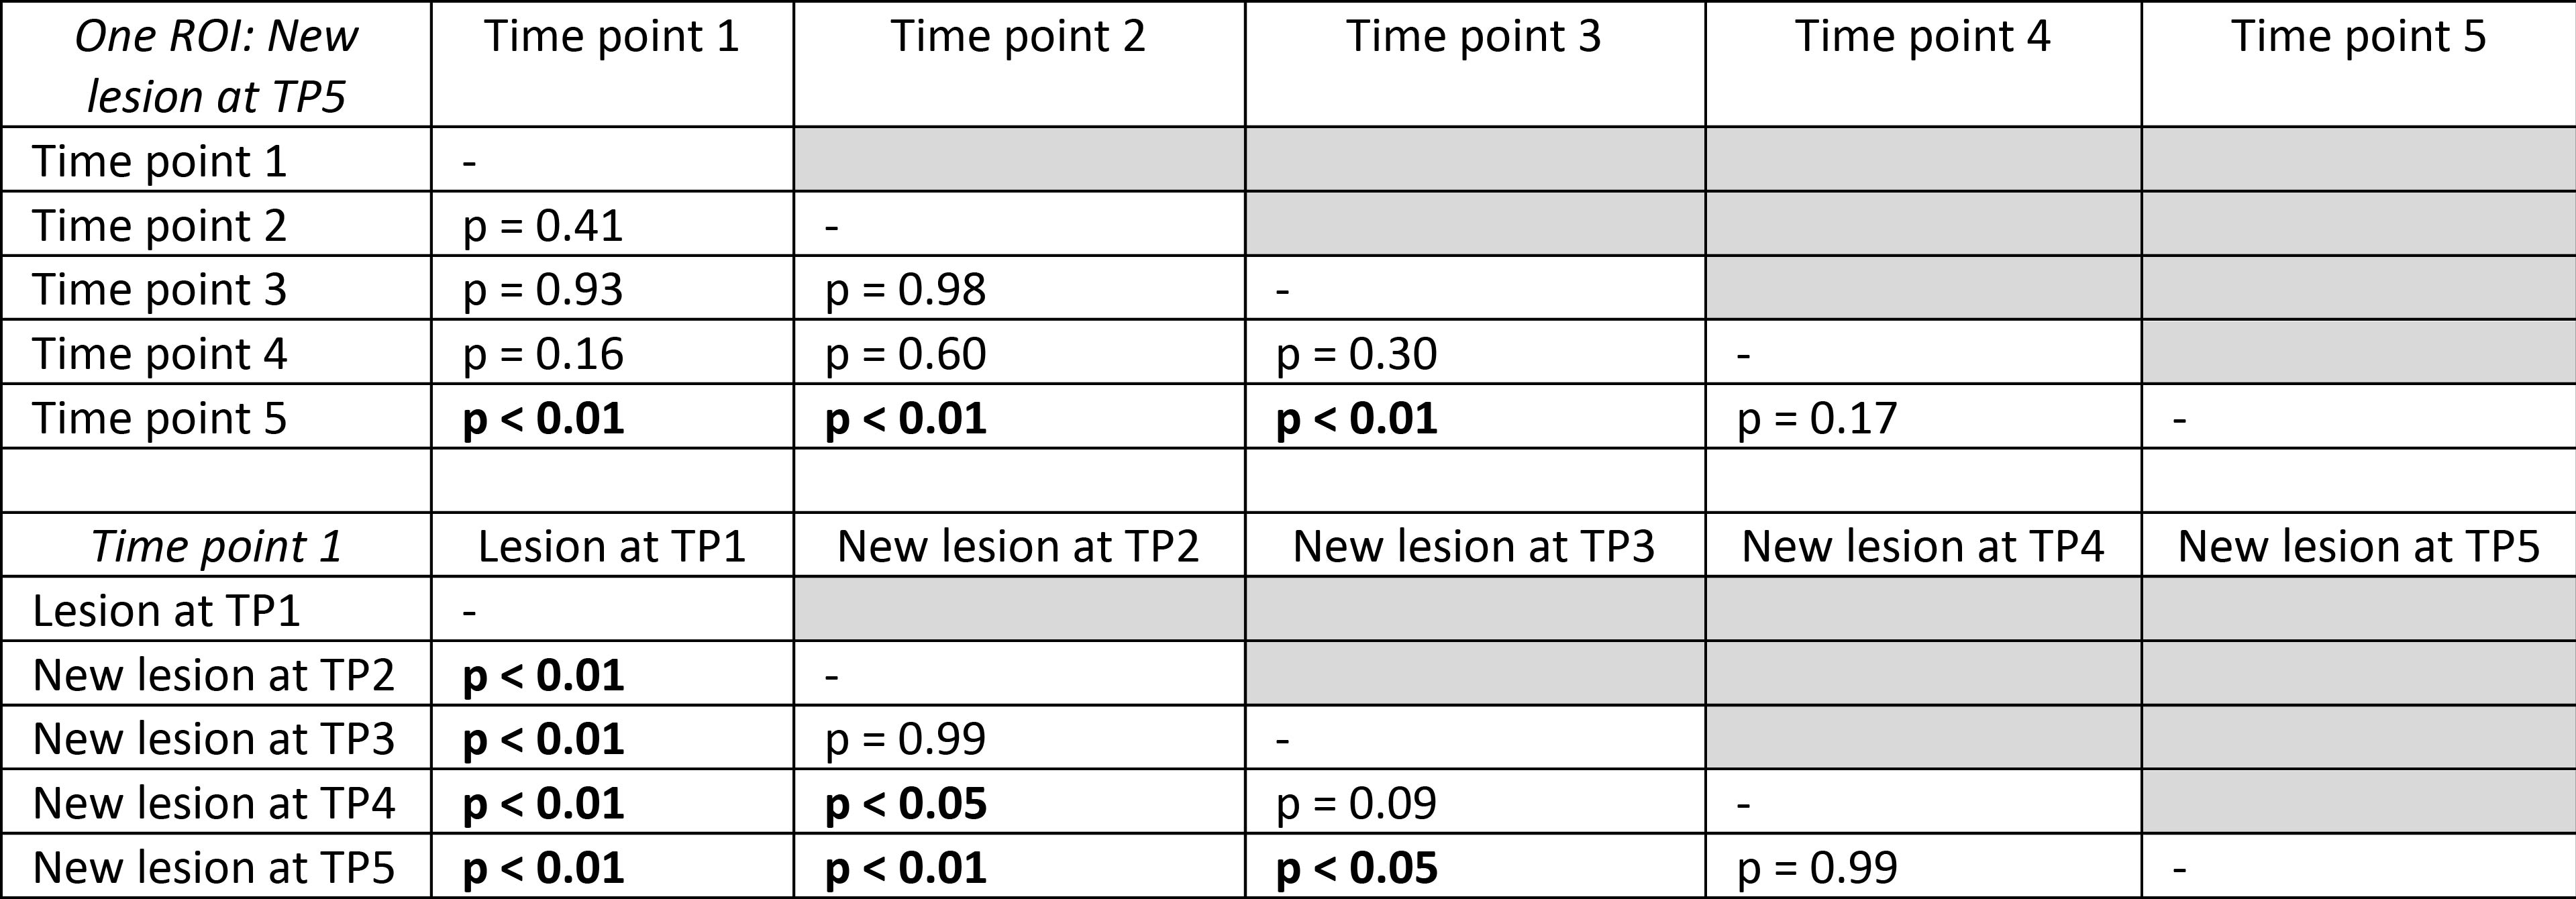
46 patients (22 women, 39 ± 15 years old) with a median of five MRI examinations were included into the study. Sixteen patients (eight women, 52 ± 7 years old) showed WML progression and were further investigated. From three of these patients, lesion maps showing the age of WML, together with the corresponding ADC maps are shown in Figure 1. ADC values within WMLs detected during the study increased with lesion age (Figure 2).Averaged ADC values from all patients showing WML progression are shown in Figure 3 and Table 1. Within WMLs, ADC was significantly higher compared to healthy appearing WM (p<0.01) and kept increasing after first detection. Moreover, regions that were detected as WML after the first time point, showed significantly higher ADC values compared to healthy appearing WM at all earlier time points (p<0.01). Comparing the same ROI at different time points as well as different ROIs at one time point revealed significantly increased ADC within older lesions (Table 2).
Discussion and conclusion
In this work we presented preliminary results from a unique longitudinal dataset of 46 patients with Fabry disease. We found that ADC values were significantly higher within regions that at later time points were detected as WML. This suggests that alterations in ADC might detect tissue at risk for WML progression in patients with Fabry disease before it attenuates on commonly used FLAIR images. However, it must be pointed out that in most patients, WMLs expanded rather than originated during the study. For future analysis we aim to focus on lesions that originated during the study to determine if DWI can truly identify patients at risk of future WML formations. Another limitation of this study is the lack of a control group. Therefore, we could not compare the observed WML ADC values with healthy WM ADC values from the same location in the brain. To conclude, our results suggest that diffusion is affected before WMLs are detected on FLAIR images. Therefore, we believe that DWI could be a potential valuable predictor for the development of WML in patients with Fabry disease.Acknowledgements
No acknowledgement found.References
1. Körver, S. et al. Determinants of cerebral radiological progression in Fabry disease. J. Neurol. Neurosurg. Psychiatry 91, 756–763 (2020).
2. Politei, J. M. & Capizzano, A. A. Magnetic resonance image findings in 5 young patients with fabry disease. Neurologist 12, 103–105 (2006).
3. Förstermann, U. & Münzel, T. Endothelial nitric oxide synthase in vascular disease: From marvel to menace. Circulation 113, 1708–1714 (2006).
4. SPM12, Wellcome Trust Centre for Neuroimaging, London, UK; www.fil.ion. ucl.ac.uk/spm
5. Schmidt, P. et al. An automated tool for detection of FLAIR-hyperintense white-matter lesions in Multiple Sclerosis. Neuroimage (2012)
6. Gaser, C. & Dahnke, R. CAT-a computational anatomy toolbox for the analysis of structural MRI data. HBM 336–348 (2016).
7. Jenkinson, M., Bannister, P., Brady, M. & Smith, S. Improved optimization for the robust and accurate linear registration and motion correction of brain images. Neuroimage (2002)
Figures