1671
Power spectral density of salience network alterations in obsessive-compulsive disorder: Impact on thought-action fusion performance1Medical & Biological Engineering, Kyungpook National University, Daegu, Korea, Republic of, 2Psychiatry, Kyungpook National University Hospital, Daegu, Korea, Republic of, 3Kyungpook National University, Daegu, Korea, Republic of, 4Radiology and Molecular Medicine, Kyungpook National University, Daegu, Korea, Republic of
Synopsis
Obsessive-compulsive disorder (OCD) showed the functional connectivity alterations in default mode network (DMN), central executive network (CEN) and salience network (SN) 1. We investigated the difference of intrinsic networks between OCD and healthy controls (HC) from thought-action fusion (TAF) task and resting state by using fMRI. During TAF task, Power spectral density (PSD) of SN in OCD showed lower than PSD in HC in low-frequency bins. PSD of SN showed a significant correlation with TAF score and OBQ scale in OCD. Therefore when doing TAF task, OCD symptoms might have relations with alterations of PSD of SN.
Introduction
Obsessive-compulsive disorder (OCD) showed the functional connectivity alterations in default mode network (DMN), central executive network (CEN) and salience network (SN) 1. We investigated the difference of intrinsic networks between OCD and healthy controls (HC) from thought-action fusion (TAF) task and resting state by using fMRI. During TAF task, Power spectral density (PSD) of SN in OCD showed lower than PSD in HC in low-frequency bins. PSD of SN showed a significant correlation with TAF score and OBQ scale in OCD. Therefore when doing TAF task, OCD symptoms might have relations with alterations of PSD of SN.Methods
Thirty-six OCD patients and 45 healthy control subjects participated in this study (Table 1). All participants were right-handed and carried out some questionnaire before and after fMRI scan. All participants received written informed consent and the study protocol was approved by the Institutional Review Board at Kyungpook National University Hospital. Each participant conducted resting state fMRI and the TAF task during the fMRI acquisition 4 as responding degree of reminding. TAF task was consisted of four conditions which have shock/no-shock and suppressed/unsuppressed factors. The red sign of lightning informed an electrical shock which made another person irritated to the subjects. fMRI data were acquired using a 3.0T GE DISCOVERY scanner (EPI, TR=2000ms, TE=30ms, FOV=23 cm, Matrix=64x64, Thickness=4.0mm, no gap). Image preprocessing and independent component analysis for fMRI data were performed using SPM12 and GIFT toolbox based on MATLAB. The overall pre-processed fMRI data analyzed using both independent component analysis (ICA) and power spectral density (PSD) analysis. Two sample t-test and Pearson’s correlation analyzed behavioral data using SPSS software.Results and Discussion
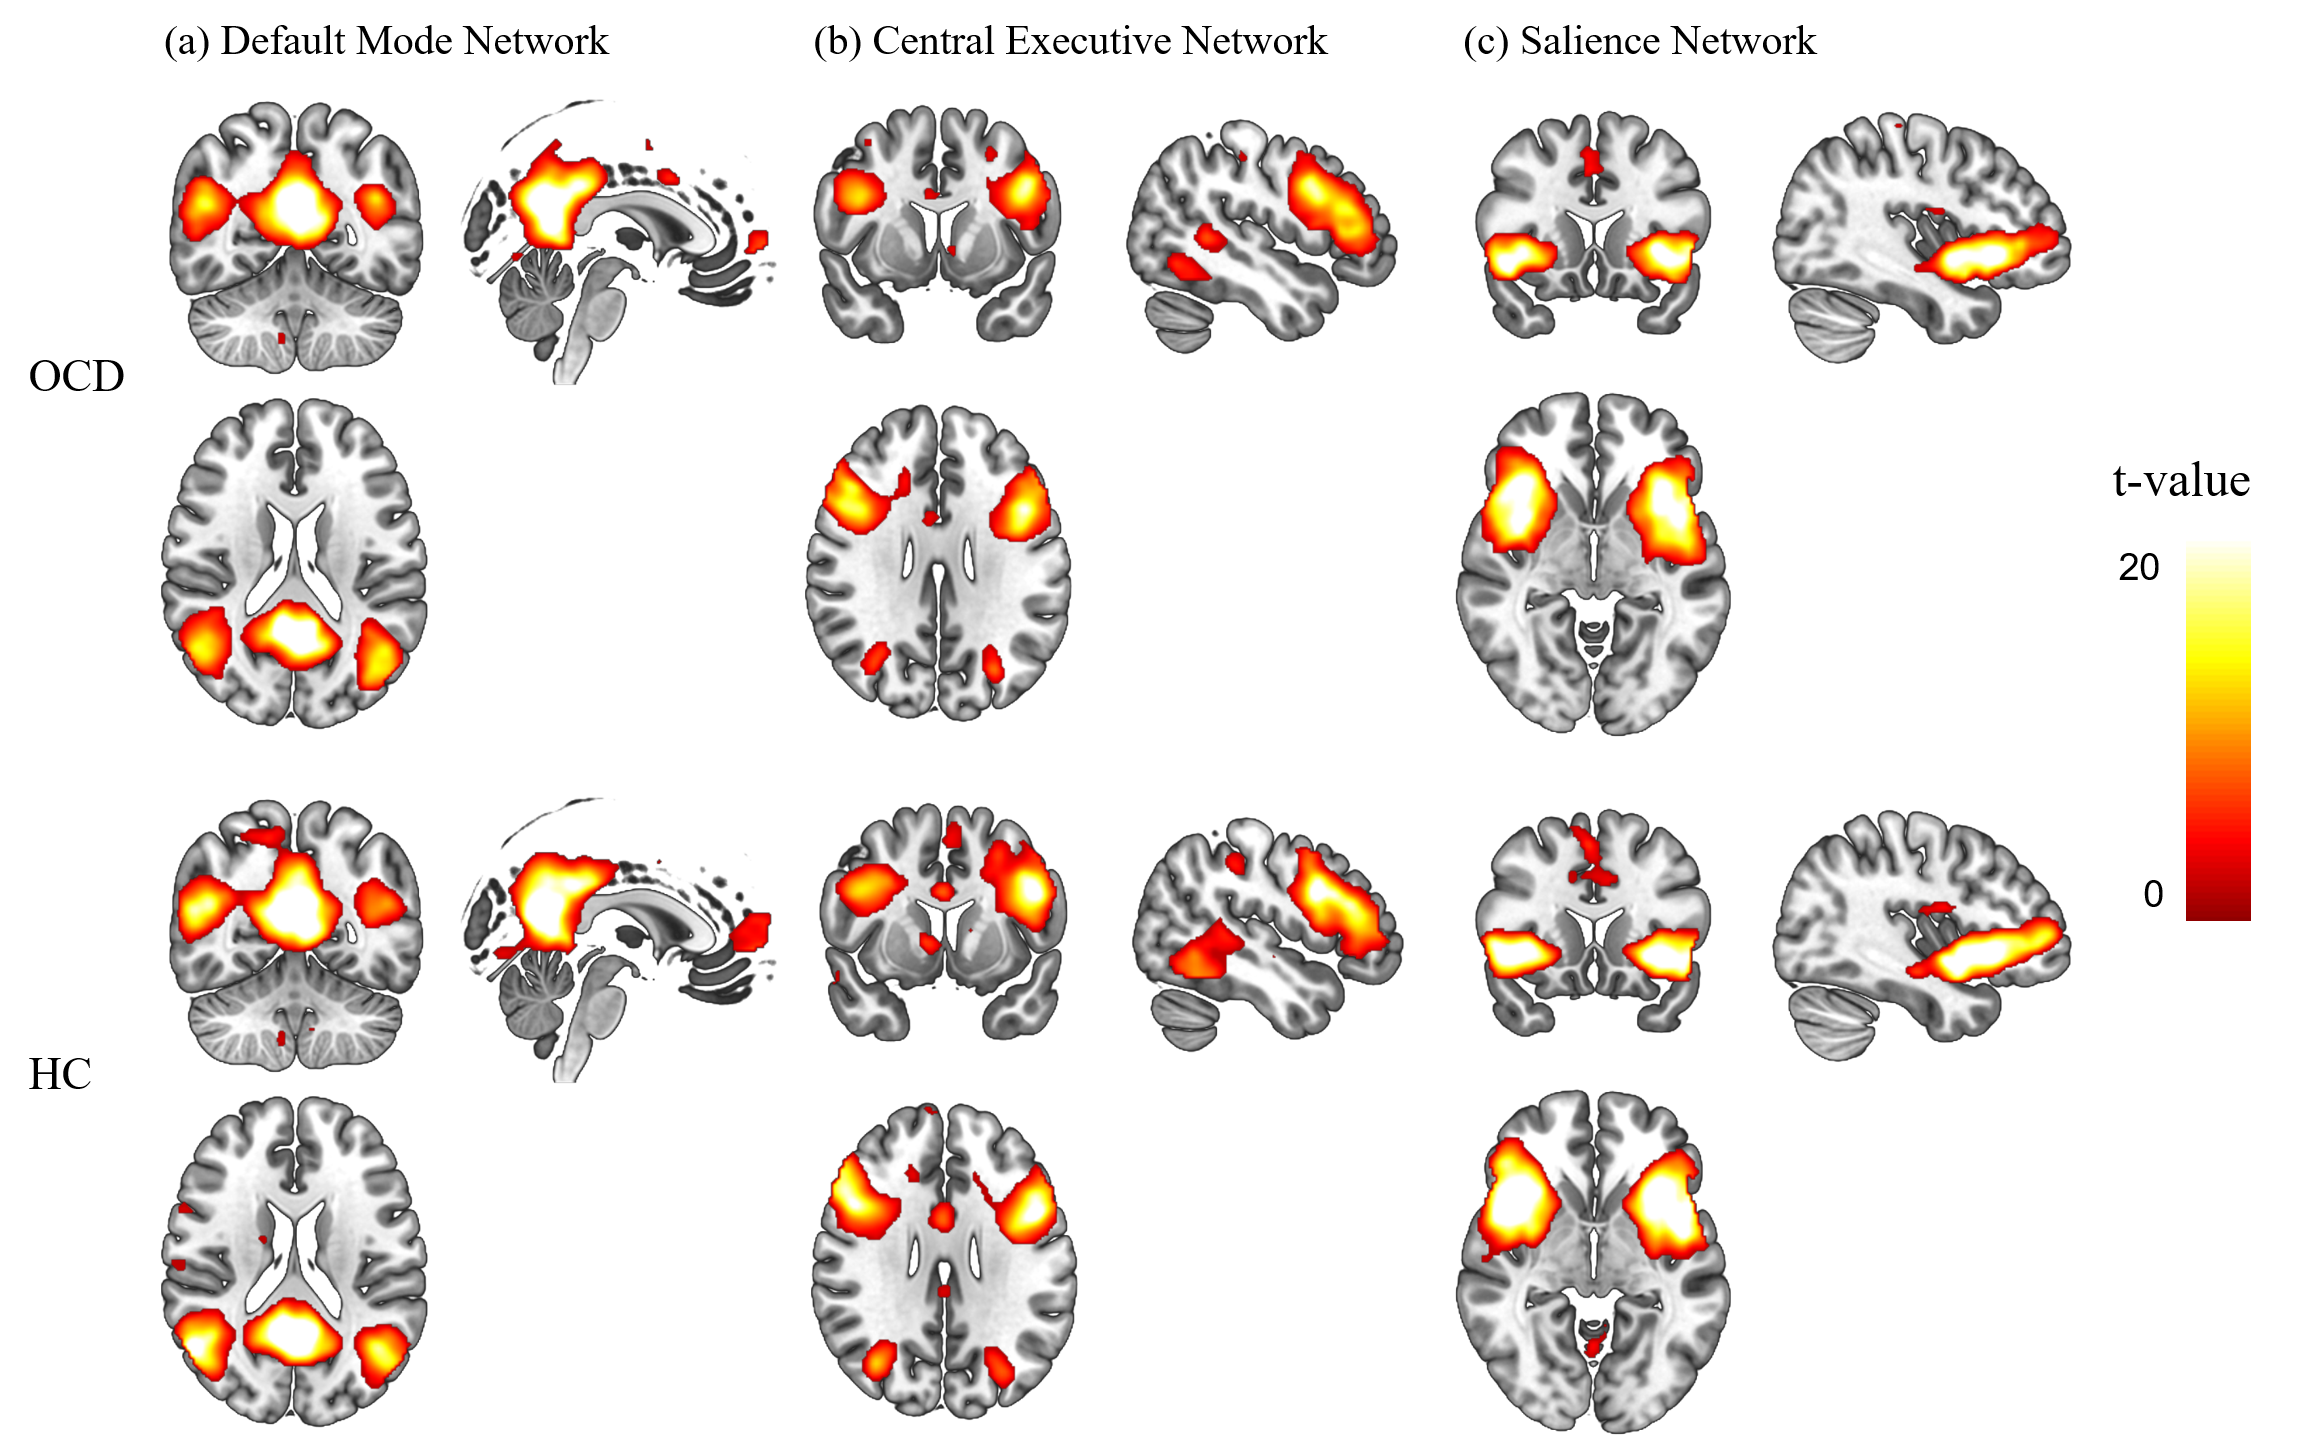
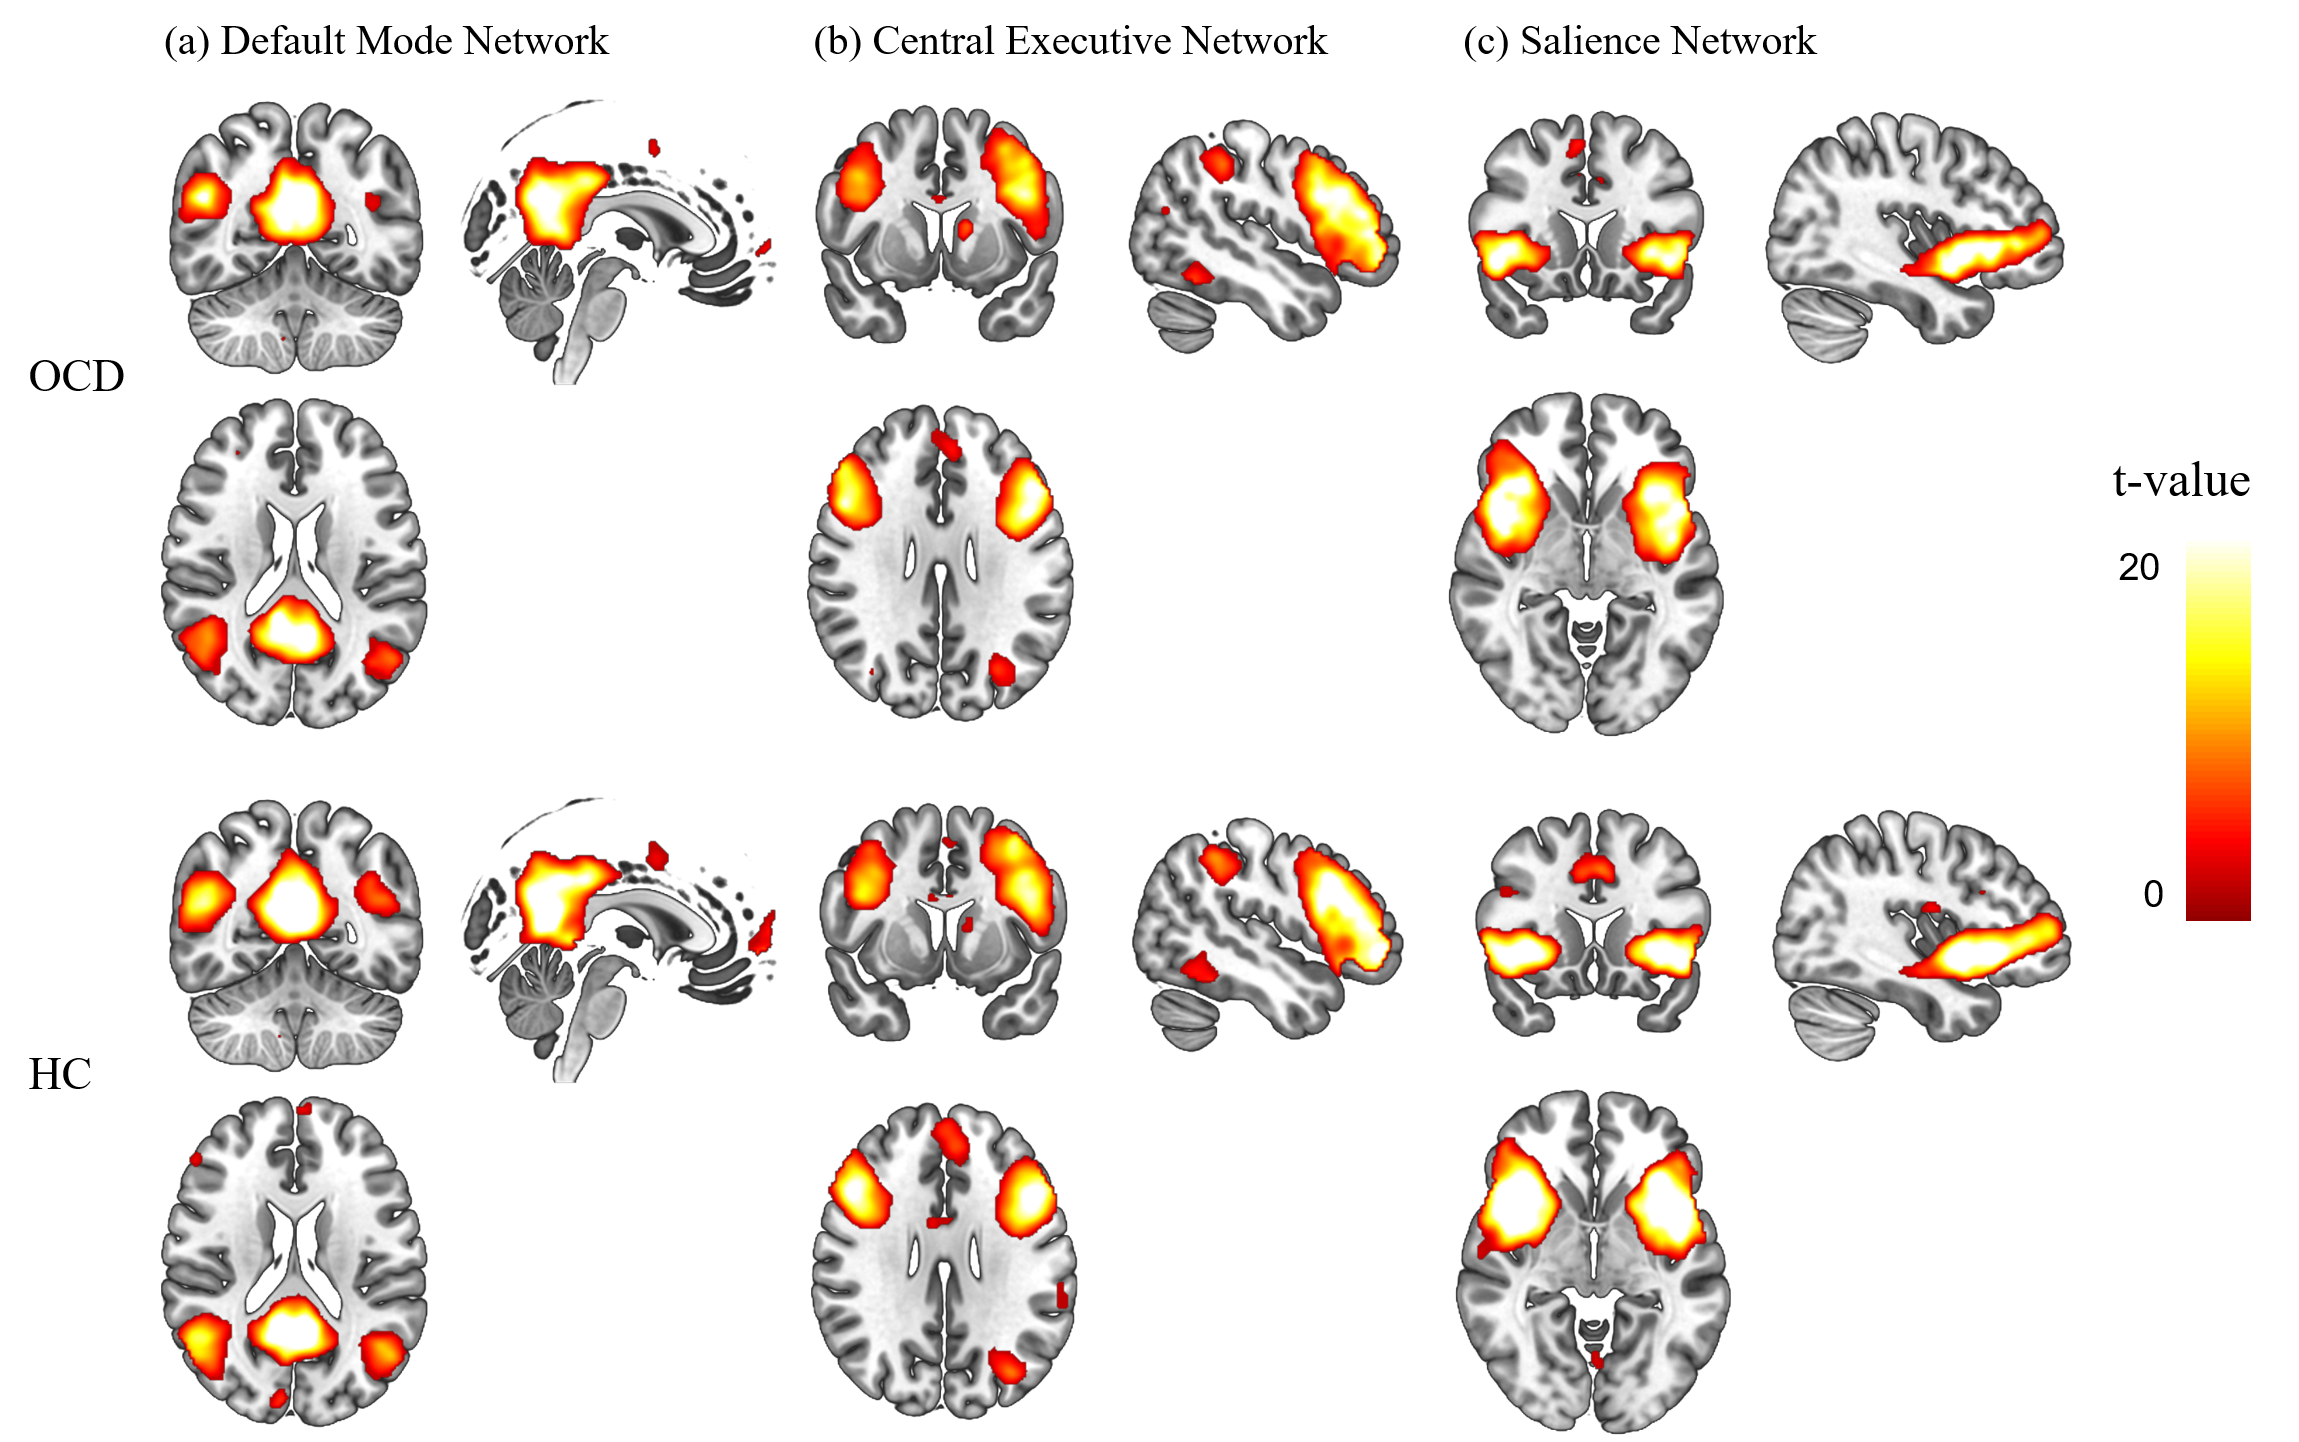
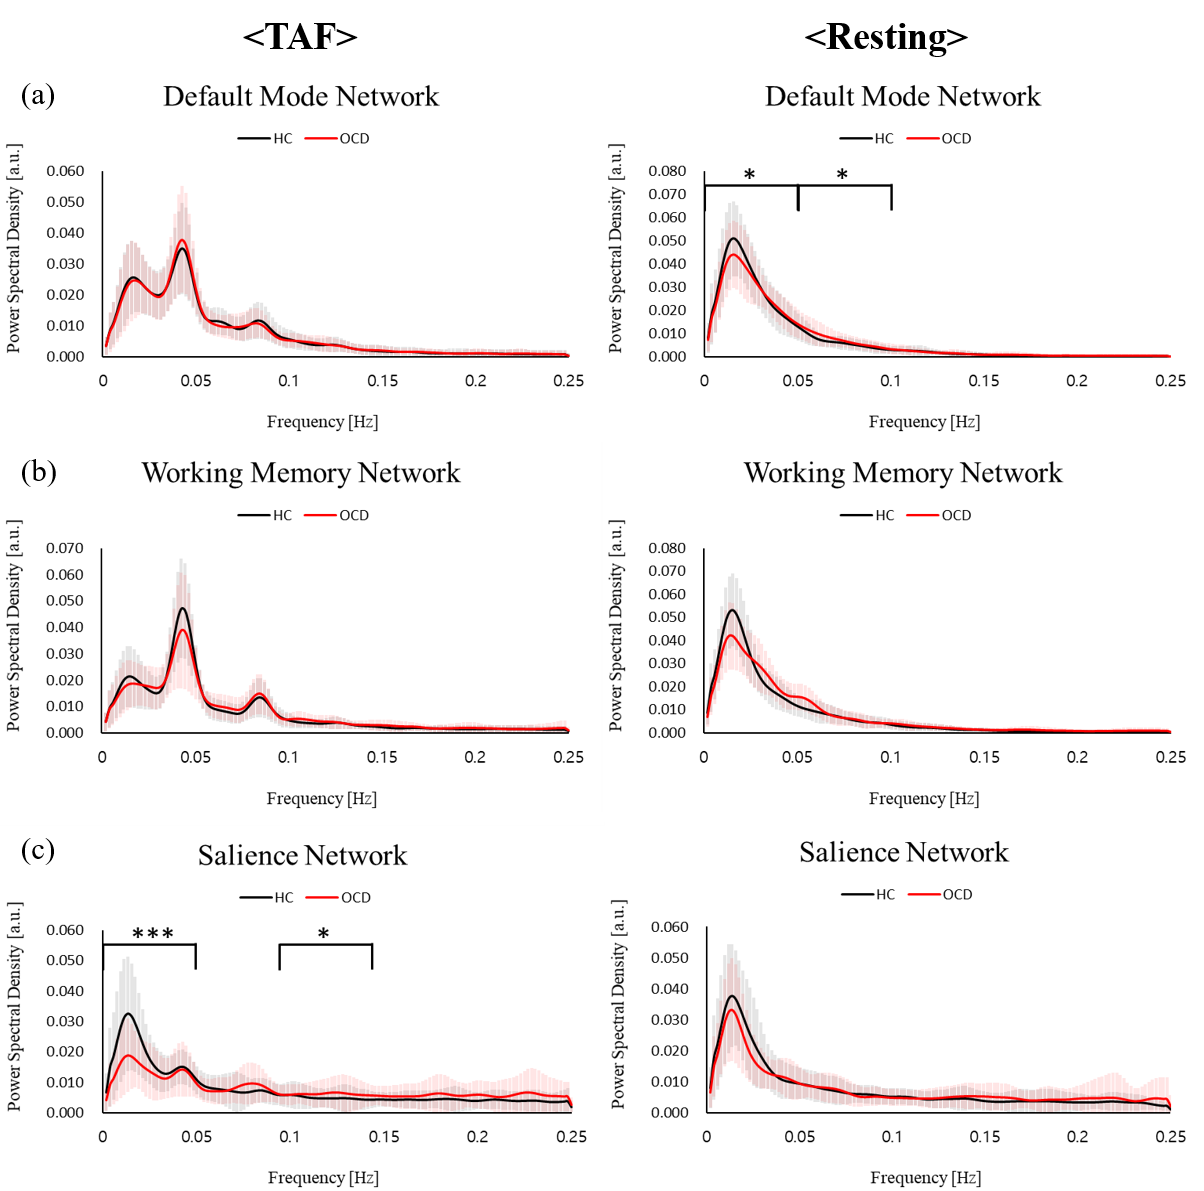
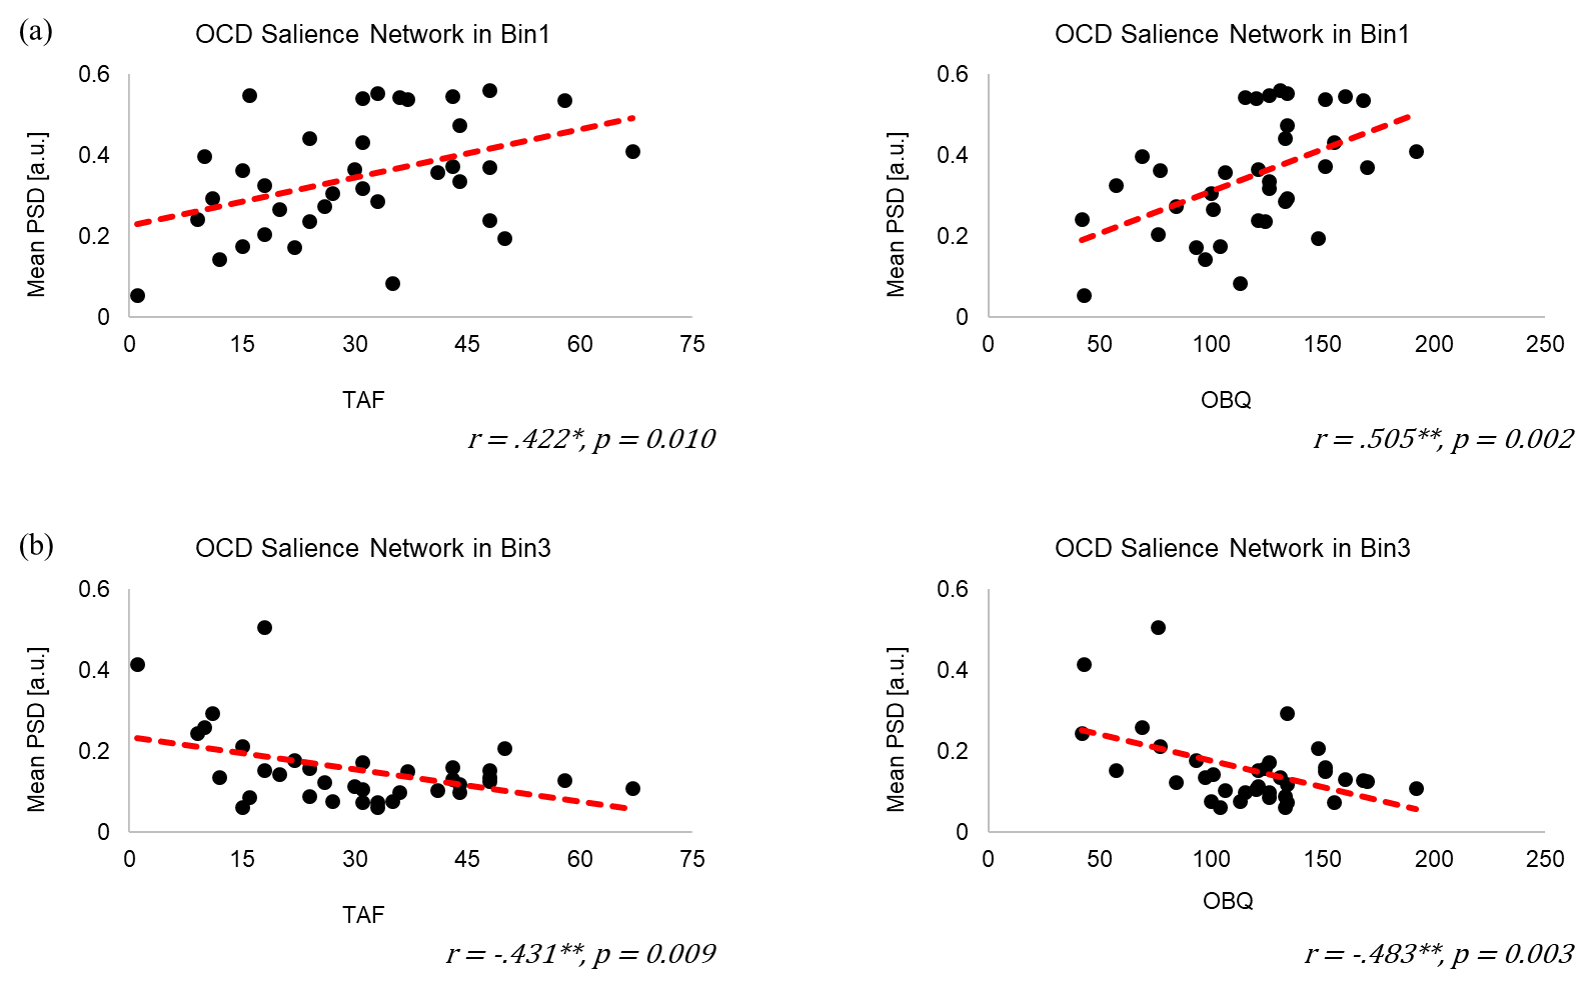
We identified DMN, CEN, and SN which are components of interests (COI) using spatial multiple regression. We selected the most fitted components using neurosynth masks based on a meta-analysis (Fig 1 and Fig 2.)5. Power spectral density (PSD) of each COI was used to compare between OCD and HC. In DMN, OCD showed lower PSD than HC in Bin1 during resting state, but had higher PSD than HC in Bin2 only (Fig 3). But there was no significant differences in DMN during TAF task and in WM both doing TAF task and resting state. During TAF task, OCD showed lower PSD of SN in low-frequency bin (Bin1) than HC, but it showed the opposite results in the high-frequency bins (Bin2). PSD of SN in OCD showed a significant correlation with TAF score and OBQ scale (Fig 4). Based on these results, we speculated that the frequency of PSD alterations in SN during TAF task might be relevant in OCD symptoms. Our results suggest that a higher feelings of thought-action fusion and obsessive-compulsion induce alteration of frequency of neural activities when TAF task in SN.Conclusion
Our results showed that OCD demonstrated the alterations of PSD which reflects neural activity in TAF task and resting state. Additionally, these PSDs are correlated to psychological measures. Therefore, alterations of PSD in SN during TAF task seem to be associated with OCD symptoms.Acknowledgements
No acknowledgement found.References
1. Fan J, Zhong M, Gan J, et al. Altered connectivity within and between the default mode, central executive, and salience networks in obsessive-compulsive disorder. J Affect Disord. 2017;223(July):106-114. doi:10.1016/j.jad.2017.07.041
2. Lee SW, Cha H, Kim E, Lee SJ. The neural correlates of thought – action fusion in healthy adults : A functional magnetic resonance imaging study. 2019;(May). doi:10.1002/da.22933
3. Rassin E, Diepstraten P, Merckelbach H, Muris P. Thought-action fusion and thought suppression in obsessive-compulsive disorder. Behav Res Ther. 2001;39(7):757-764. doi:10.1016/S0005-7967(00)00051-6
4. Rassin E, Merckelbach H, Muris P, Spaan V. Thought-action fusion as a causal factor in the development of intrusions. Behav Res Ther. 1999;37(3):231-237. doi:10.1016/S0005-7967(98)00140-5
5. Yarkoni T, Poldrack RA, Nichols TE, Van Essen DC, Wager TD. Large-scale automated synthesis of human functional neuroimaging data. Nat Methods. 2011;8(8):665-670. doi:10.1038/nmeth.1635
Figures