1670
Gray Matter Based Spatial Statistics Shows Cortical Alterations in Individuals With Autism Spectrum Disorder1Neuroscience Training Program, University of Wisconsin - Madison, Madison, WI, United States, 2Waisman Center, University of Wisconsin - Madison, Madison, WI, United States, 3Department of Psychiatry, University of Wisconsin - Madison, Madison, WI, United States, 4Department of Kinesiology, University of Wisconsin - Madison, Madison, WI, United States, 5Department of Medical Physics, University of Wisconsin - Madison, Madison, WI, United States, 6Department of Pediatrics, University of Wisconsin - Madison, Madison, WI, United States
Synopsis
Advanced diffusion MRI techniques, such as Neurite Orientation Dispersion and Density Imaging (NODDI), may be used to investigate cortical gray matter (GM) microstructure. In this work, we used the Gray Matter Based Spatial Statistics approach to investigate cortical GM microstructural differences in young people with autism spectrum disorder (ASD). Group differences and age by group interaction models were assessed. We observe regions of reduced neurite density and significant age-related changes of DTI and NODDI metrics in cortical GM of ASD individuals. Findings provide unique evidence of altered neurodevelopmental processes affecting microstructural development in ASD.
Introduction
Autism spectrum disorder (ASD) is a heterogeneous neurodevelopmental disorder characterized by impairments in social interaction and communication, and repetitive and stereotyped behaviors1. Identification and characterization of neuroanatomical and microstructural differences of ASD are imperative to advance our understanding of the neural supports underlying clinical characteristics of ASD and ultimately aid in development of targeted interventions. Previous studies have described reduced gray matter (GM) volume in brain regions supporting social cognition in individuals with ASD2-3, while diffusion MRI studies have reported widespread white matter (WM) microstructural alterations that may underly observed cognitive and behavioral deficits in ASD4-7. Recent methodological advancements have made it possible to utilize diffusion MRI methods, such as the Neurite Orientation Dispersion and Density Imaging (NODDI)8 model to examine the cortical GM microstructure. In the current study, we implemented NODDI Gray-Matter Based Spatial Statistics (NODDI-GBSS)9-10 to examine and characterize cortical microstructure and assess differences in individuals with and without ASD.Methods
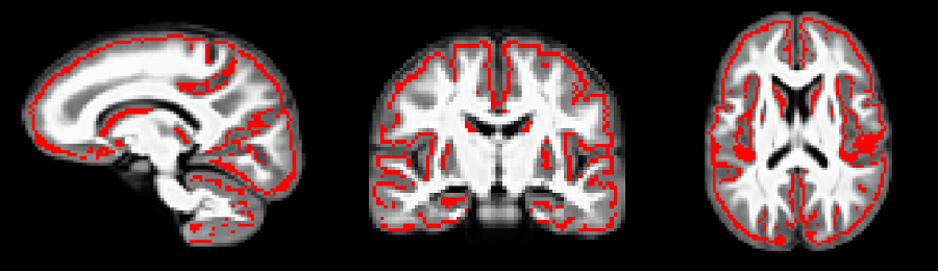
Multi-shell diffusion weighted imaging (DWI) data were obtained from 88 males with typical development (TD) and 70 males with ASD between the ages of 5 and 25.9 years old. A three-shell protocol was acquired with b-values of 350, 800, and 2000 s/mm2 at 63 non-collinear diffusion encoding directions on a 3.0 Tesla GE MR750 scanner. DWI images were corrected for eddy-current distortions and head motion11 and fit to the DTI and NODDI models, yielding parameter maps of fractional anisotropy FA, mean, radial, and axial diffusivities (MD, RD, AD), intracellular and isotropic volume fractions (νIC, νISO), and orientation dispersion index (ODI). From the DTI and NODDI maps, a “pseudo T1-weighted” image and GM fraction map were created for each subject and a study-specific template was built from the pseudo T1w image using Advanced Normalization Tools (ANTs)12. ANTs transformations were applied to the GM fraction and DTI and NODDI maps and an overall average GM fraction calculated. Using FSL tract-based spatial statistic tools13, the average GM fraction was skeletonized (Fig. 1) and each subject’s DTI and NODDI metrics were projected onto the GM skeleton. Statistical analyses used general linear models to investigate ASD vs. TD group differences, while age-by-group interactions were also assessed to investigate age-related group differences. Non-parametric permutation testing was carried out using Permutation Analysis of Linear Models (PALM)14-15 and threshold free cluster enhancement16 were used to identify significant regions at p < 0.05, FWER-corrected within modality and contrast. Statistical maps were coregistered to the Harvard-Oxford atlas to help identify significant brain regions.Results
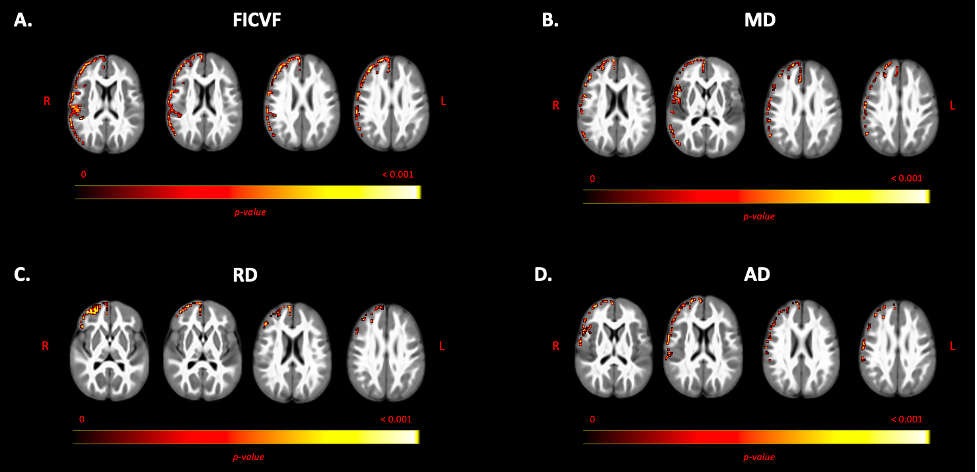
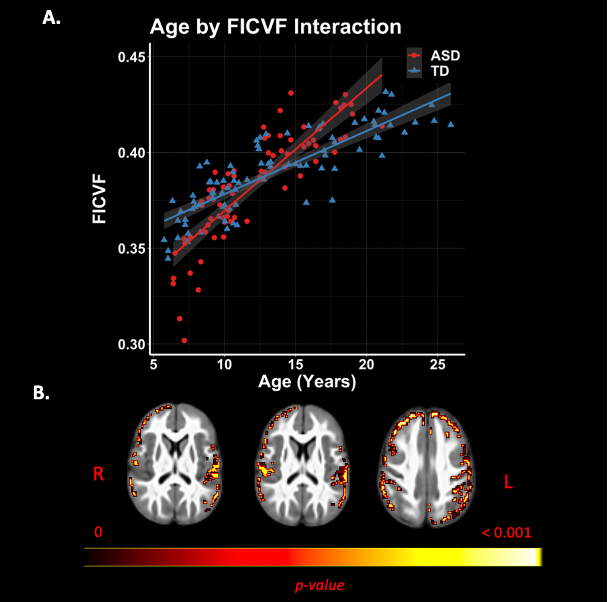
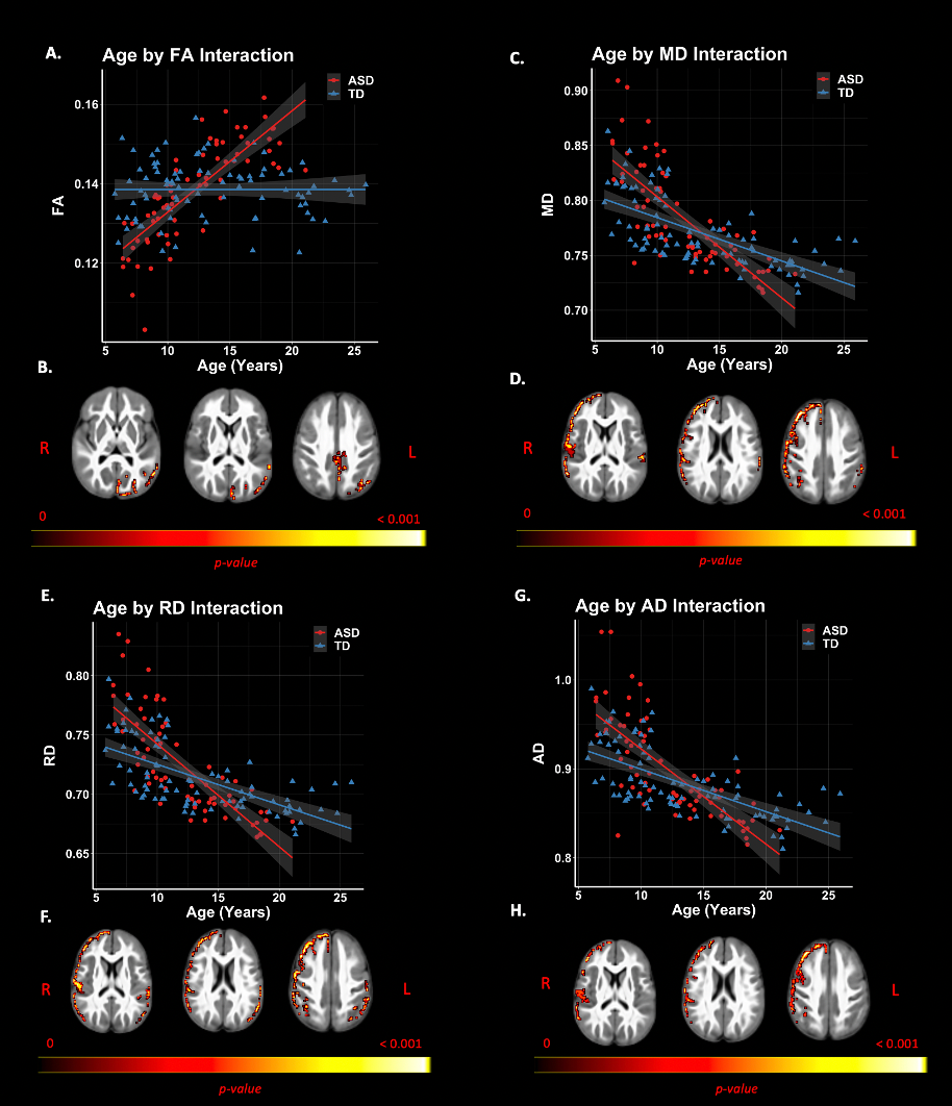
Group comparisons revealed significant right lateralized differences between groups. The ASD group demonstrated lower FICVF and higher MD, RD, and AD compared to the TD group in right frontal and temporal brain regions. Neuroanatomical representations of significant group differences can be visualized in Figure 2. Moreover, a significant age-by-group interaction was observed for measures of FICVF, FA, MD, RD, and AD. Specifically, for FICVF, a significant age-by-group interaction was noted in bilateral: frontal poles, middle frontal gyrus, precentral gyrus, post central gyrus, and anterior division of the supramarginal gyrus, and in the left superior lateral occipital cortex (Fig. 3). Significant age-by-group interactions from DTI metrics are shown in Figure 4. A significant interaction of left lateralized FA was observed in regions of middle temporal gyrus, lateral occipital cortex, intracalcarine cortex, occipital pole, cingulate gyrus, and cuneal cortex. Significant interactions of MD were observed in the bilateral middle temporal gyrus, superior frontal gyrus, anterior division of the supramarginal gyrus, post central gyrus; right hemisphere frontal pole and middle frontal gyrus, and left hemisphere posterior division of the inferior temporal gyrus. Significant age-by-group interactions with RD were also noted in bilateral temporal pole and middle temporal gyrus, right hemisphere post central gyrus, and left hemisphere inferior temporal gyrus. Findings of a significant interaction on AD were found to be significant in areas including right hemisphere frontal pole, supramarginal gyrus, central opercular cortex, and angular gyrus. No significant group differences or age-by-group interactions were observed for ODI.Discussion
Our findings highlight significant age-related group differences of cortical GM microstructure in ASD. Although we observed widespread alterations across the cortical microstructure, group difference findings were observed only in the right hemisphere, which is largely responsible for many cognitive functions such as attention17, visual processing of faces18 and objects19, emotions20, and discerning verbal ambiguity21. Deficits of such abilities are often observed in ASD. Furthermore, significant age-by-group interactions reveal age-related GM differences in ASD in various widespread cortical brain regions supporting cognitive processes. Findings provide evidence of altered neurodevelopmental processes affecting GM microstructural development within the ASD group.Conclusion
The cortical GM microstructure plays an important role in overall brain function and connectivity. Using advanced diffusion MRI acquisition and NODDI-GBSS, our findings provide new insights into group mean and age-related differences of the GM microstructure in ASD. Increased evidence of where and when these cortical GM differences arise can contribute to our current understanding of brain-behavior relationships in ASD and may ultimately aid in the development of individualized interventions and therapeutics.Acknowledgements
We sincerely thank the adolescents and their families who participated in this research. This work was supported by grants R01 MH097464 (Dr. Lainhart), R01 MH080826 (Dr. Lainhart), and R00 MH11056 (Dr. Dean) from the National Institute of Mental Health, National Institutes of Health. Infrastructure support was also provided, in part, by grant U54 HD090256 from the Eunice Kennedy Shriver NICHD, National Institutes of Health (Waisman Center).
References
1. Diagnostic and Statistical Manual of Mental Disorders, 5th Edition. American Psychiatric Association. Washington, DC: American Psychiatric Publishing, Inc; 947; (2013)
2. Greimel, Ellen, Barbara Nehrkorn, Martin Schulte-Rüther, Gereon R. Fink, Thomas Nickl-Jockschat, Beate Herpertz-Dahlmann, Kerstin Konrad, and Simon B. Eickhoff. 2013. “Changes in Grey Matter Development in Autism Spectrum Disorder.” Brain Structure and Function 218 (4): 929–42. https://doi.org/10.1007/s00429-012-0439-9.
3. Sato, Wataru, Takanori Kochiyama, Shota Uono, Sayaka Yoshimura, Yasutaka Kubota, Reiko Sawada, Morimitsu Sakihama, and Motomi Toichi. 2017. “Reduced Gray Matter Volume in the Social Brain Network in Adults with Autism Spectrum Disorder.” Frontiers in Human Neuroscience 11 (August): 1–12. https://doi.org/10.3389/fnhum.2017.00395.
4. Dean, Douglas C., Brittany G. Travers, Nagesh Adluru, Do P.M. Tromp, Daniel J. Destiche, Danica Samsin, Molly B. Prigge, et al. 2016. “Investigating the Microstructural Correlation of White Matter in Autism Spectrum Disorder.” Brain Connectivity 6 (5): 415–33. https://doi.org/10.1089/brain.2015.0385.
5. Vogan, V. M., B. R. Morgan, R. C. Leung, E. Anagnostou, K. Doyle-Thomas, and M. J. Taylor. 2016. “Widespread White Matter Differences in Children and Adolescents with Autism Spectrum Disorder.” Journal of Autism and Developmental Disorders 46 (6): 2138–47. https://doi.org/10.1007/s10803-016-2744-2.
6. Fitzgerald, Jacqueline, Louise Gallagher, and Jane McGrath. 2016. “Widespread Disrupted White Matter Microstructure in Autism Spectrum Disorders.” Journal of Autism and Developmental Disorders 49 (7): 2664–74. https://doi.org/10.1007/s10803-016-2803-8.
7. Thompson, Abigail, Asal Shahidiani, Anne Fritz, Jonathan O’Muircheartaigh, Lindsay Walker, Vera D’Almeida, Clodagh Murphy, et al. 2020. “Age-Related Differences in White Matter Diffusion Measures in Autism Spectrum Condition.” Molecular Autism 11 (1): 1–10. https://doi.org/10.1186/s13229-020-00325-6.
8. Zhang, H., Schneider, T., Wheeler-Kingshott, C. A., & Alexander, D. C. (2012). NODDI: Practical in vivo neurite orientation dispersion and density imaging of the human brain. NeuroImage, 61(4), 1000–1016. https://doi.org/10.1016/j.neuroimage.2012.03.072
9. Nazeri, Arash, Mallar Chakravart, David J. Rotenberg, Tarek K. Rajji, Xyogesh Rathi, Oleg V. Michailovich, and Aristotle N. Voineskos. 2015. “Functional Consequences of Neurite Orientation Dispersion and Density in Humans across the Adult Lifespan.” Journal of Neuroscience 35 (4): 1753–62. https://doi.org/10.1523/JNEUROSCI.3979-14.2015.
10. Nazeri, Arash, Benoit H. Mulsant, Tarek K. Rajji, Melissa L. Levesque, Jon Pipitone, Laura Stefanik, Saba Shahab, et al. 2017. “Gray Matter Neuritic Microstructure Deficits in Schizophrenia and Bipolar Disorder.” Biological Psychiatry 82 (10): 726–36. https://doi.org/10.1016/j.biopsych.2016.12.005.
11. Andersson, J. L. R., & Sotiropoulos, S. N. (2016). An integrated approach to correction for off-resonance effects and subject movement in diffusion MR imaging. NeuroImage, 125, 1063–1078. https://doi.org/10.1016/j.neuroimage.2015.10.019
12. Avants, B. B., Epstein, C. L., Grossman, M., & Gee, J. C. (2008). Symmetric diffeomorphic image registration with cross-correlation: Evaluating automated labeling of elderly and neurodegenerative brain. Medical Image Analysis, 12(1), 26–41. https://doi.org/10.1016/j.media.2007.06.004
13. Smith, S. M., Jenkinson, M., Johansen-Berg, H., Rueckert, D., Nichols, T. E., Mackay, C. E., … Behrens, T. E. J. (2006). Tract-based spatial statistics: Voxelwise analysis of multi-subject diffusion data. NeuroImage, 31(4), 1487–1505. https://doi.org/10.1016/j.neuroimage.2006.02.024
14. Winkler, A. M., Ridgway, G. R., Webster, M. A., Smith, S. M., & Nichols, T. E. (2014). Permutation inference for the general linear model. NeuroImage, 92, 381–397. https://doi.org/10.1016/j.neuroimage.2014.01.060
15. Winkler, A. M., Webster, M. A., Brooks, J. C., Tracey, I., Smith, S. M., & Nichols, T. E. (2016). Non-parametric combination and related permutation tests for neuroimaging. Human Brain Mapping, 37(4), 1486–1511. https://doi.org/10.1002/hbm.23115
16. Smith, S. M., & Nichols, T. E. (2009). Threshold-free cluster enhancement: Addressing problems of smoothing, threshold dependence and localisation in cluster inference. NeuroImage, 44(1), 83–98. https://doi.org/10.1016/j.neuroimage.2008.03.061
17. Posner, M. I., & Petersen, S. E. (1990). The attention system of the human brain. Annual Review of Neuroscience, 13, 25–42. https://doi.org/10.1146/annurev.ne.13.030190.000325
18. Meadows, J. C. (1974). The anatomical basis of prosopagnosia. Journal of Neurology Neurosurgery and Psychiatry, 37(5), 489–501. https://doi.org/10.1136/jnnp.37.5.489
19. Koivisto, M., & Revonsuo, A. (2003). Object recognition in the cerebral hemispheres as revealed by visual field experiments. Laterality, 8(2), 135–153. https://doi.org/10.1080/713754482
20. Borod, J. C., Obler, L. K., Erhan, H. M., Grunwald, I. S., Cicero, B. A., Welkowitz, J., … Whalen, J. R. (1998). Right hemisphere emotional perception: Evidence across multiple channels. Neuropsychology, 12(3), 446–458. https://doi.org/10.1037/0894-4105.12.3.446
21. Just, M. A., Carpenter, P. A., Keller, T. A., Eddy, W. F., & Thulborn, K. R. (1996). Brain activation modulated by sentence comprehension. Science, 274(5284), 114–116. https://doi.org/10.1126/science.274.5284.114
Figures