1661
Changes in total choline level in left anterior cingulate during 26 weeks of Li treatment in patients with bipolar disorder1Cleveland Clinic Foundation, CLEVELAND, OH, United States
Synopsis
Changes in total choline level in left anterior cingulate cortex (ACC) following lithium monotherapy of bipolar disorder in depressed state were studied at 7T. Patients were scanned with a semi LASER sequence at baseline and 2, 8 and 26 weeks from start of therapy. Healthy controls were also scanned at those 4 time points. A decrease in choline level at left dorsal/rostral ACC was observed in patients, and the reduction took place between 8 and 26 weeks after onset of therapy.
INTRODUCTION
Bipolar disorder (BD) is a condition in which patients have periods of depression followed by periods of uncharacteristically elevated mood.1,2 Choline (Cho) metabolism disorder has been reported in BD from magnetic resonance spectroscopy (MRS) studies.3,4 Anterior cingulate cortex (ACC) is an important region in the pathophysiology of BD;5-7 increased Cho level in ACC has been reported in BD,8,9 while left anterior cingulate cortex (ACC) Cho level has been reported to be correlated with depression in BD.9 Lithium (Li) medication is one of the main treatment regimens to prevent long-term relapse of BD.10,11 The effect of Li on brain Cho is not well established with reports varying from no effect12,13 to an increase in Cho level;14-16 however patient population/mood state, brain region studied, medications etc. were variables in different studies. We have studied evolution of left dorsal/rostral ACC choline level in depressed phase of patients with bipolar disorder during 26 weeks of Li treatment.METHODS
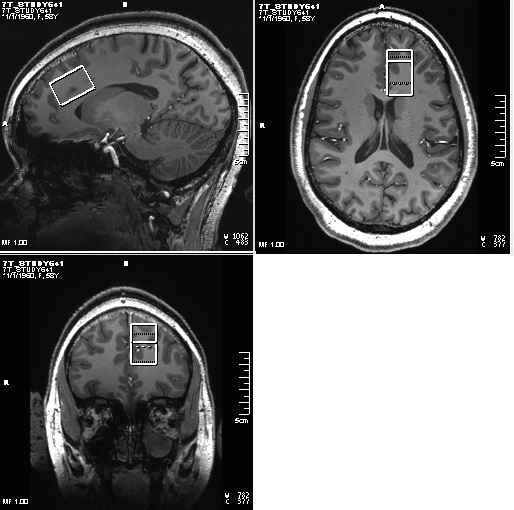
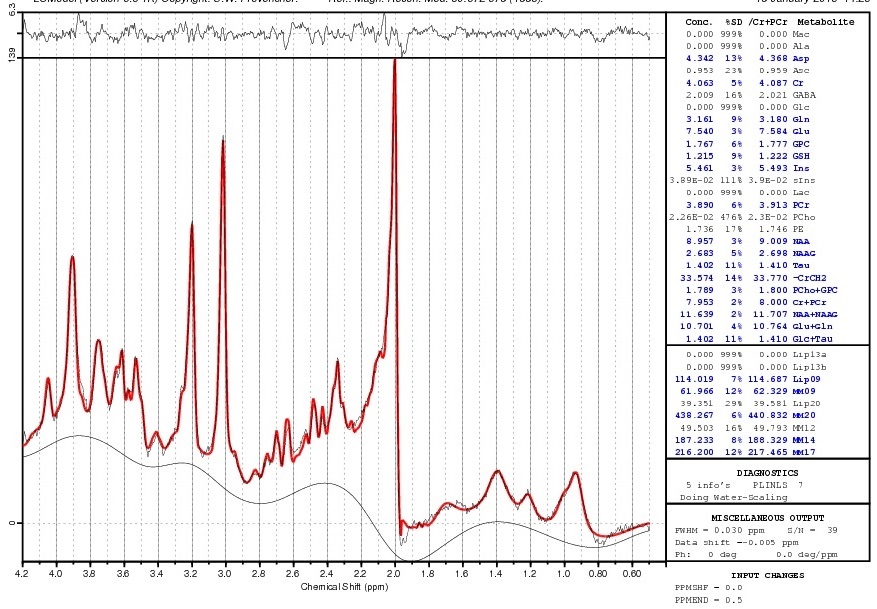
Fourteen patients with BD (Age 30±9y, 3 M, satisfying criteria for Diagnostic and Statistical Manual 5th edition (DSM-V) for BD with current depressive episode, 17-item Hamilton Depression Rating Scale (HAM-D) score >15 and <25, Young Mania Rating Scale (YMRS) < 8, no psychotropic in the last 2 weeks (if previously on fluoxetine then medication free for 5 weeks), no lithium treatment for past 6 months) and 7 healthy controls (30±10y, 3M) were scanned at Siemens 7T Magnetom scanner with a 32-channel receive, single channel transmit head coil under an Institutional Review Board approved protocol. Subjects were scanned at baseline (pre-therapy), and after 2, 8 and 26 weeks of Li monotherapy (started at 300 mg po bid and increased aiming for a blood level of 0.6 meq/l or as tolerated). Each MRI session consisted of (i) localizer, (ii) T1-weighted Magnetization Prepared Rapid Acquisition with Gradient Echo (MPRAGE) anatomical scan (TR/TE=2250/2.97ms, matrix=256×256, FOV=204×204mm2) and (iii) semi-LASER (sLASER)17 scan with VAPOR (Variable Power and Optimized Relaxation Delays) for water suppression18 (TR/TE1/TE2/TE3=8000/9/11/9ms, 32 transients) scan of a 20×30×20mm3 voxel at left dorsal/rostral ACC (Fig. 1). In addition, water reference acquisition (with RF off) for eddy current correction and unsuppressed water signal acquisition for quantification were performed. sLASER data were analyzed using MRspa software package (https://www.cmrr.umn.edu/downloads/mrspa/). The analysis consisted of Eddy current, frequency and phase correction, signal averaging and subsequent quantification using LCModel fitting with metabolite concentrations corrected for voxel tissue composition. Voxel segmentation was performed using BET and FAST algorithm19 of FSL software library.20 Total choline (phosphocholine (PCho) + glycerophosphocholine (GPC)) level evolution over 26 weeks was determined using a simple random effect mixed models in GLIMMIX21 procedure in SAS Studio 3.7 (SAS Inc, NC) accounting for missing data due to subject dropouts and poor spectral fitting (>15% CRLB). P-values between of PCho+GPC level changes between different points including visit*group effect were also generated with GLIMMIX procedure. %Coefficient of variation (%CV) of PCho+GPC levels over 4 weeks was also determined for the healthy controls considering data from 6 subjects with all 4 timepoints.RESULTS and DISCUSSION
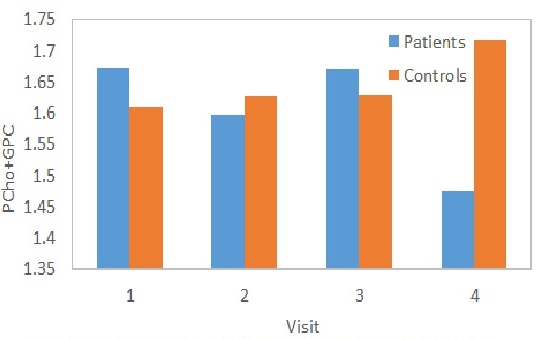
Two patients dropped out after 2 visits, and 3 patients and 1 control dropped out after 3 visits. A sample LCModel fitted spectrum is shown in Fig. 2. %CV of PCho+GPC for the healthy controls was determined to be 3.72%. No difference in left dorsal/rostral ACC PCho+GPC levels at baseline between patients and controls were observed (1.67±0.10 and 1.63±0.11 mM respectively). Previous studies reported elevated Cho level in BD in right ACC9 and combined left and right dorsal ACC,4 with no difference between BD and healthy controls in combined left and right rostral ACC.4 No correlation between PCho+GPC levels and HAM-D scores were observed at baseline (i.e. under no anti-depressant effect), unlike the correlation observed with patients under Li or valproate therapy.9 Evolution of PCho+GPC levels over the 4 visits (at baseline, 2-, 8- and 26-week) for patients and controls are shown in Fig. 3. PCho+GPC level in patients remained unchanged during 1st 8 weeks of Li therapy and then dropped significantly (P<0.05) between 8 and 26 weeks. Previous studies reported no difference in cerebral Cho level between euthymic BD under Li therapy and healthy controls12,13 or higher Cho level in manic BD under Li therapy.22 The current study differs from the previous studies as it longitudinally investigated the evolution of choline during Li therapy of depressed BD.CONCLUSION
Li monotherapy decreases Cho level at left dorsal/rostral ACC in patients with bipolar disorder in depressed phase and the reduction takes place between 8 and 26 weeks after onset of therapy.Acknowledgements
This study was conducted with grant finding support from National Institutes of Mental health (NIMH, R01MH113256(AA)). We thank Sineyob Ahn, Siemens Healthineers, for support with sLASER sequence used in this study.References
1. Anderson IM, Haddad PM, Scott J. Bipolar disorder. BMJ. 2012;345:e8508.
2. Association AP. Diagnostic and Statistical Manual of Mental Disorders 5th ed: Arlington: American Psychiatric Publishing; 2013.
3. Galinska-Skok B, Malus A, Konarzewska B, et al. Choline Compounds of the Frontal Lobe and Temporal Glutamatergic System in Bipolar and Schizophrenia Proton Magnetic Resonance Spectroscopy Study. Dis Markers. 2018;2018:3654894.
4. Cao B, Stanley JA, Passos IC, et al. Elevated Choline-Containing Compound Levels in Rapid Cycling Bipolar Disorder. Neuropsychopharmacology. 2017;42(11):2252-2258.
5. Sanches M, Amorim E, Mwangi B, Zunta-Soares GB, Soares JC. Smaller left anterior cingulate cortex in non-bipolar relatives of patients with bipolar disorder. Braz J Psychiatry. 2019;41(3):254-256.
6. Jelen LA, King S, Horne CM, Lythgoe DJ, Young AH, Stone JM. Functional magnetic resonance spectroscopy in patients with schizophrenia and bipolar affective disorder: Glutamate dynamics in the anterior cingulate cortex during a working memory task. Eur Neuropsychopharmacol. 2019;29(2):222-234.
7. Bouras C, Kovari E, Hof PR, Riederer BM, Giannakopoulos P. Anterior cingulate cortex pathology in schizophrenia and bipolar disorder. Acta Neuropathol. 2001;102(4):373-379.
8. Cao B, Stanley JA, Selvaraj S, et al. Evidence of altered membrane phospholipid metabolism in the anterior cingulate cortex and striatum of patients with bipolar disorder I: A multi-voxel (1)H MRS study. J Psychiatr Res. 2016;81:48-55.
9. Moore CM, Breeze JL, Gruber SA, et al. Choline, myo-inositol and mood in bipolar disorder: a proton magnetic resonance spectroscopic imaging study of the anterior cingulate cortex. Bipolar Disord. 2000;2(3 Pt 2):207-216.
10. Grande I, Berk M, Birmaher B, Vieta E. Bipolar disorder. Lancet. 2016;387(10027):1561-1572.
11. Machado-Vieira R, Manji HK, Zarate CA, Jr. The role of lithium in the treatment of bipolar disorder: convergent evidence for neurotrophic effects as a unifying hypothesis. Bipolar Disord. 2009;11 Suppl 2:92-109.
12. Wu RH, O'Donnell T, Ulrich M, Asghar SJ, Hanstock CC, Silverstone PH. Brain choline concentrations may not be altered in euthymic bipolar disorder patients chronically treated with either lithium or sodium valproate. Ann Gen Hosp Psychiatry. 2004;3(1):13.
13. Stoll AL, Renshaw PF, Sachs GS, et al. The human brain resonance of choline-containing compounds is similar in patients receiving lithium treatment and controls: an in vivo proton magnetic resonance spectroscopy study. Biol Psychiatry. 1992;32(10):944-949.
14. Strakowski SM, DelBello MP, Adler C, Cecil DM, Sax KW. Neuroimaging in bipolar disorder. Bipolar Disord. 2000;2(3 Pt 1):148-164.
15. Stoll AL, Renshaw PF, Yurgelun-Todd DA, Cohen BM. Neuroimaging in bipolar disorder: what have we learned? Biol Psychiatry. 2000;48(6):505-517.
16. Soeiro-de-Souza MG, Otaduy MCG, Machado-Vieira R, et al. Lithium-associated anterior cingulate neurometabolic profile in euthymic Bipolar I disorder: A (1)H-MRS study. J Affect Disord. 2018;241:192-199.
17. Scheenen TW, Heerschap A, Klomp DW. Towards 1H-MRSI of the human brain at 7T with slice-selective adiabatic refocusing pulses. MAGMA. 2008;21(1-2):95-101.
18. Tkac I, Starcuk Z, Choi IY, Gruetter R. In vivo 1H NMR spectroscopy of rat brain at 1 ms echo time. Magn Reson Med. 1999;41(4):649-656.
19. Zhang Y, Brady M, Smith S. Segmentation of brain MR images through a hidden Markov random field model and the expectation-maximization algorithm. IEEE Trans Med Imaging. 2001;20(1):45-57.
20. Smith SM, Jenkinson M, Woolrich MW, et al. Advances in functional and structural MR image analysis and implementation as FSL. Neuroimage. 2004;23 Suppl 1:S208-219.
21. Brown H, Prescott R. Applied Mixed Models in Medicine. Norwood, MA: Artech Hhouse; 1999.
22. Sharma R, Venkatasubramanian PN, Barany M, Davis JM. Proton magnetic resonance spectroscopy of the brain in schizophrenic and affective patients. Schizophr Res. 1992;8(1):43-49.
Figures