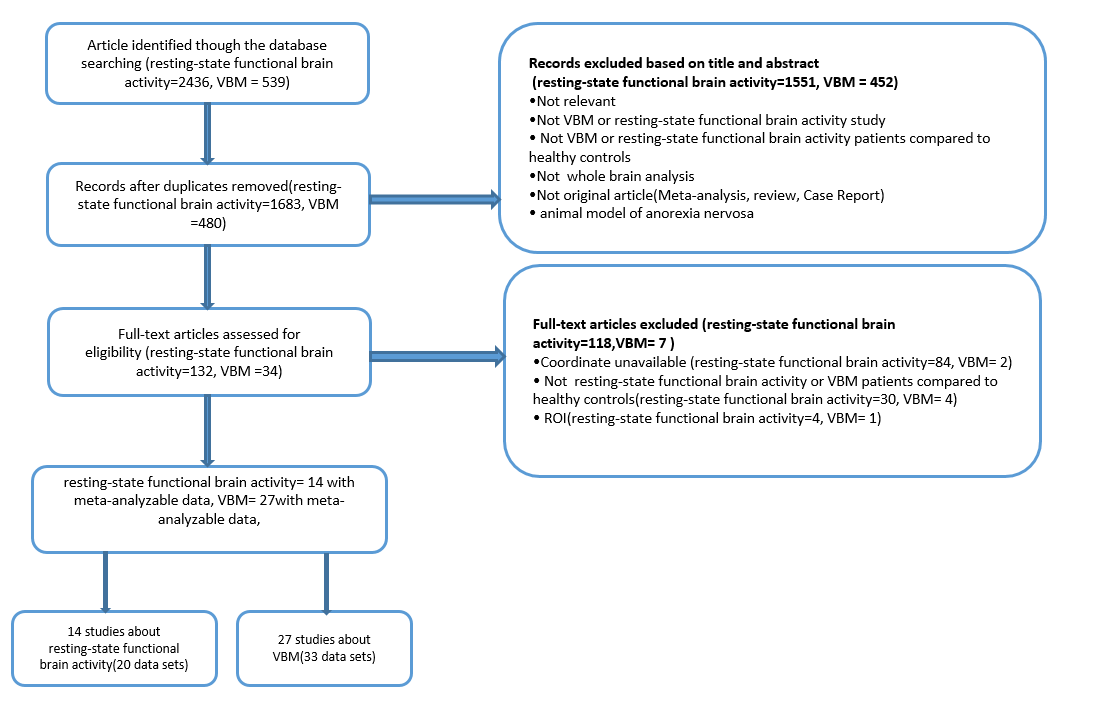
1660
Functional and structural brain alterations in anorexia nervosa: a multimodal meta-analysis of neuroimaging studies1Medical Imaging Center, First Affiliated Hospital of Jinan University, Guangzhou, China, 2Department of Radiology, Six Affiliated Hospital of Sun Yat-sen University, Guangzhou, China, 3Department of Applied Psychology, Guangdong University of Foreign Studies, Guangzhou, China
Synopsis
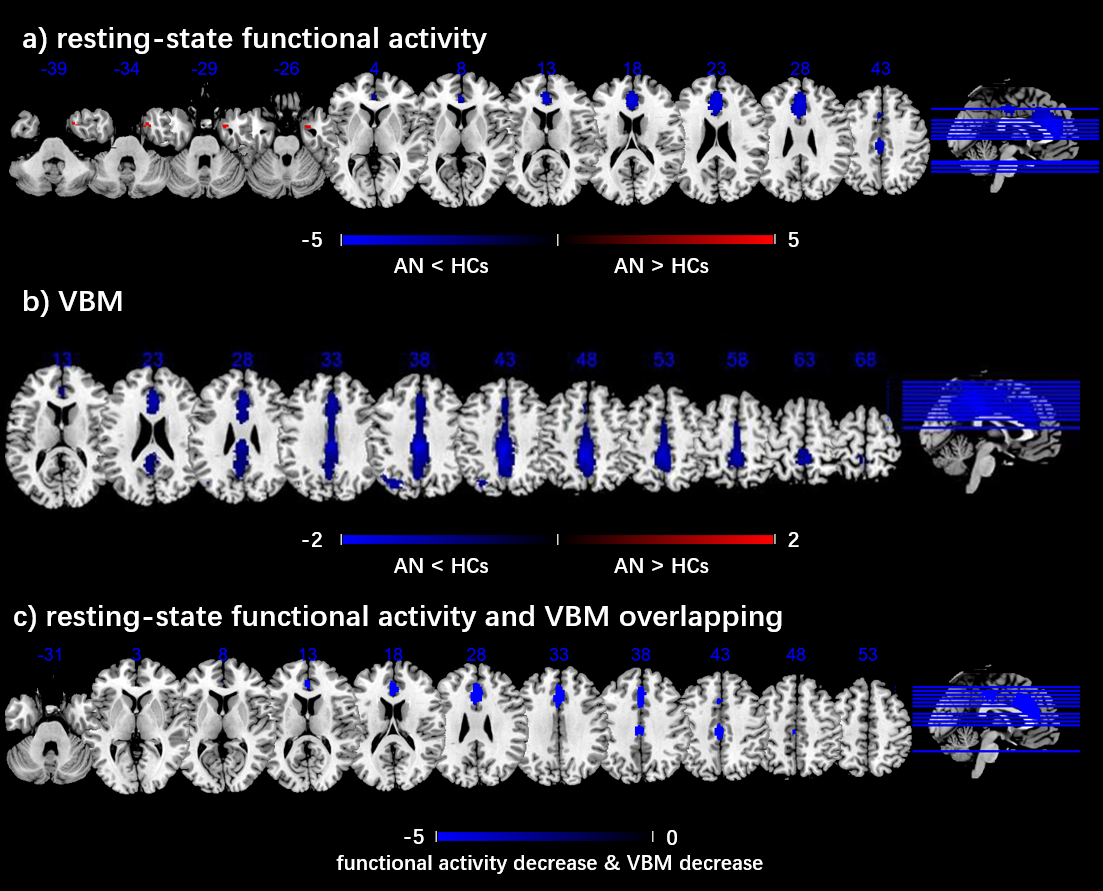
Anorexia nervosa (AN) is a complex psychiatric disorder with poorly understood etiology. A whole-brain meta-analysis on resting-state functional imaging and VBM studies that measured differences in the intrinsic functional activity and gray matter volume (GMV) between AN patients and healthy controls. Overall, patients with AN displayed decreased resting-state functional activity in the bilateral ACC and MCC and increased in the right parahippocampal gyrus. In VBM studies, with AN patients displayed decreased GMV in the bilateral MCC , and left inferior parietal lobe. This multimodal meta-analysis identified functional activity and GMV reductions in the anterior and median cingulate in patients with AN.
Introduction
Anorexia nervosa (AN) is a severe psychiatric disorder that is mainly found in adolescent girls and young women (female-male ratio of 10:1) [1, 2]. The nutritional compromise associated with AN affects most major organ systems and may cause a variety of disturbances [3-6]. Over the past decade, numerous studies of resting-state functional imaging [7-10] and voxel-based morphometry (VBM) [11-15] have provided strong evidence of abnormal brain intrinsic functional activity and structure in AN [16]. However, the conclusions have been inconsistent [10, 17-20].Thus, we attempted to conduct a comprehensive meta-analysis to identify true-positive findings and common abnormalities in the literature.Methods and materials
A comprehensive and systematic literature search of the following databases: Web of Science, Embase, PubMed, Sinomed, China National Knowledge Infrastructure, and WanFang databases for resting-state functional imaging and VBM studies published between January 1990 and July 2020, was conducted. We used a 10-point checklist to assess individual study quality for meta-analyses. A whole-brain meta-analysis of resting-state functional activity differences (293 AN; 246 controls) and the structural substrates of altered cerebral volume (645 AN; 633 controls) between patients and healthy controls (HCs) was conducted using the SDM software package (version 6.12 for Windows) in a standard process (www.sdmproject.com) [21,22]. To test the repeatability of the results, and inspect the heterogeneity and publication bias, we performed a jackknife sensitivity analysis, funnel plots and Egger’s tests (P < 0.05) [23]. Meta-regression analyses were carried out to explore the associations between the analytic results and clinical variables as well. In addition, to localize brain regions with both resting-state functional activity and GMV abnormalities in AN, between-group contrasts of multimodal brain imaging were summarized in a meta-analytic map [24]Results
Overall, patients with AN displayed decreased resting-state functional activity in the bilateral anterior cingulate cortex and bilateral median cingulate cortex, and increased resting-state functional activity in the right parahippocampal gyrus. In VBM studies, patients with AN displayed decreased GMV in the bilateral median cingulate cortex (extending to the bilateral anterior and posterior cingulate cortex), and left inferior parietal lobe. The whole-brain jackknife sensitivity analysis revealed that in patients with AN, the resting-state functional activity decrease in the bilateral anterior cingulate cortex and bilateral median cingulate cortex, and increase in the right parahippocampal gyrus were highly repetitive, because these findings were preserved in at least 85% of the combinations; the most robust data were acquired for decreases in GMV in the bilateral median cingulate cortex (extending to the bilateral anterior and posterior cingulate cortex) and left inferior parietal lobe, replicable in all 30 datasets. The funnel plot does not show asymmetries, and the Egger's tests show no publication bias in these areas as well. BMI and illness duration were not associated with AN-related resting-state functional activity or GMV changes. We were unable to assess the relationship to AN symptom severity because this was reported using a variety of incompatible measures (n≤10). In addition, a conjunction analysis further found that the anterior cingulate cortex and median cingulate cortex were altered in AN in both resting-state functional and VBM studies. Specifically, AN patients showed concurrent hypoactivity and decreased GMV in these regions.Conclusion
This multimodal meta-analysis identified functional activity and gray matter reductions in the anterior and median cingulate in patients with AN, which contributes to being further understanding the physiopathology of AN.Acknowledgements
The study was supported by grants from the National Natural Science Foundation of China (81671670 and 81971597); Project in Basic Research and Applied Basic Research in General Colleges and Universities of Guangdong, China (018KZDXM009); Planned Science and Technology Project of Guangzhou, China (201905010003). The funding organizations played no further role in study design, data collection, analysis and interpretation and paper writing.References
1. Diagnostic and Statistical Manual of Mental Disorders (DSM-5). The American Psychiatric Association 2013; 51: 338.
2. Lucas AR, Beard CM, O'Fallon WM, Kurland LT. 50-year trends in the incidence of anorexia nervosa in Rochester, Minn.: a population-based study. Am J Psychiatry 1991; 148(7): 917-922.
3. Walsh BT. The enigmatic persistence of anorexia nervosa. Am J Psychiatry 2013; 170(5): 477-484.
4. Boghi A, Sterpone S, Sales S, D'Agata F, Bradac GB, Zullo G et al. In vivo evidence of global and focal brain alterations in anorexia nervosa. Psychiatry Res 2011; 192(3): 154-159.
5. Fairburn CG, Harrison PJ. Eating disorders. SEMINAR 2003; 361(9355): 407-416.
6. Zipfel S, Mack I, Baur LA, Hebebrand J, Touyz S, Herzog W et al. Impact of exercise on energy metabolism in anorexia nervosa. J Eat Disord 2013; 1(1): 37.
7. Sheng M, Lu H, Liu P, Thomas BP, McAdams CJ. Cerebral perfusion differences in women currently with and recovered from anorexia nervosa. Psychiatry Res 2015; 232(2): 175-183.
8. Gordon CM, Dougherty DD, Fischman AJ, Emans SJ, Grace E, Lamm R et al. Neural substrates of anorexia nervosa: A behavioral challenge study with positron emission tomography. J Pediatr 2001; 139(1): 51-57.
9. Jinjue, Yinghua M, Yiyuan T, Hongbo F, Qingbao Y, Ye Z et al. Exploring the regional cerebral blood flow in a patient with anorexia nervosa using 99mTc-ECD single photon emission computed tomography. Journal of Biophysics 2007; 23.
10. Yue L. A Study on Brain Function of Inhibitory Control in Patients with Anorexia Nervosa. Shanghai Jiaotong University School of Medicine2013.
11. Leppanen J, Sedgewick F, Cardi V, Treasure J, Tchanturia K. Cortical morphometry in anorexia nervosa: An out-of-sample replication study. Eur Eat Disord Rev 2019; 27(5): 507-520.
12. Phillipou A, Rossell SL, Gurvich C, Castle DJ, Abel LA, Nibbs RG et al. Differences in regional grey matter volumes in currently ill patients with anorexia nervosa. Eur J Neurosci 2018; 47(2): 177-183.
13. Nickel K, Joos A, Tebartz van Elst L, Matthis J, Holovics L, Endres D et al. Recovery of cortical volume and thickness after remission from acute anorexia nervosa. Int J Eat Disord 2017; 51(9): 1056-1069.
14. Amianto F, Caroppo P, D'Agata F, Spalatro A, Lavagnino L, Caglio M et al. Brain volumetric abnormalities in patients with anorexia and bulimia nervosa: a voxel-based morphometry study. Psychiatry Res 2013; 213(3): 210-216.
15. Joos A, Hartmann A, Glauche V, Perlov E, Unterbrink T, Saum B et al. Grey matter deficit in long-term recovered anorexia nervosa patients. Eur Eat Disord Rev 2011; 19(1): 59-63.
16. Barona M, Brown M, Clark C, Frangou S, White T, Micali N. White matter alterations in anorexia nervosa: Evidence from a voxel-based meta-analysis. Neurosci Biobehav Rev 2019; 100: 285-295.
17. Zhang HW, Li DY, Zhao J, Guan YH, Sun BM, Zuo CT. Metabolic imaging of deep brain stimulation in anorexia nervosa: A 18F-FDG PET/CT study. Clin Nucl Med 2013; 38(12): 943-948.
18. Kojima S, Nagai N, Nakabeppu Y, Muranaga T, Deguchi D, Nakajo M et al. Comparison of regional cerebral blood flow in patients with anorexia nervosa before and after weight gain. Psychiatry Research - Neuroimaging 2005; 140(3): 251-258.
19. Seidel M, Borchardt V, Geisler D, King JA, Boehm I, Pauligk S et al. Abnormal Spontaneous Regional Brain Activity in Young Patients With Anorexia Nervosa. J Am Acad Child Adolesc Psychiatry 2019; 58(11): 1104-1114.
20. Takano A, Shiga T, Kitagawa N, Koyama T, Katoh C, Tsukamoto E et al. Abnormal neuronal network in anorexia nervosa studied with I-123-IMP SPECT. Psychiatry Research - Neuroimaging 2001; 107(1): 45-50.
21. Radua J, Rubia K, Canales-Rodriguez EJ, Pomarol-Clotet E, Fusar-Poli P, Mataix-Cols D. Anisotropic kernels for coordinate-based meta-analyses of neuroimaging studies. Front Psychiatry 2014; 5: 13.
22. Lim L, Radua J, Rubia K. Gray matter abnormalities in childhood maltreatment: a voxel-wise meta-analysis. Am J Psychiatry 2014; 171(8): 854-863.
23. Albajes-Eizagirre A, Solanes A, Vieta E, Radua J. Voxel-based meta-analysis via permutation of subject images (PSI): Theory and implementation for SDM. NeuroImage 2019; 186: 174-184.
24. Radua J, Romeo M, Mataix-Cols D, Fusar-Poli PJCmc. A general approach for combining voxel-based meta-analyses conducted in different neuroimaging modalities. 2013; 20(3): 462-466.
Figures