1653
Neuromelanin MRI as biomarker for treatment resistance in first episode schizophrenia patients1Radiology and Nuclear Medicine, Amsterdam UMC, University of Amsterdam, Amsterdam, Netherlands, 2Psychiatry, Amsterdam UMC, University of Amsterdam, Amsterdam, Netherlands
Synopsis
The current study assessed whether neuromelanin sensitive MRI (NM-MRI) is a potential biomarker for treatment resistance (TR) in first episode schizophrenia patients. NM-MRI is a novel MRI sequence, which indirectly measures dopamine synthesis. Twenty-three first episodes schizophrenia patients underwent a NM-MRI scan, treatment response was determined during follow-up. Standardized and manual segmentation protocols of the NM-MRI data were used and compared. Both segmentation protocols showed significantly lower NM-MRI signal in TR compared to responders. These findings demonstrate the potential of NM-MRI as biomarker. The predictive value of NM-MRI for TR and optimal segmentation method still require further investigation
Introduction
Treatment resistance (TR) in schizophrenia is a major clinical problem with 20-35% of psychotic patients showing non-response to standard antipsychotic treatment (1). A biomarker that could predict TR is needed to reduce the delay in effective treatment. A well-established finding in schizophrenia, using [18F]F-DOPA positron emission tomography (PET) imaging, is increased striatal dopamine synthesis, but interestingly TR patients do not show this altered synthesis(2). [18F]F-DOPA however is too costly and invasive to use for TR screening. A novel neuromelanin-sensitive MRI sequence NM-MR, which indirectly measures striatal dopamine synthesis(3), has potential as biomarker for TR. NM-MRI indeed shows increased signal in schizophrenia patients, but has not yet been tested in TR(4). The current study assessed 1) NM-MRI as a biomarker for TR, and investigated if TR patients show lower NM-MRI signal than responders, and 2) the optimal analysis method, by comparing two different segmentation protocols of the NM-MRI data.Methods
Twenty-three first episode schizophrenia patients underwent a NM-MRI scan. Treatment response was determined during a six months follow-up. A patient was classified as TR after showing no adequate response to a minimum of two sufficiently dosed conventional antipsychotics. NM-MRI scan contained a T1-weighted gradient recalled echo (GRE) sequence with resonance magnetization transfer preparation pulses (8 slices; slice thickness=2.5mm; TR=260ms; TE=3.9ms; FOV=162x199x22mm; voxelsize=0.39x0.39mm) and was conducted on an 3 Tesla Ingenia MRI scanner equipped with a 32-channel sense head coil. NM levels in the Substantia Nigra (SN) were measured as contrast ratio (NMcr), with the Crus Cerebri (CC) as reference region. The signal intensities in the SN and the CC were determined by a manual segmentation and a standardized segmentation protocol (Figure 1). For the standardized segmentation, the NM-MRI scans were normalized into MNI standard brain space. Template masks for both the SN and CC were created by manual tracing on an average image of the 23 standardized NM-MRI scans. These masks were then placed on each individual standardized scan to obtain the signal intensity of the SN and CC of each patient.Results
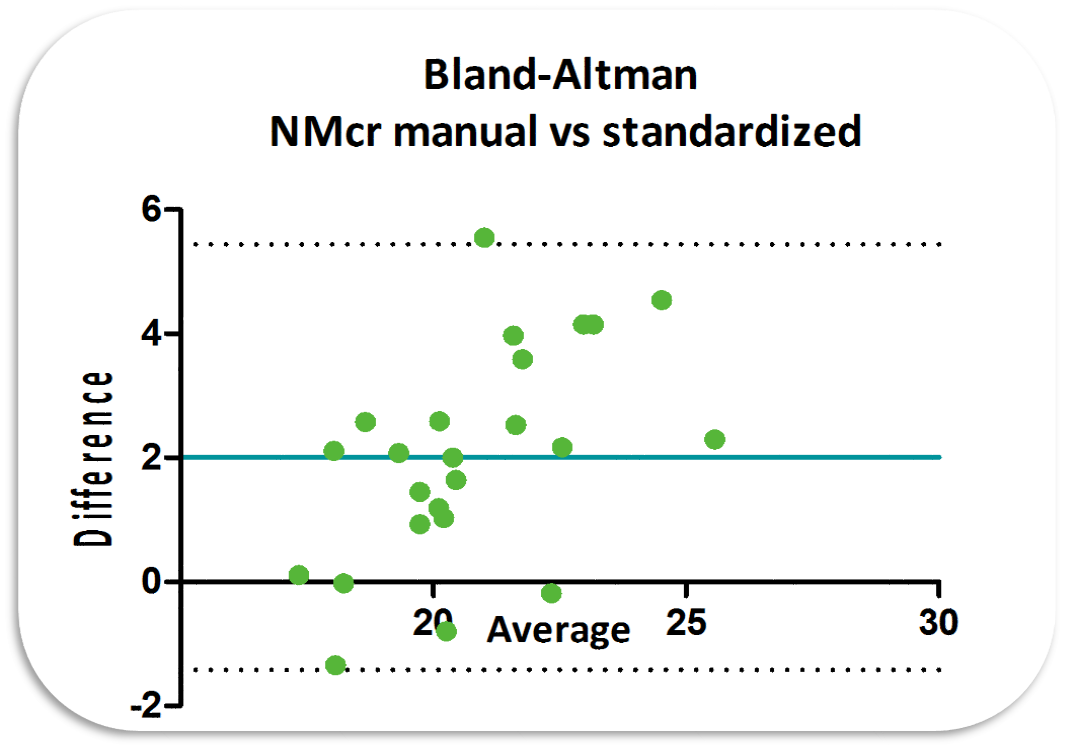
Eight patients were classified as TR and 15 patients as responders. The two groups did not significantly differ on gender, age, IQ, use of medication, and substance use. However, the duration of medication use was longer in the TR patients, t(21)= -1.873 p = 0.039. The standardized and manual segmentation methods both demonstrated that mean NMcr of the TR patients was significantly lower than the mean NMcr of the responders, t(21)= 2.318, p = 0.031 and t(21) = 3.043, p = 0.006, respectively (Figure 2). A moderate correlation (ICC=0.66) was found between the NMcr-standardized and NMcr-manual measurements, Figure 3 shows the Bland Altman plot. For the standardized segmentation, no correlations were found between NMcr and age and duration of medication use in both TR and responders. For the manual segmentation only a correlation was found between NMcr and age in the responders (r =0.530, p =0.042) and not in the TR group.Discussion
Both segmentation methods showed significant lower NMcr levels in TR patients compared to responders. These findings are in line with the [18F]F-DOPA studies, showing lower dopamine synthesis in TR compared to responders. However, there was only a moderate correlation between the two segmentation protocols, which might be explained by the normalizing step in standardized protocol. The standardized mask did not fit each normalized scan perfectly (Figure 1), indicating remaining individual difference in SN shape and size. Hence, normalization of the SN remains challenging and needs to be improved. Since the manual protocol allows one to segment the SN of each participant by hand, the rater could more accurately section as much of the SN as necessary, and accordingly may provide a more reliable result. The application of NM-MRI as a predictor for TR remains uncertain, as there is an overlap in the NMcr levels obtained in TR and responders. A possible explanation for this might be that categorizing patients as either TR or responders is not appropriate as the response to antipsychotics could be a spectrum, including a group of partial responders. Furthermore, other factors (e.g. dosage of antipsychotic medication, history of drug use) could also influence the NMcr and need to be further investigated.Conclussion
This study demonstrated the potential of NM-MRI as a biomarker for TR in schizophrenia. Currently the manual segmentation method appears to provide the most reliable results, although further development of the standardized method is needed. Even though the results of this study show significant differences in NMcr between TR and responders, the predictive value of NM-MRI still requires further investigation.Acknowledgements
No acknowledgement found.References
1. Farooq, S., Agid, O., Foussias, G., & Remington, G. (2013). Using treatment response to subtype schizophrenia: Proposal for a new paradigm in classification. Schizophrenia Bulletin, 39(6), 1169-1172.
2. Demjaha, A., Murray, R. M., McGuire, P. K., Kapur, S., & Howes, O. D. (2012). Dopamine synthesis capacity in patients with treatment-resistant schizophrenia. American Journal of Psychiatry, 169(11), 1203-1210.
3. Sasaki, M., Shibata, E., Kudo, K., & Tohyama, K. (2008). Neuromelanin-sensitive MRI. Clinical Neuroradiology, 18(3), 147-153.
4. Shibata, E., Sasaki, M., Tohyama, K., Otsuka, K., Endoh, J., Terayama, Y., & Sakai, A. (2008). Use of neuromelanin-sensitive MRI to distinguish schizophrenic and depressive patients and healthy individuals based on signal alterations in the substantia nigra and locus ceruleus. Biological psychiatry, 64(5), 401-406.
Figures